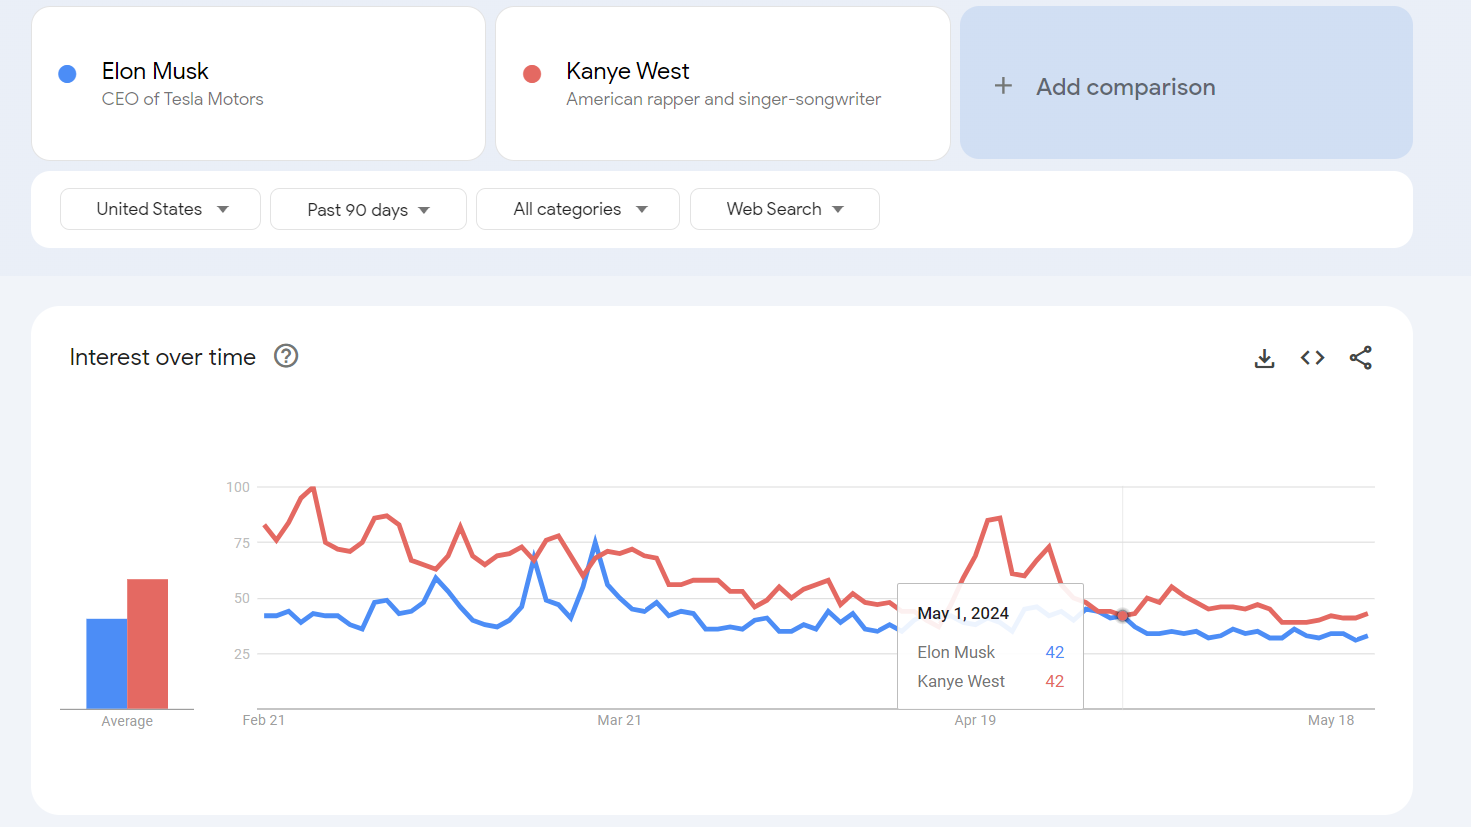
Resolution will be based on this Google Trends page, which compares the Search Topic Elon Musk to the Search Topic Kanye West in the United States in the past 90 days.
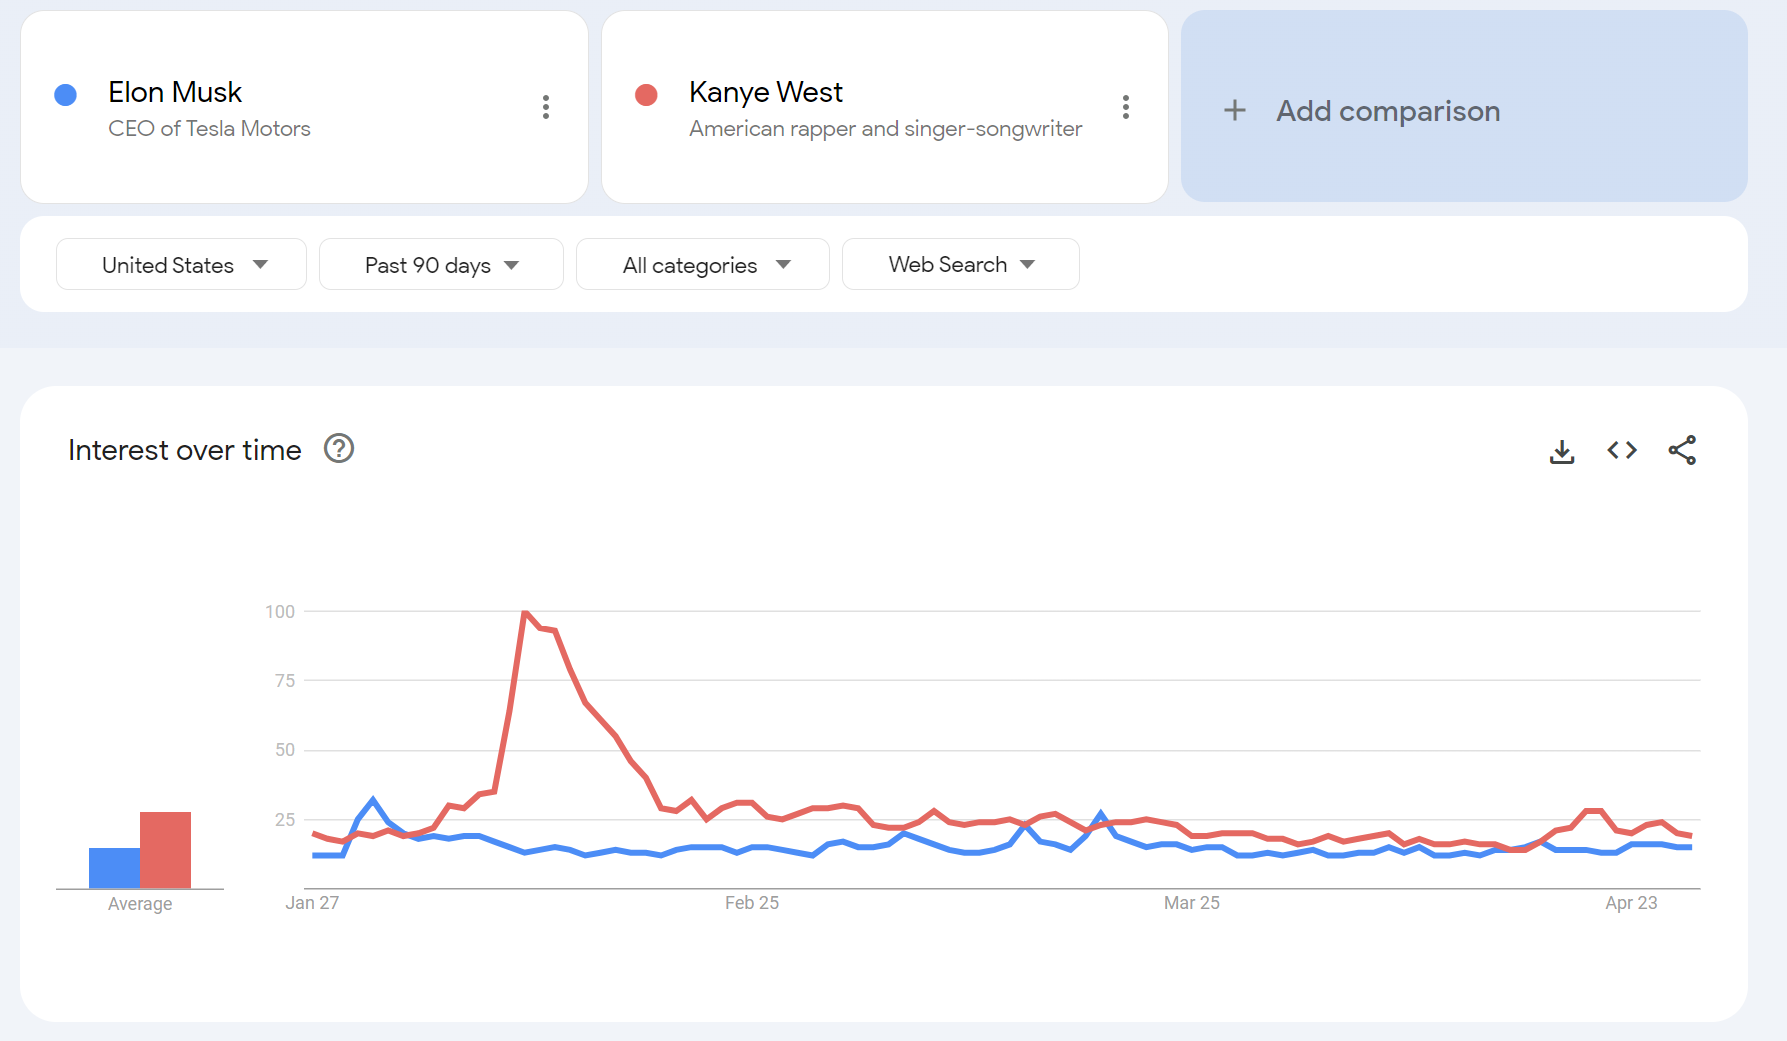
Kanye is currently ahead of Elon. This market resolves YES If Elon is shown to be ahead of Kanye during any day in May using these same parameters, or otherwise resolves NO. A tie does not count, nor does being ahead on a day before the data for that day is finalized.
 1,000
1,000🏅 Top traders
| # | Trader | Total profit |
|---|---|---|
| 1 | Ṁ697 | |
| 2 | Ṁ458 | |
| 3 | Ṁ419 | |
| 4 | Ṁ229 | |
| 5 | Ṁ226 |
People are also trading

@Joshua This metric ended up being weirdly volatile, but the resolution feels fair (even though I held No at close)


Seems legit but I'll wait to resolve until I'm sure it's legit
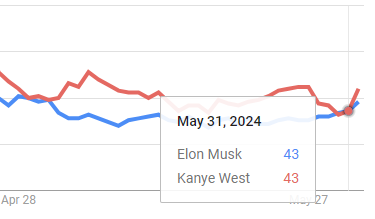
@Joshua See, now I'm seeing Elon +1 from the 30th but tied the 1st and 31st. Seeing Yes is likely, but the system is too volatile to recommend.
@Panfilo My current guess is that the data is different for different time zones, because it's counting days according to midnight in your time zone.
I'm in PST, but I think it would be reasonable to resolve YES if the finalized data is consistently showing Elon ahead for any time zone, once the month is over.
But if it keeps flipping back and forth even for the people who have seen Elon ahead on past days, then I think that's just a rounding bug of some kind and it would be wrong to resolve yes based on an intermittent error
@Panfilo Either way I appreciate delaying an extra day or two. I think this might just not be a great res criteria after all, sadly. I get the temptation though!
@Panfilo It was showing Elon winning today so I continued selling, but now it's aligned again. It was also showing Kanye up by one point from May 1st! Bonkers.
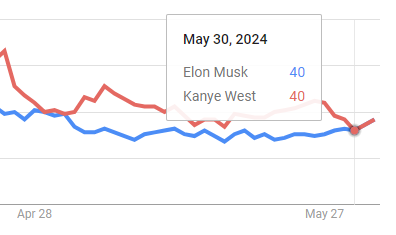
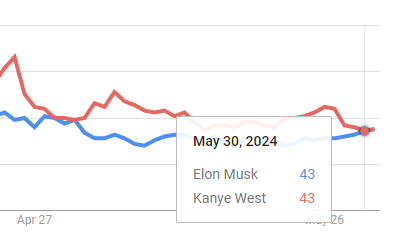

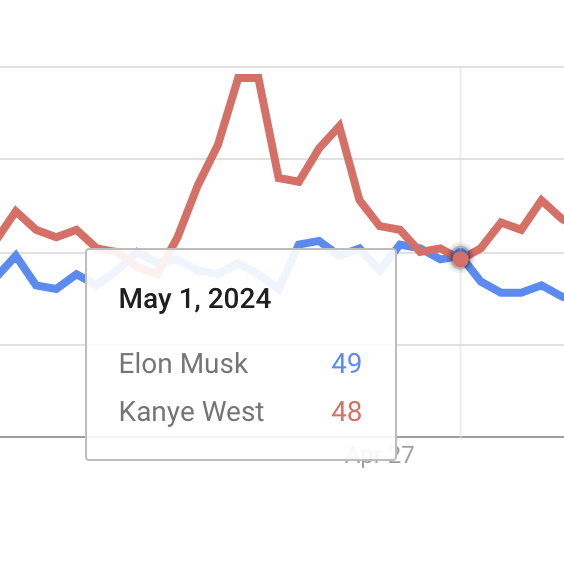

@Bayesian I see both at 45 for May 30 and both at 49 for May 1. Data may not be complete for May 30?
@Bayesian I'm going to check what the chart looks like on June 1st and 2nd to be sure the data is final.

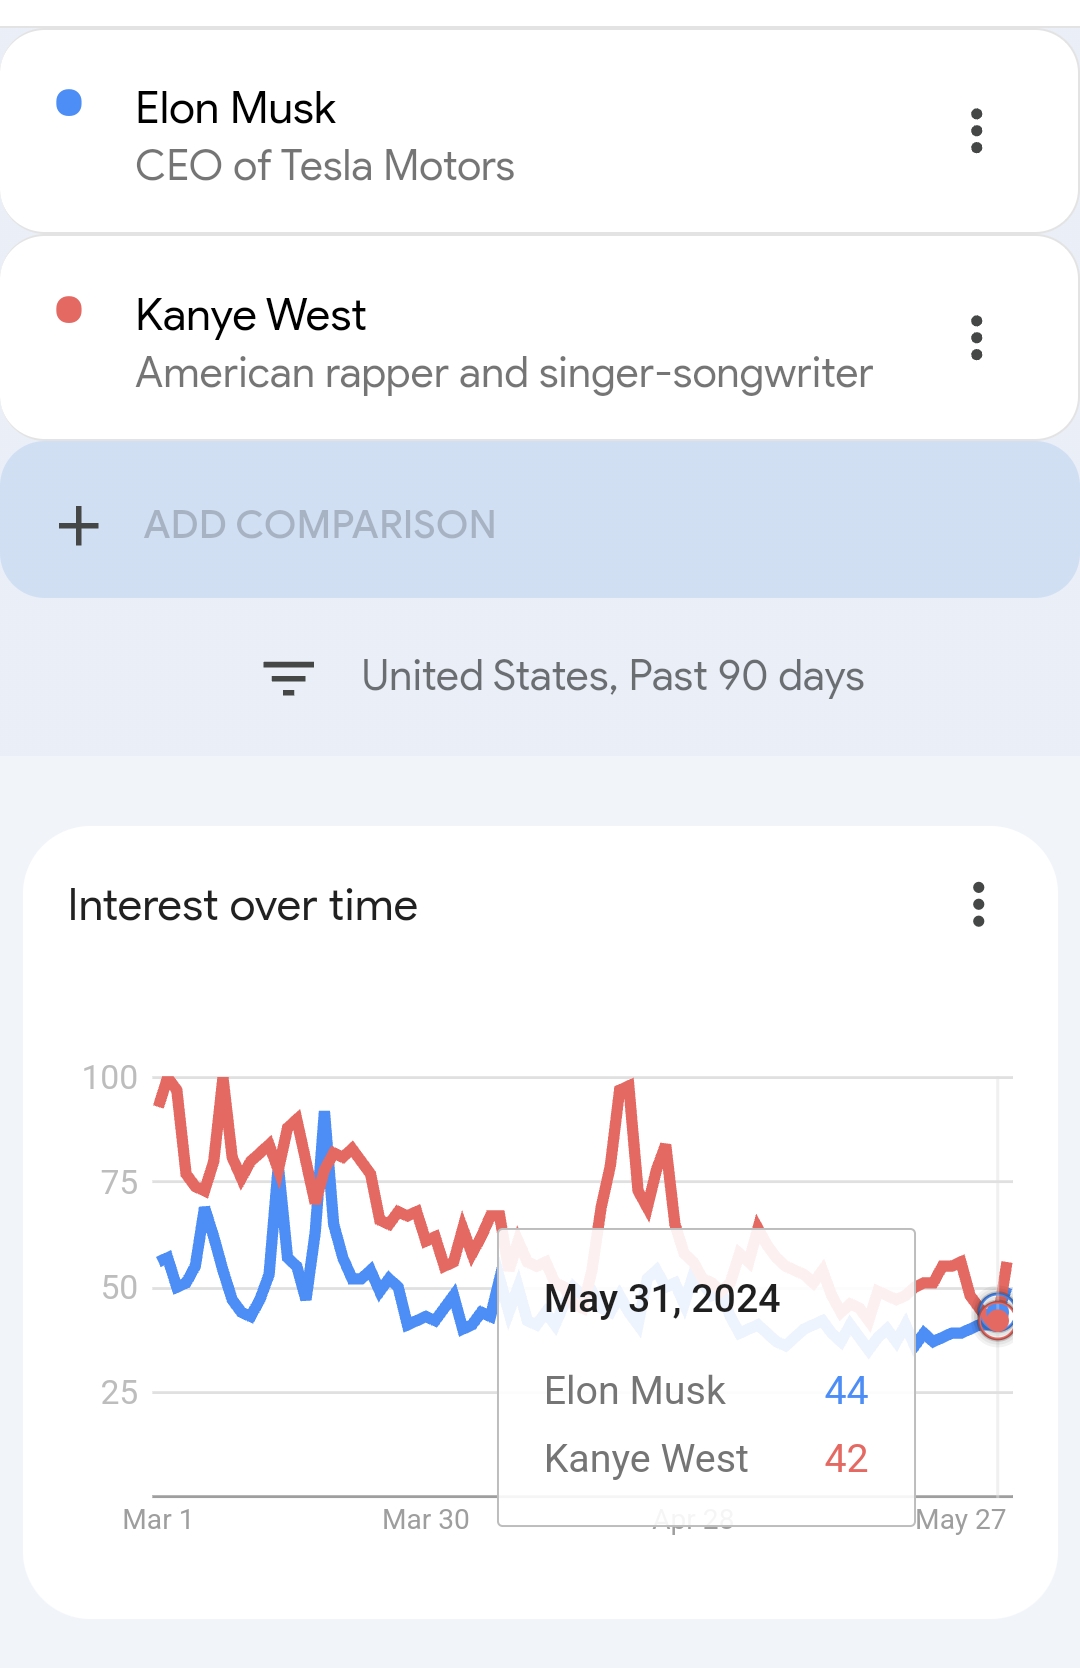
@Ricky30235 Interesting, for me it shows them tied at 42 for that day.
I knew that data shown was often incomplete, but odd for it to have changed from you checking it 9 hours ago to me checking it now. I'm inclined to resolve yes based on your screenshot, but curious if any other traders might know why this would happen?
@Joshua I'll understand if you resolve yes but it also shows up as tied for me? Could be down to rounding caused by the small spike at the end of his screenshot (that is down in your screenshot) causing the chart to readjust, which would I think fall under "incomplete data" since the spike is incomplete data and therefore the chart readjust is caused by incomplete data.
@DanMan314 Ah, that's a good point! I think I should probably update the criteria here, but I think that's a good case for not counting this for a yes resolution if we know it was due to yesterday's incomplete data. @Ricky30235 Thoughts?
@Joshua Hmm I’m wondering how to interpret the data in the first place now since a spike weeks later shouldn’t affect whether one was Googled more than the other weeks before, right? I’d assumed 3 week old data would be finalized but if it’s not I’d understand if it doesn’t resolve yet
Numbers appear to be % of max in the 90 day period. Later periods can have different max and so could alter the denominator and cause different roundings. However the numerator should be fixed and if one is googled more than the other then I don't see how the roundings don't maintain that order or at least ensure the larger one is always the same or higher. If the number of times googled is the same or practically so then the % displayed should always be the same.
Could different times of viewing or different timezones mean the periods looked at are different? Any better explanations?