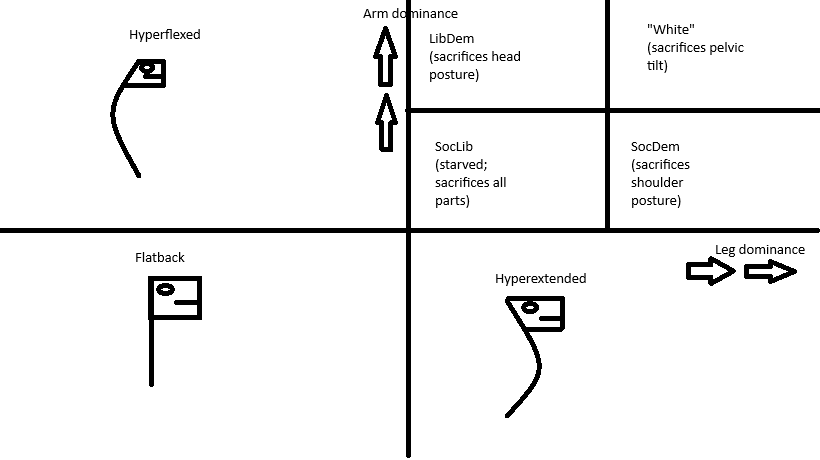
Do you understand this chart?
35
Never closes
Yes
No
See results
Some people have trouble understanding this chart; I would like to see suggestions to improve its readability.
This question is managed and resolved by Manifold.
Market context
Get  1,000 to start trading!
1,000Sort by:
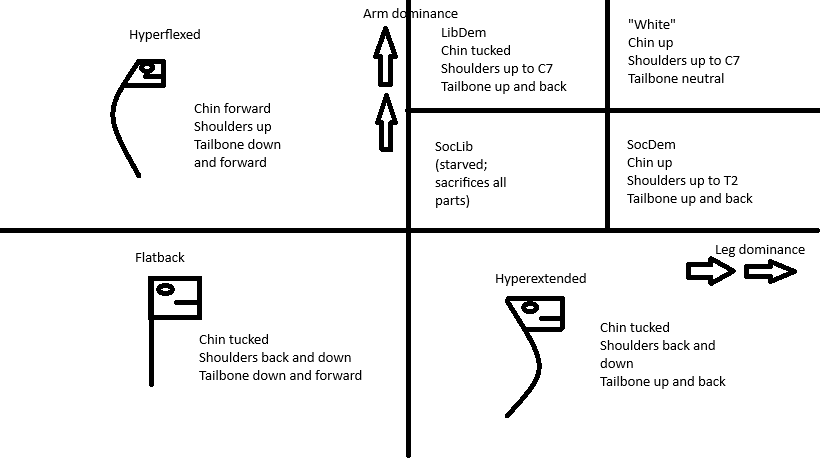
@Haiku It's a chart of human posture. And, yes, the assumption is certain postures are related to politics. Do you have any better suggestions as to how to name them?