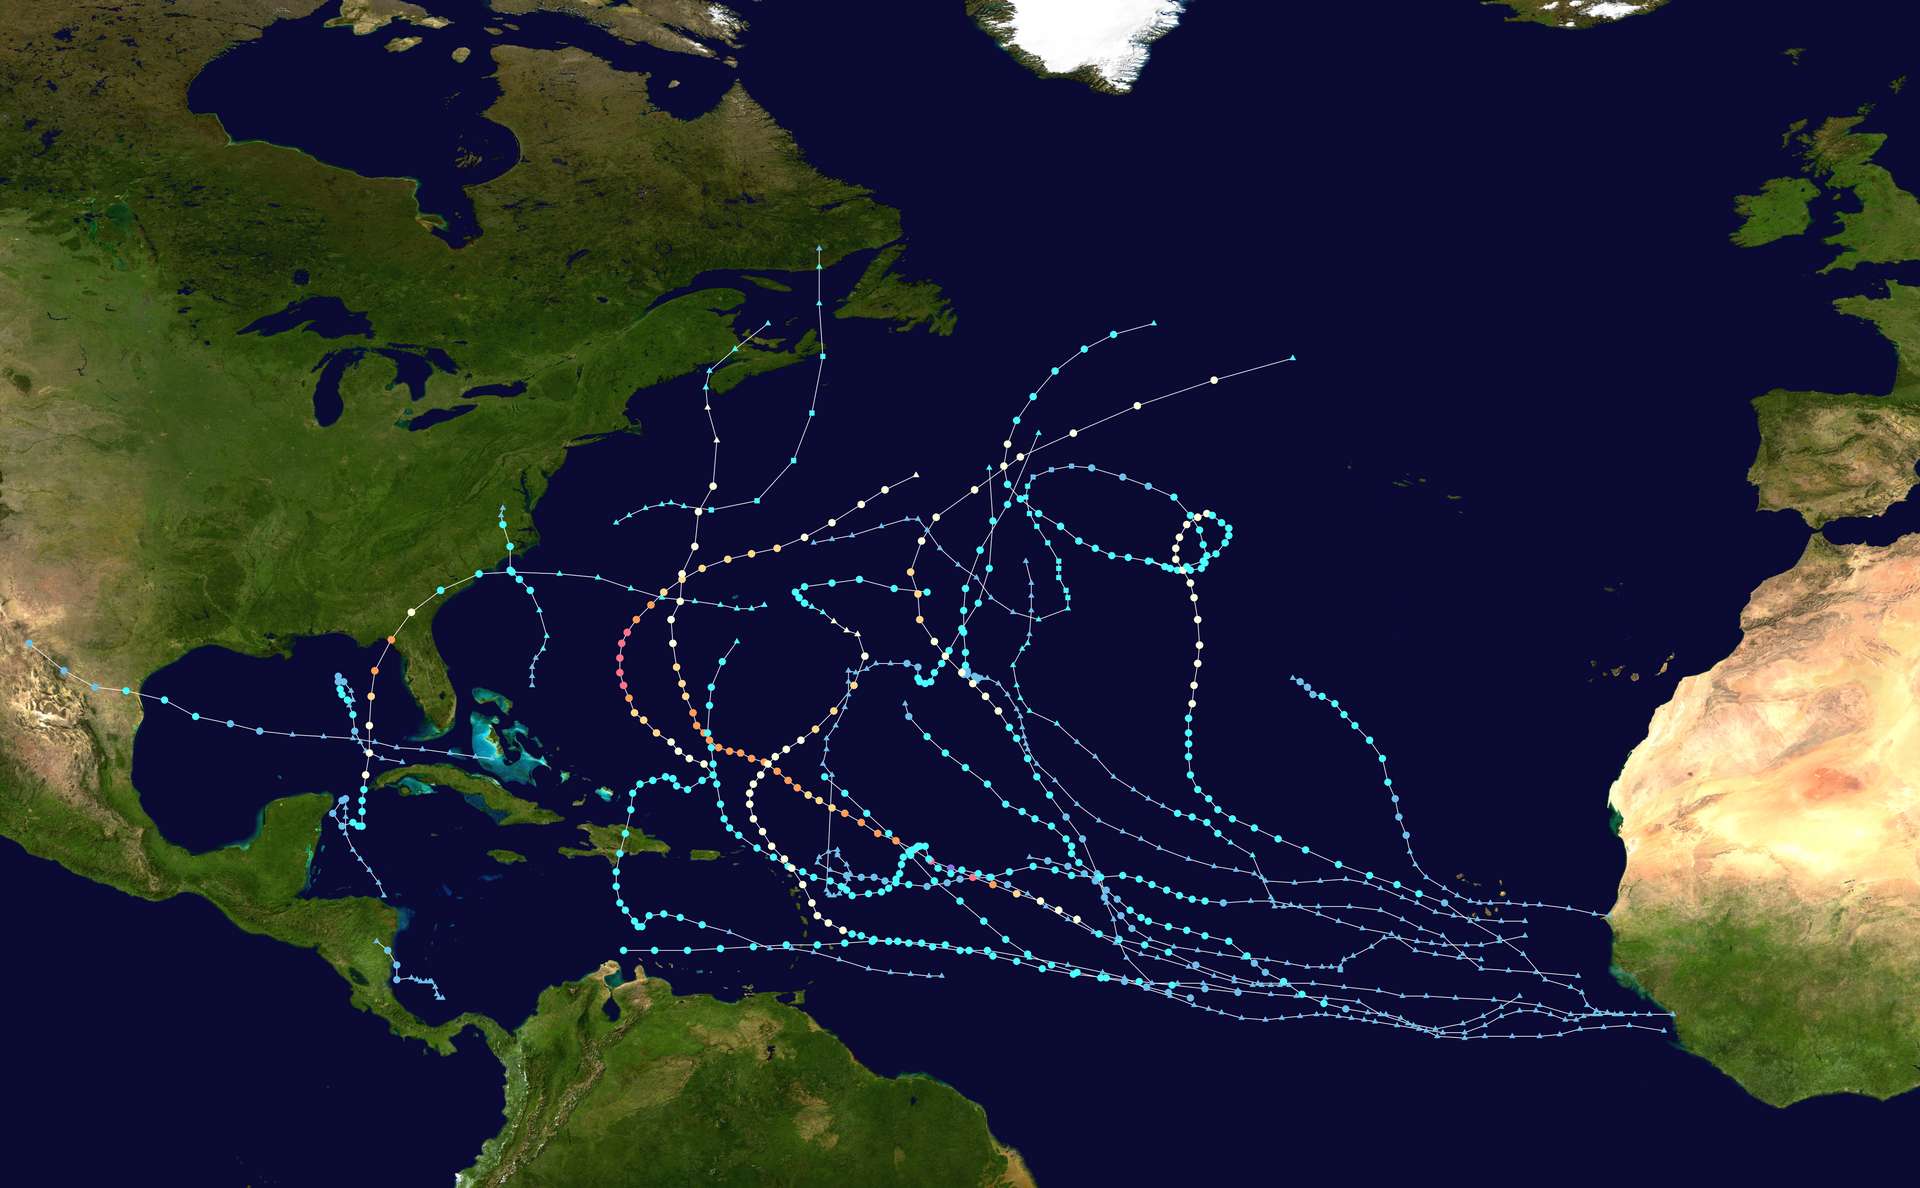
At this time NOAA is estimating that there will be:
"...a 70% chance of 14-21 named storms, of which 6-11 could become hurricanes, and 2-5 could become major hurricanes."
https://www.nesdis.noaa.gov/news/noaa-releases-updated-2023-atlantic-hurricane-season-outlook
But there are some complexities in play as well with a moderate El Nino with their sheering winds that limit hurricane formation and a very strong warming cycle in the Atlantic Multidecadal Oscillation (AMO) that promotes hurricanes.
https://weather.com/safety/hurricane/news/2023-08-10-august-noaa-2023-hurricane-season-outlook-update
🏅 Top traders
| # | Trader | Total profit |
|---|---|---|
| 1 | Ṁ297 | |
| 2 | Ṁ217 | |
| 3 | Ṁ105 | |
| 4 | Ṁ44 | |
| 5 | Ṁ32 |
People are also trading
⚠ @DSchwartz Appears Inactive
📝Proof Posted
🧙♂️ Mod Resolves to answer 3
SOURCE (NOAA)

Hurricane Idalia : Florida
TS Ophelia : North Carolina
TS Harold: : Texas
I am getting in the region of 40% chance of a tropical storm after 10 Nov in last 32 years.
But 50% above average number of storms this year so 40% *1.5=60
But El Nino forming year only about half of that (a calc came out at 57% but I think this is too much) so 60% *0.5 = 30%
1 in 6 hit US so about a 5% chance
For 2 to hit 5% * 5% = ~0.25%
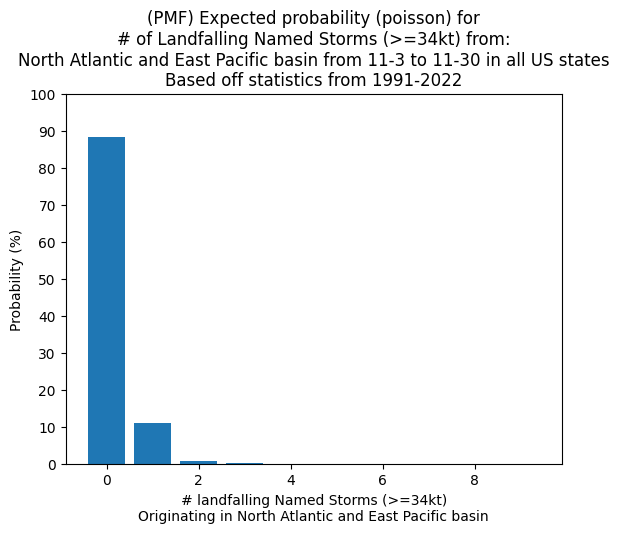
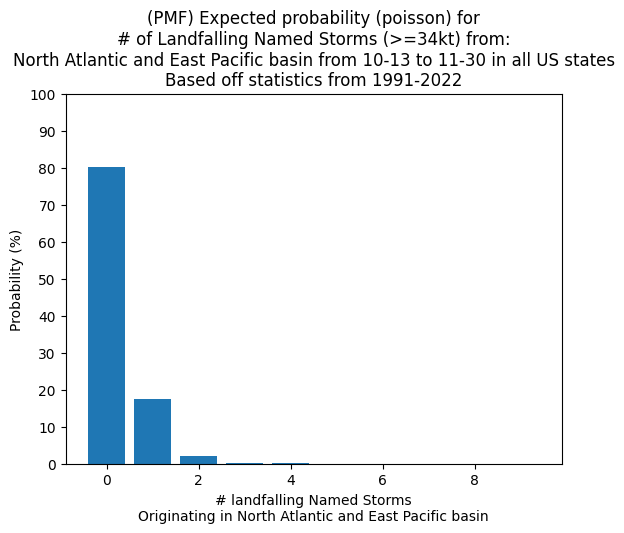
@ChristopherRandles No this is not a percent for each occurrence of these X events per year; it is a poisson type PMF based on the total number of events (landfalls in the specified subperiods mid oct-nov) across 1991-2022 years. Edit: I am probably breaking the independence assumption though (as that there are two storms in 2020 are not purely independent of each other since they were 12 days apart the conditions for those two storms were likely correlated, and as it would be for any storms in the same short period to some degree).
Here are the storms I have making landfall in that period (the landfalls are calculated with my own workbook so they're not an official tally)
               SID  SEASON  NUMBER BASIN SUBBASIN    NAME            ISO_TIME  \
233  1994313N12278    1994     108  None     None  GORDON 1994-11-15 13:00:00
244  1998295N12284    1998      89  None       GM   MITCH 1998-11-05 11:00:00
303  2020306N15288    2020     102  None     None     ETA 2020-11-09 04:00:00
315  2022311N21293    2022      46  None       GM  NICOLE 2022-11-10 19:00:00
294  1999286N16278    1999      89  None     None   IRENE 1999-10-15 13:00:00
313  2005289N18282    2005      97  None       GM   WILMA 2005-10-24 10:30:00
343  2020299N18277    2020     100  None       GM    ZETA 2020-10-28 21:00:00
Only the last one was in LA, the rest were in FL:
    USA_SEARAD_NW  STORM_SPEED  STORM_DIR LANDFALL_STATE month day  \
233                        7.0      314.0             FL    11  15
244                       29.0       55.0             FL    11   5
303            39         17.0      282.0             FL    11   9
315           120         16.0      317.0             FL    11  10
294                       12.0       38.0             FL    10  15
313                       26.0       62.0             FL    10  24
343 120 24.0 25.0 LA 10 28 @parhizj So in 32 years, 26 have none, 5 years have 1 and one year has 2 more.
so that is
3 81%
4 16%
5 3%
very similar to your 80% 18% 2%. Your smoothed path through the data may well be better than having potential large steps down in probabilities as we pass historic events. Irene 1999 had formed a depression by Oct 12 so there may be an argument for dropping that storm assuming that existing storm and invests are not likely to hit US.
Above seem like very minor adjustments to probabilities derived compared to bigger issues:
If 2023 is more active than most years, should probabilities of further storms be increased.
If we are going into El Nino and this tends to lead to season finishing/reduced activity earlier then perhaps probabilities of further storms should be reduced.
These seem much more relevant big adjustments to work on. However I am not sure how to deal with issue 1. Applying a factor for relative activity seems rather dodgy because with 26 years with none whatever the factor(F) that need to be applied for any one of those 26 years 0xF =0 and we still have 26 years with none. Perhaps we just look at season activity to normal and say this year is 50% above normal so increase probabilities of storms by 50%?
Issue 2 might seem a little more tractable. We can look at data for years that went into El Nino. The last 9 are 2018 2014 2009 2006 2004 2002 1997 1994 and 1991. In these years just 1994 had one US landfalling storm after todays date.
1 in 9 years 11% is less than 7 in 32 years 22%
This suggests half the frequency in years going into El Nino.
However this is not a lot of data, 1 in 9 years might easily have a sampling error when it would normally be as low as 0.1 or as high as 2 in 9 years. More data would help reduce this issue. Going back to include earlier years could be helpful. Including all storms rather than just landfalling ones is also a possibility that might help, though if El Nino has more or less of an effect on US landfalling storms than on number of storms it may not be ideal.
These are big adjustments to the probabilities. They likely work in opposite directions so perhaps it is good enough to assume they cancel one another out as a reasonable guess?
Perhaps we should guess / go with my estimates above of increasing by 50% for issue 1 and then halving probabilities for issue 2. (A net 25% reduction.) ?
Haven't updated in a while.. Base rates as before (Poisson PMF) are approximately 88%, 11%, 1% for 3,4,5 respectively.

@ChristopherRandles Thanks. There was a market where the creator still wanted to count it as a cat 5 hurricane (!) so I’d rather check.
@DSchwartz Did you mean Ophelia made landfall in North Carolina as a tropical storm?
Brings total to 3, Tropical Storm Harold, Hurricane Idalia and Tropical Storm Ophelia..
@NicoDelon At the time of August 15th, when this question was created, no named storm had hit the US. https://en.wikipedia.org/wiki/2023_Atlantic_hurricane_season
