Essentially full trillion dollar market cap companies.
Uses https://companiesmarketcap.com/ as the source.
The "Int" function rounds down to the number of whole trillion dollars
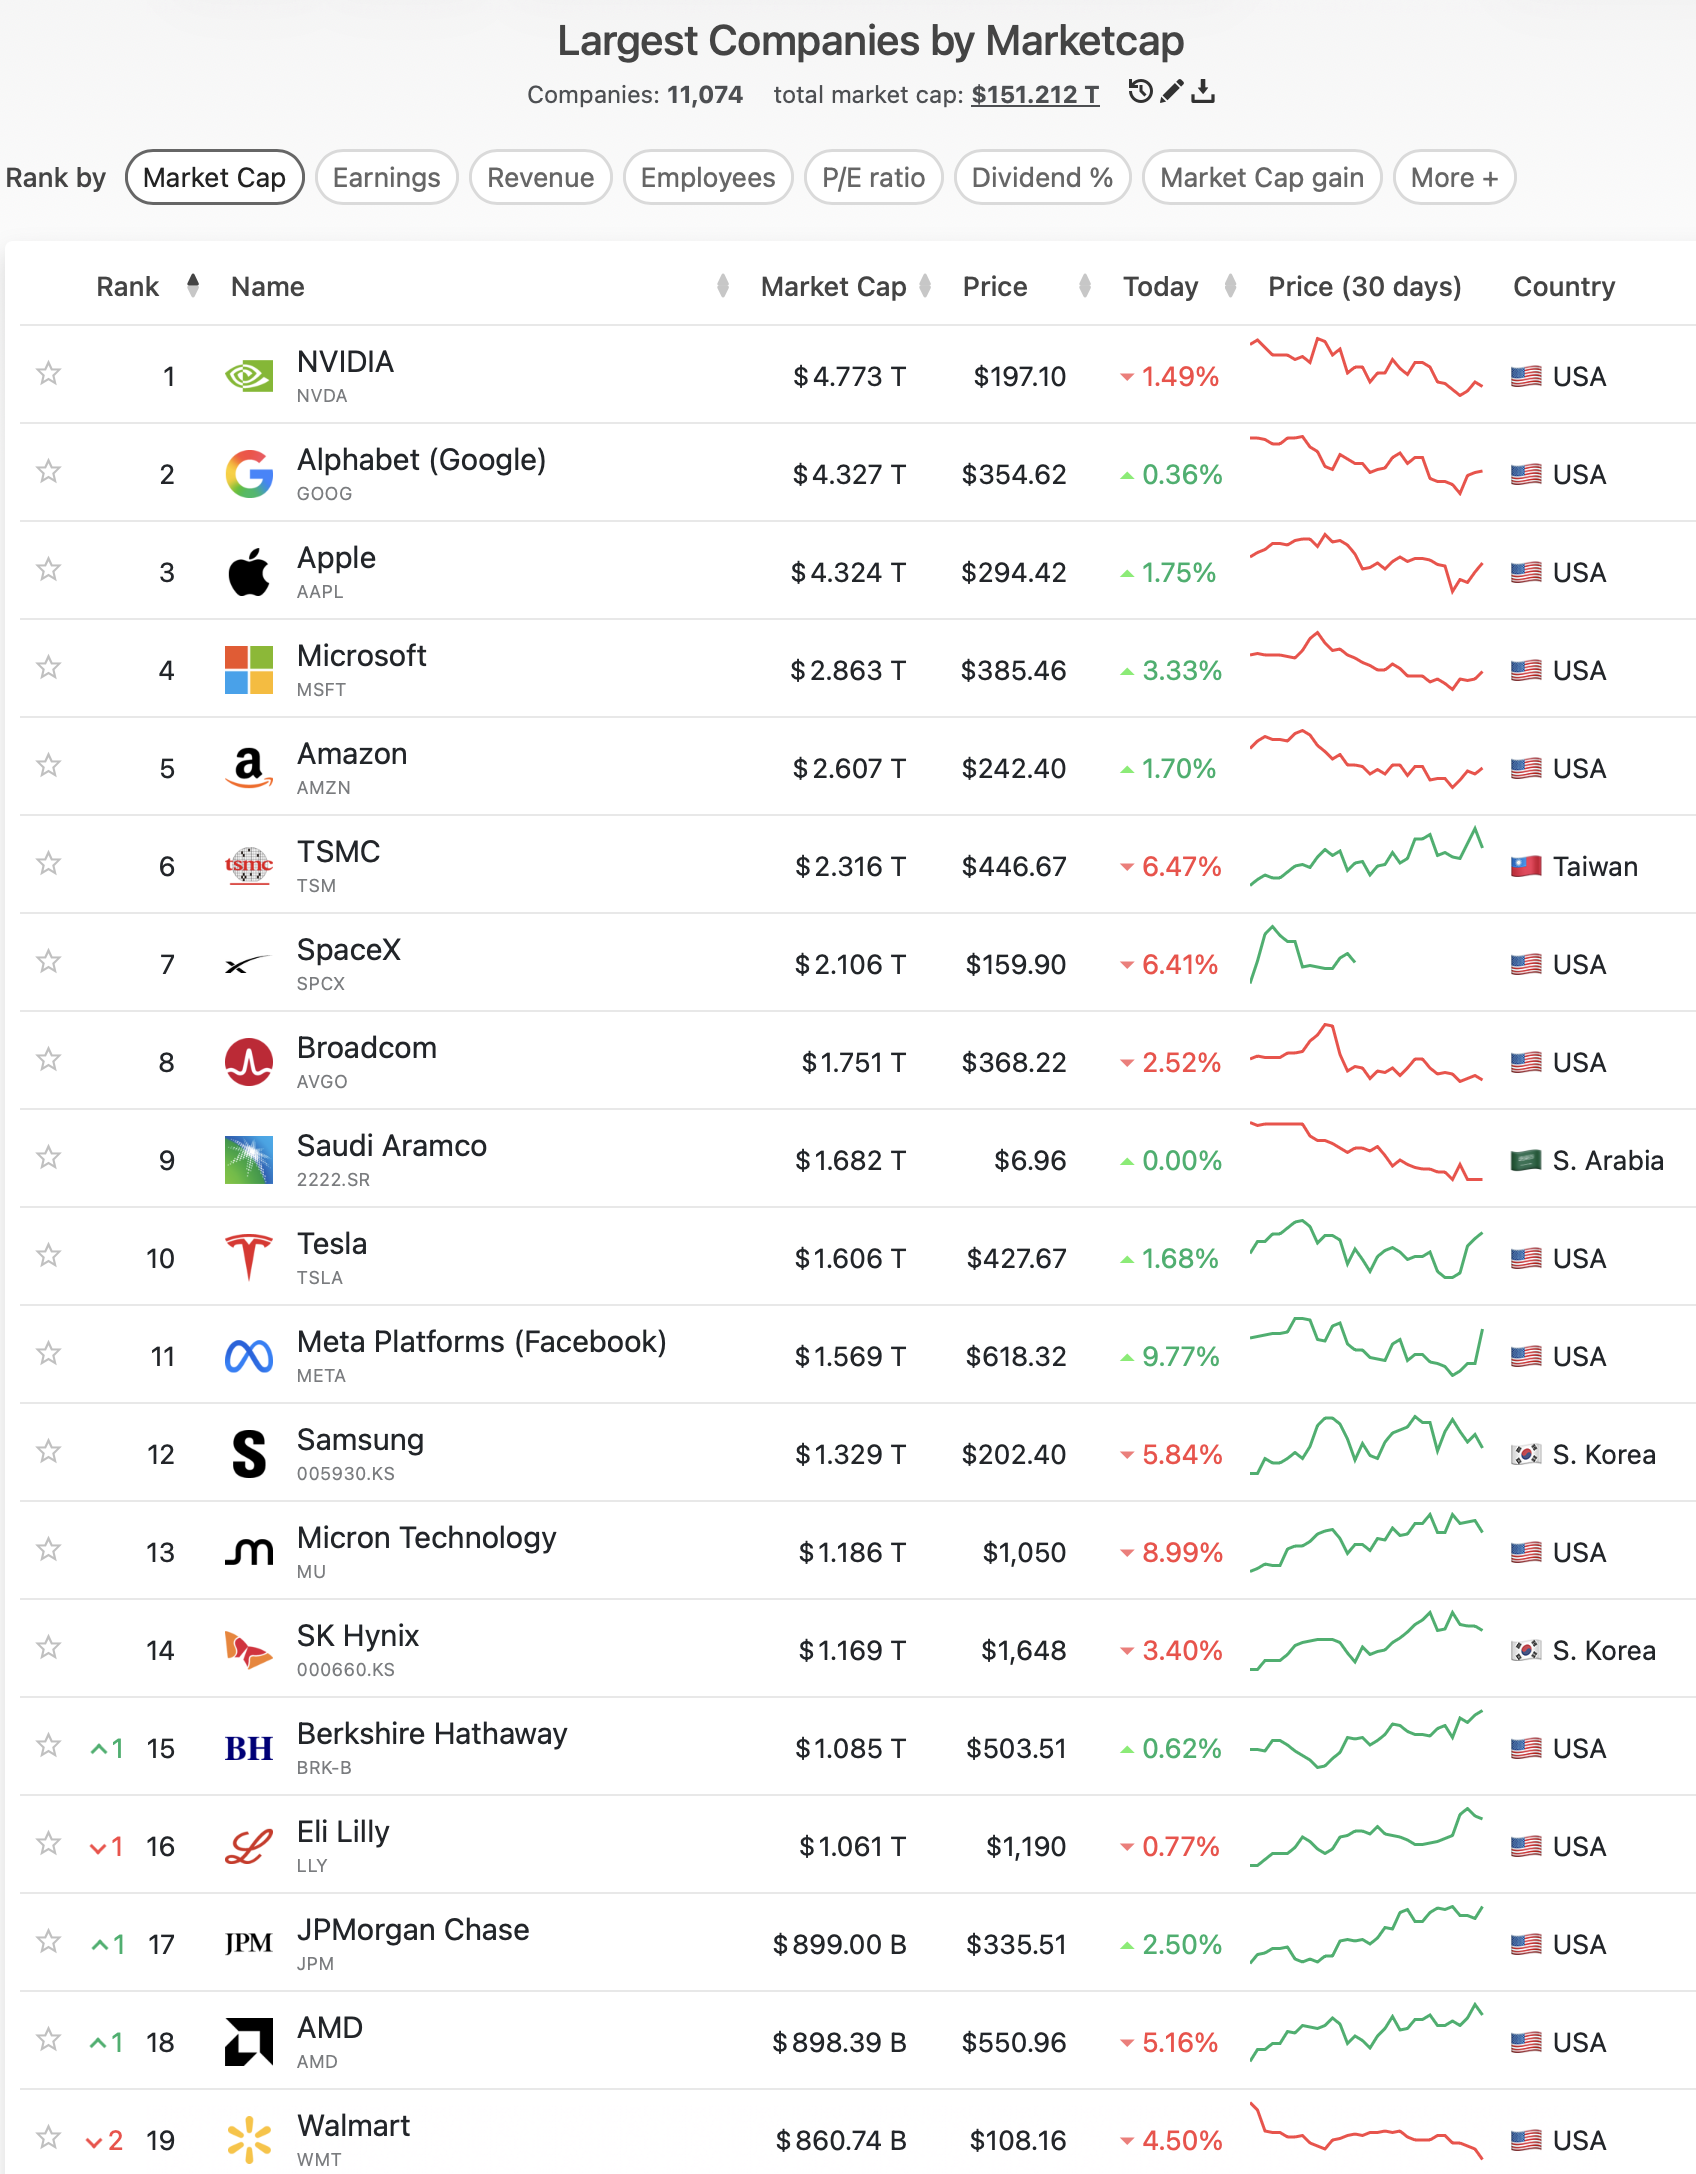
At the time of creating this question on 18 Aug 2025, the list at the source above was
1 NVIDIA NVDA $4.429 T
2 Microsoft MSFT $3.839 T
3 Apple AAPL $3.427 T
4 Alphabet (Google) GOOG$2.460 T
5 Amazon AMZN $2.458 T
6 Meta Platforms (Facebook) META $1.921 T
7 Saudi Aramco 2222.SR $1.555 T
8 Broadcom AVGO $1.417 T
9 TSMC TSM $1.249 T
10 Tesla TSLA $1.075 T
11 Berkshire Hathaway BRK-B $1.030 T
12 Walmart WMT $802.43 B
.
Walmart does not have a market cap of a trillion US$ so does not count. However higher ranked companies do have $1T or more market cap. In this case there are 11 and after rounding down these are added as 4+3+3+2+2+1+1+1+1+1+1 =20
The format hopefully allows sensible order with a-z sort to group by > numbers.
Sort by oldest should group sensibly by month (at present this works though if I need to add other answers for previous months that could spoil this and I may reword answers in order to sort by month alphabetically.)
I will try to keep the > numbers a consistent colour.
 1,000
1,000People are also trading
@ChristopherRandles as of today midsession, I think it's same as yesterday's close. Maybe you could verify by adjusting the "Today" change, but you won't be able to do that after tonight.
@deagol Added those. gone a bit wild with a few companies close to most of the thresholds.
@ChristopherRandles yup amazing that a single session remains and has a conceivable range something like 22-29
@ChristopherRandles no problem. pretty close down to the wire but looks like $22 T this month. thanks!
@ChristopherRandles cool structure! A couple of suggestion to facilitate visualization of the probability surface, if you don't mind:
Assign option colors by total cap threshold level, to more easily discern the 3 months curve at the same cap threshold. Stock market platforms tend to use a red-to-green color scale for low-to-high values, but any other scheme would be fine if you like other colors (red-green is bad for color-blind users).
To enable a more useful alphabetical sort alternative, rename the options with the cap threshold at the beginning of the label, and use the month number with a leading zero, such as "End of Aug 2025 >18.5" would become ">18.5 at end of 2025/08". Then sorting alphabetically should group the same cap thresholds together and the months should be in ascending order. Combined with the previous suggestion it would group the same colors together. Still keep the "Oldest" default sort (which does it by month also very useful) and keep it working if more months get added.
@deagol Thanks makes a lot of sense. Hope these colours are different enough and ok even if they don't follow a pattern.