
Data is currently at
https://data.giss.nasa.gov/gistemp/tabledata_v4/GLB.Ts+dSST.csv
or
https://data.giss.nasa.gov/gistemp/tabledata_v4/GLB.Ts+dSST.txt
(or such updated location for this Gistemp v4 LOTI data)
January 2024 might show as 122 in hundredths of a degree C, this is +1.22C above the 1951-1980 base period. If it shows as 1.22 then it is in degrees i.e. 1.22C. Same logic/interpretation as this will be applied.
If the version or base period changes then I will consult with traders over what is best way for any such change to have least effect on betting positions or consider N/A if it is unclear what the sensible least effect resolution should be.
Numbers expected to be displayed to hundredth of a degree. The extra digit used here is to ensure understanding that +1.20C does not resolve an exceed 1.205C option as yes.
 1,000
1,000🏅 Top traders
| # | Trader | Total profit |
|---|---|---|
| 1 | Ṁ1,160 | |
| 2 | Ṁ352 | |
| 3 | Ṁ130 | |
| 4 | Ṁ25 | |
| 5 | Ṁ3 |
People are also trading
87% here
37% at https://manifold.markets/PaperBoy/will-july-2024-be-the-hottest-july-ad906e6a31df
polymarket at 77%
Some arbitrage opportunity?

Been looking at poly..
Edit:
@aenews I’m not sure about that Japanese reanalysis chart.. ..not sure what the range of differences is between the JRA set and gistemp
https://twitter.com/25_cycle/status/1820151708770529392
Would be great if I had some time to remake this chart from the JRA3Q paper:
https://www.jstage.jst.go.jp/article/jmsj/102/1/102_2024-004/_figures/102_49_017.png
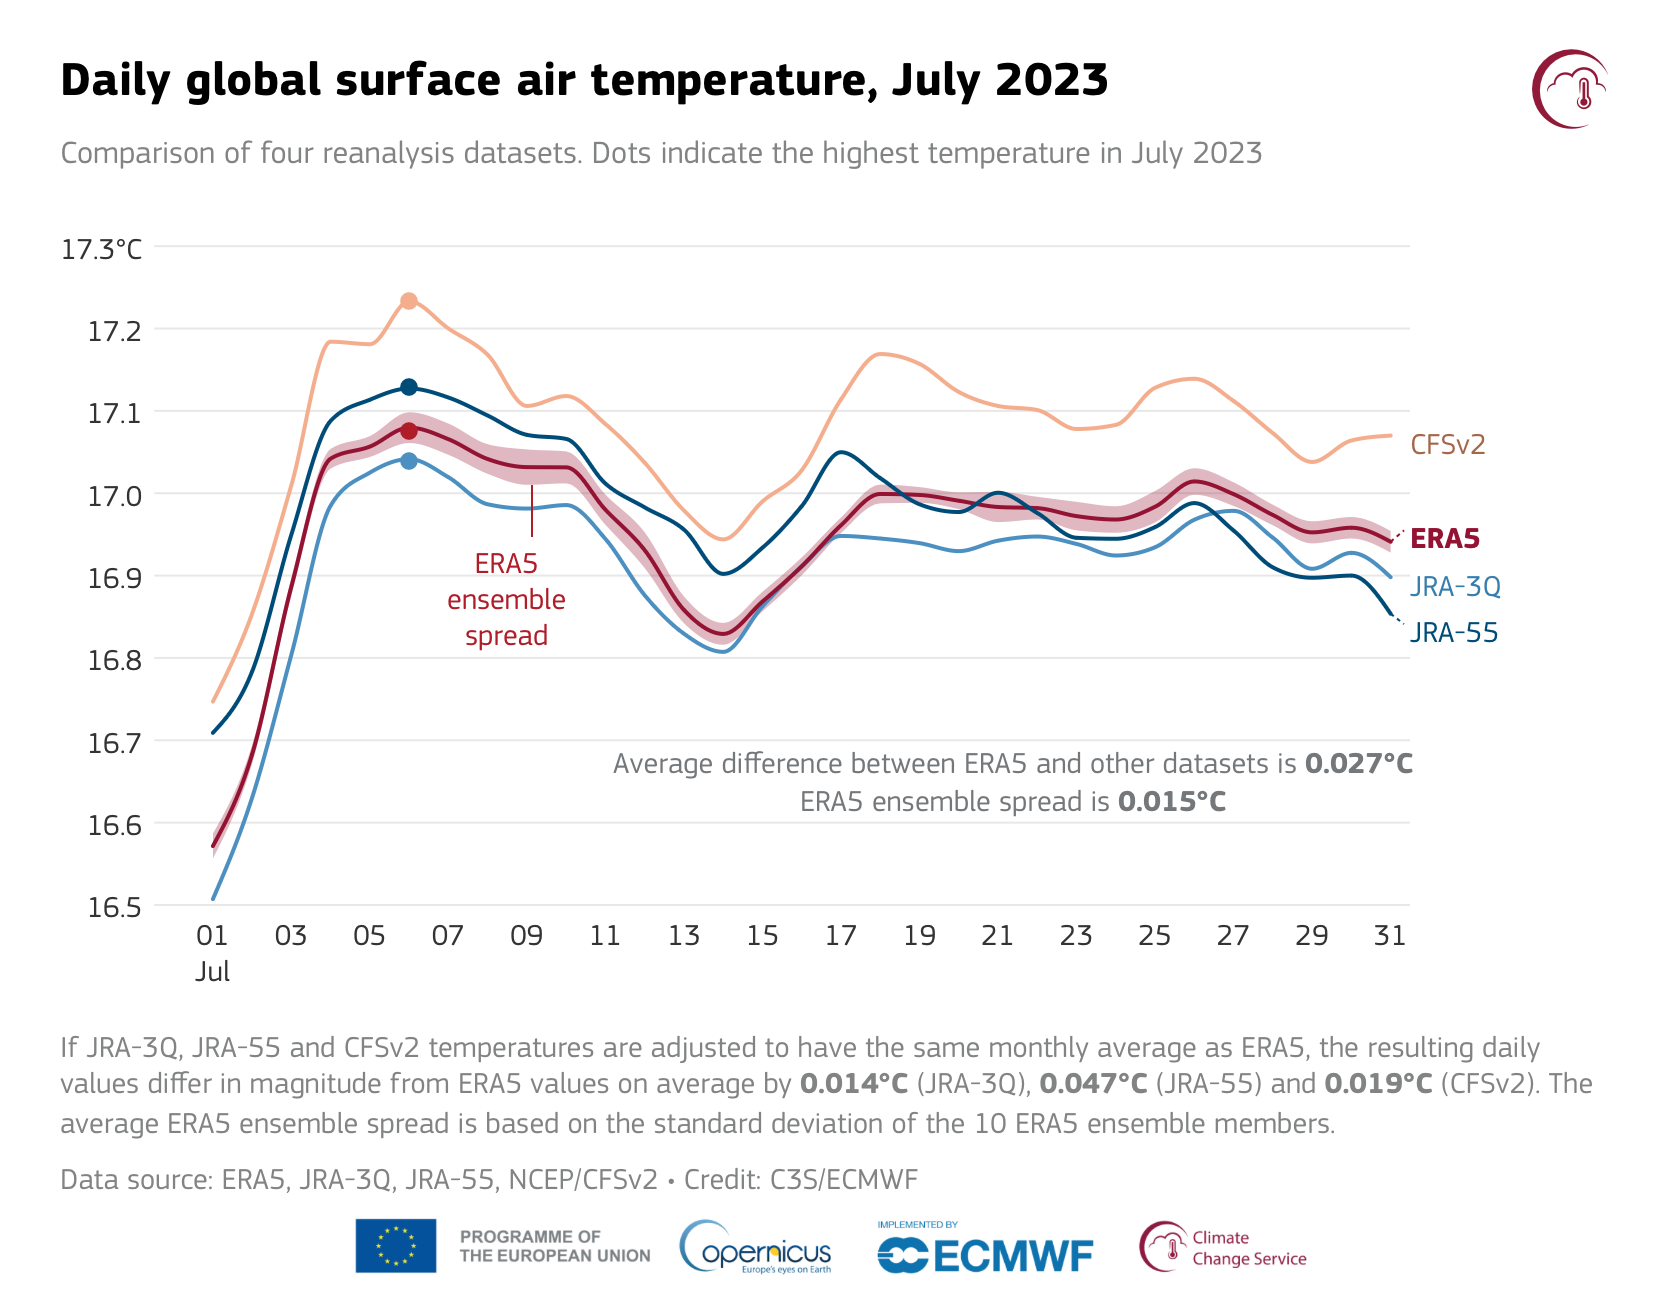
JRA3Q was about 0.05 different from ERA last July. (JRA was Cooler)
http://climate.copernicus.eu/what-degree-uncertainty-c3s-daily-global-temperature-data
“
This is typical of differences between the two datasets for the months of July and August, which averages 0.05°C for the climatological reference period 1991-2020”
For reference, for ERA5 (daily data) :
mean(july2024) - mean(july2023) ~= -0.04 C
Notable comments on polymarket (I don’t have a background in statistics nor climatology so I can’t judge too well)
This comment is a stark reminder of the reason why Christopher has already set up this market the way he has…
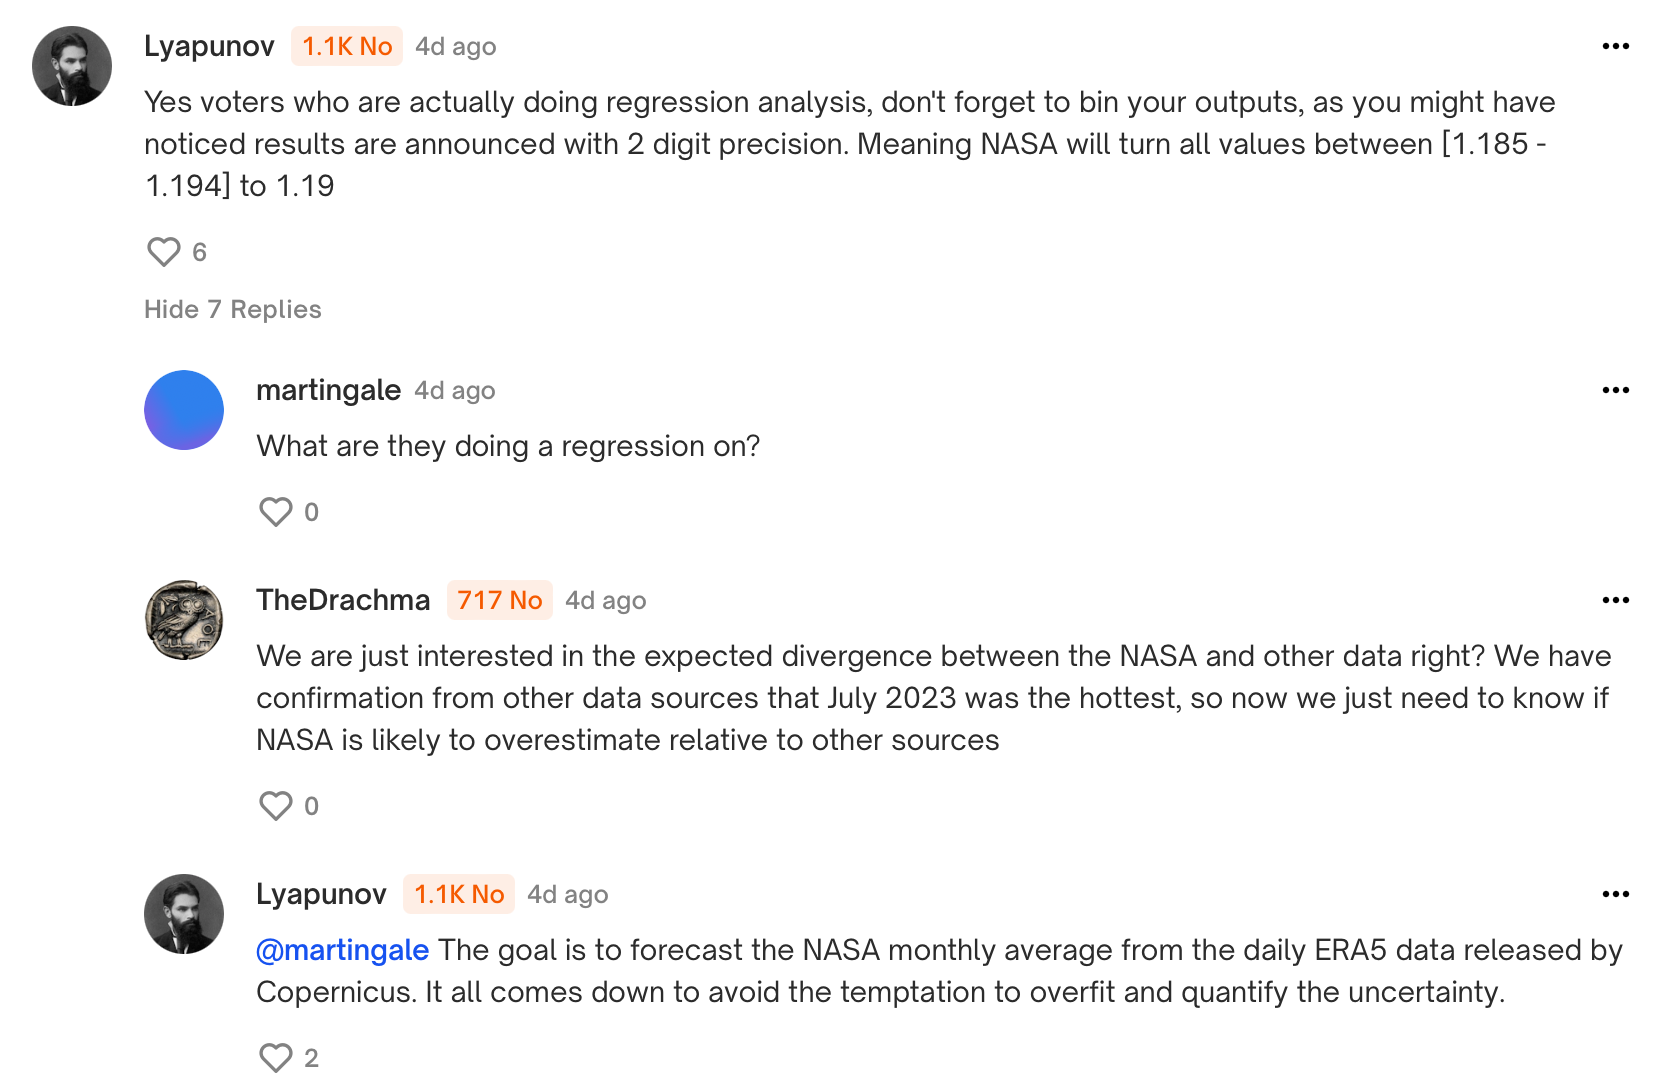
The following sounds like it might be overfit but who knows .. at least their 95% CI seems wide enough with 0.14 C given each data set has 0.05 C uncertainty and can potentially stack multiple times (across years for comparison and between datasets). (linear regression shows a bias as well for me, but there is a lot of uncertainty in early years (I go all the way back to 1940 to use all the pulse data.. no idea whether this is worse than using an arbitrary cutoff even if seems informed by RMSE without validation (small size too small for too meaningful validation)). Since my analysis follows a similar idea I can say with about 80 samples I only have 20 for validation for each month .. so I don’t place too much confidence in my own uncertainty estimates… bootstrapping with 80 samples in the same situation seems the same type of problem…
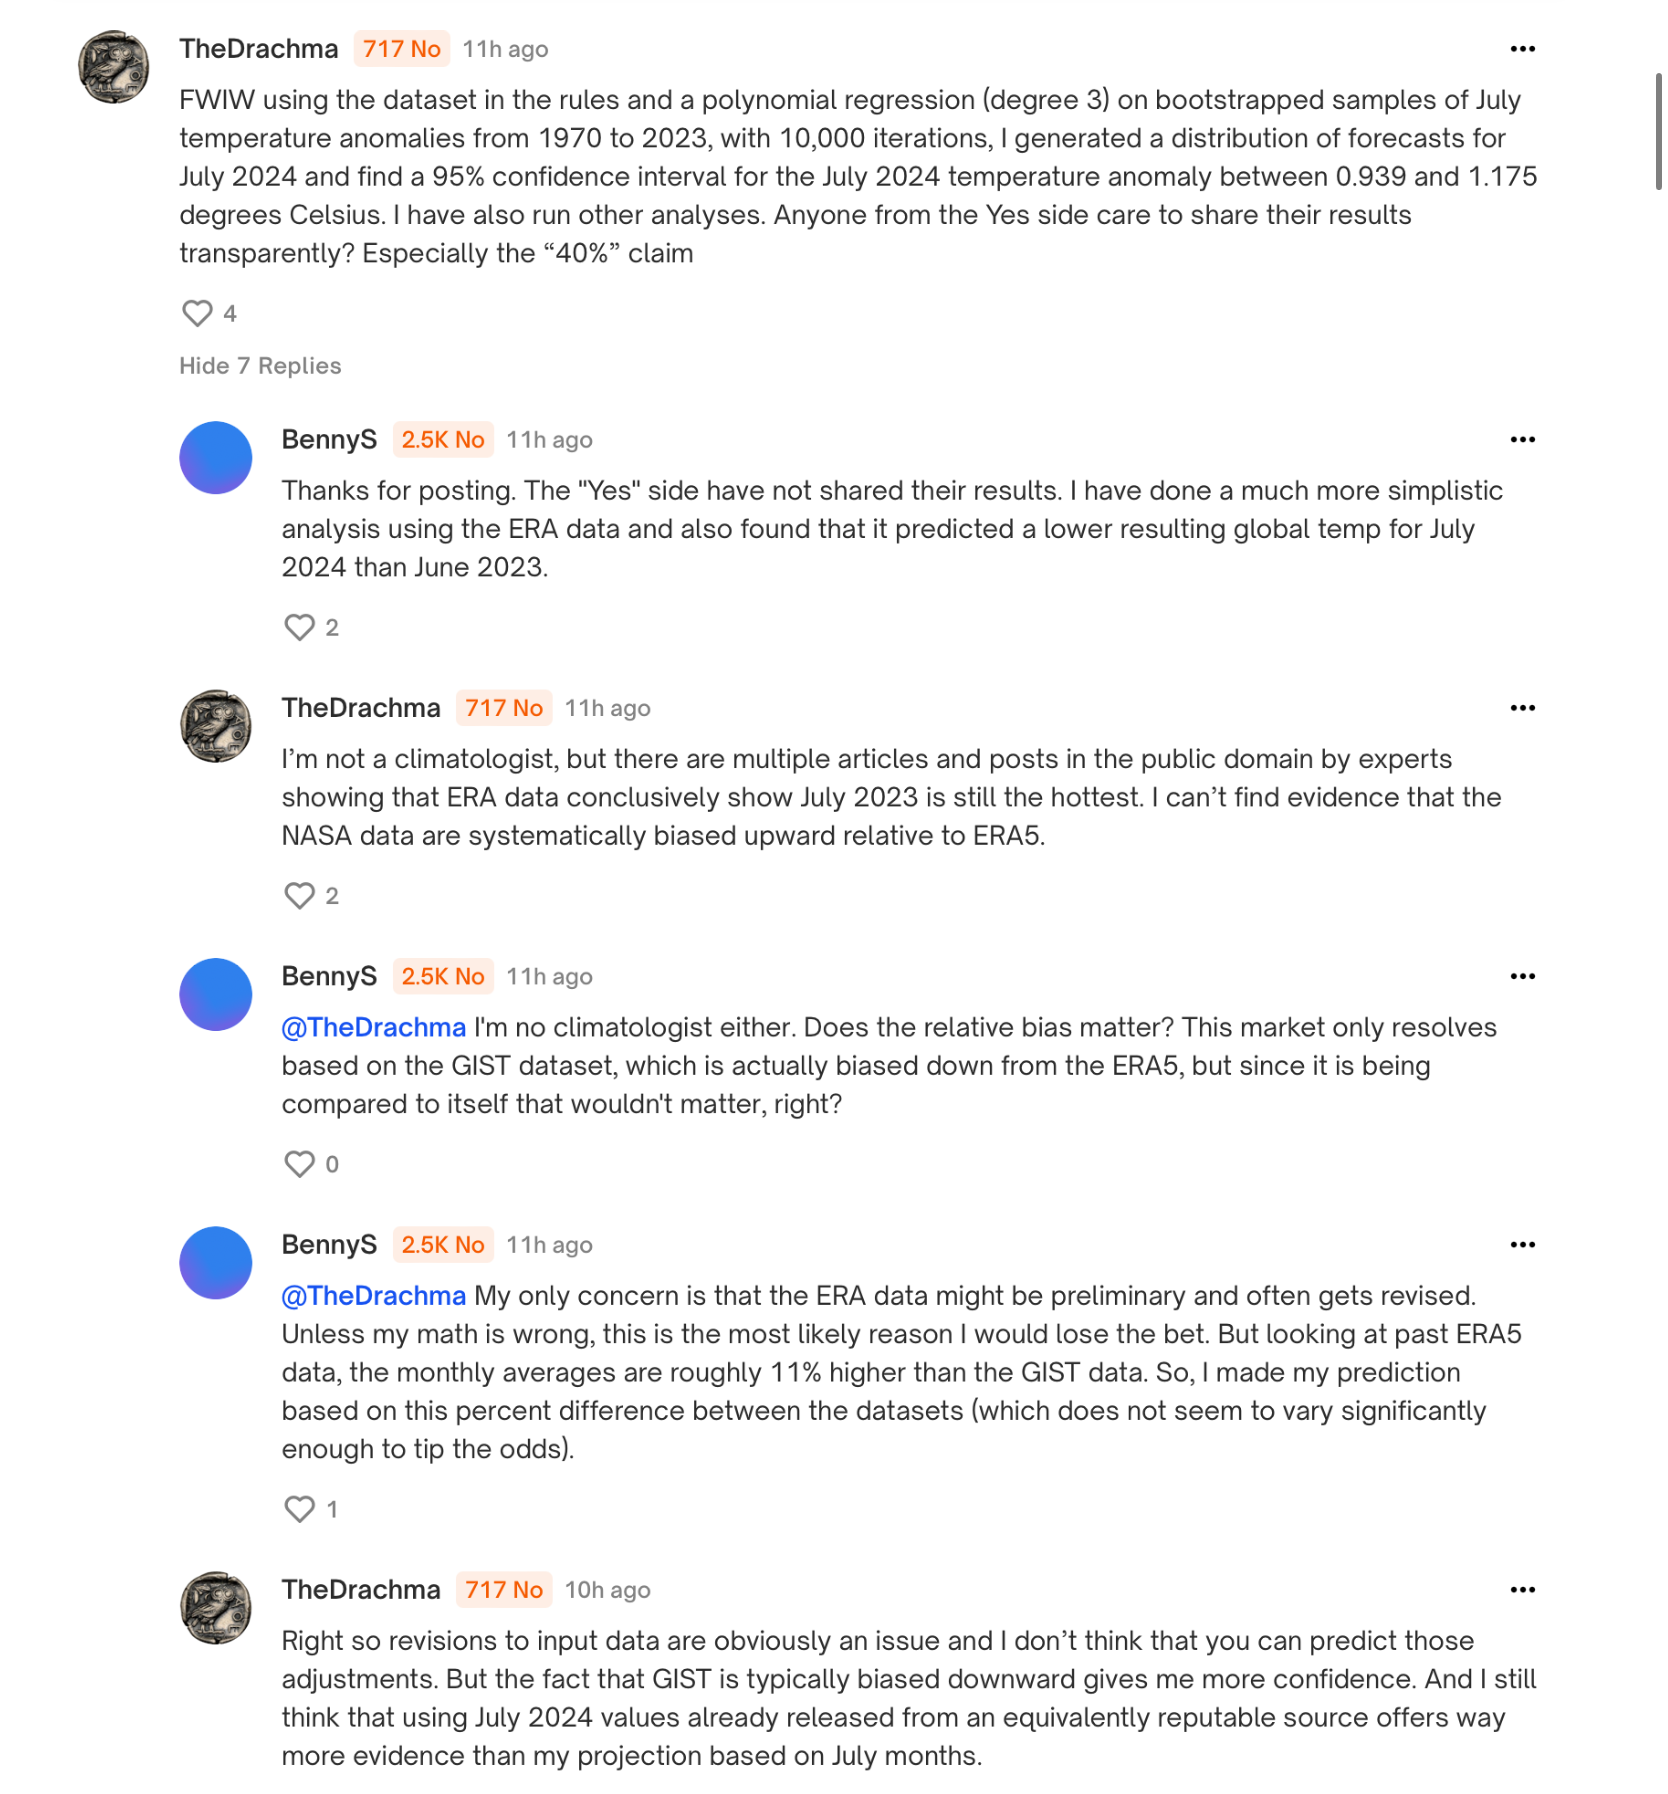
and funniest:

Edit ok it’s working?
Arb gap opened up again to 32% vs 62% here
https://manifold.markets/PaperBoy/will-july-2024-be-the-hottest-july-ad906e6a31df
is a different record NASA vs NOAA
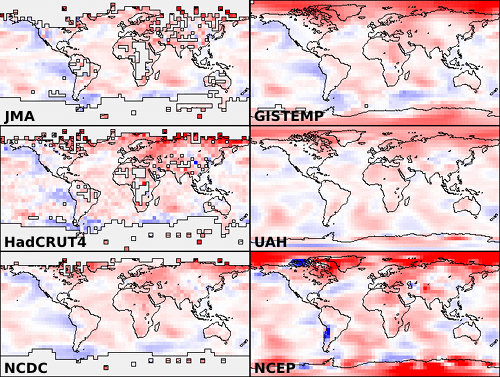
I haven't done the analysis but I've always looked at the NCEP charts and they were always close to GISTEMP. Also, they interpolate even more aggressively than GISTEMP (so I would expect JMA to be lower than the rest of the models during July).
https://www.giss.nasa.gov/research/features/201501_gistemp/
@aenews Why when you can buy at 20% at https://manifold.markets/PaperBoy/will-july-2024-be-the-hottest-july-ad906e6a31df
Anyone else want to share their point predictions/CI's? I'm curious to know what else everyone got, also percentages/CIs now that the last day of era5/Pulse data is in.
GIS TEMP anomaly projection (July 2024) (corrected, assuming -0.056 error, (absolute_corrected_era5: 16.851)):
  1.187 C +-0.065
From this I get a probability of 43% of > 1.195 C; with a wide 1-sigma interval of (14%, 80%).
Maybe most other people are just looking at https://climatereanalyzer.org/clim/t2_daily/?dm_id=world
and other sources like https://x.com/hausfath/status/1819045890251968731
"July 2024 came in slightly below 2023, ending a 13-month streak of record-setting months. But global temps remain far above any year prior to 2023, and 2024 is still on track to be the warmest year on record. For details, see my latest at Climate Brink:"
and don't go as far as calculating CIs?
"With 30 of the 31 days now available from the Copernicus/ECMWF ERA5 reanalysis dataset, we can say with certainty that July 2024 ended up with cooler monthly global temperatures than July 2023, by a small margin (~0.05C):"
Different dataset could have .1C difference but it is unlikely
Polymarket https://polymarket.com/event/2024-july-hottest-on-record?tid=1722769014047
has 45% chance of record (can sell at .44). That seems high to me given above info. So is there some reason to think it is more likely with gistemp than with ERA5?
I didn't know there was a polymarket ... I'll read the comments later in it when I have more time...
"So is there some reason to think it is more likely with gistemp than with ERA5?"
I'd rather say, given the ERA5 temps, the variation I expect in the gistemp LOTI is large enough (within the margin of error) to say that such a probability is not unreasonable.
That quote though about small margin... the number roughly agrees with my margin (0.05 is close to my 1 sigma of 0.06) but the problem is then what do you get for the final anomaly temp? If its 1.19, then 0.05 might not be 'small' any more...
Fixed a bug showing the wrong uppers for 1 sigma charts (showed 2sigma uppers by typo) 😦 Hoping that;s the last of the bugs; this one didn't affect any of my past bets.
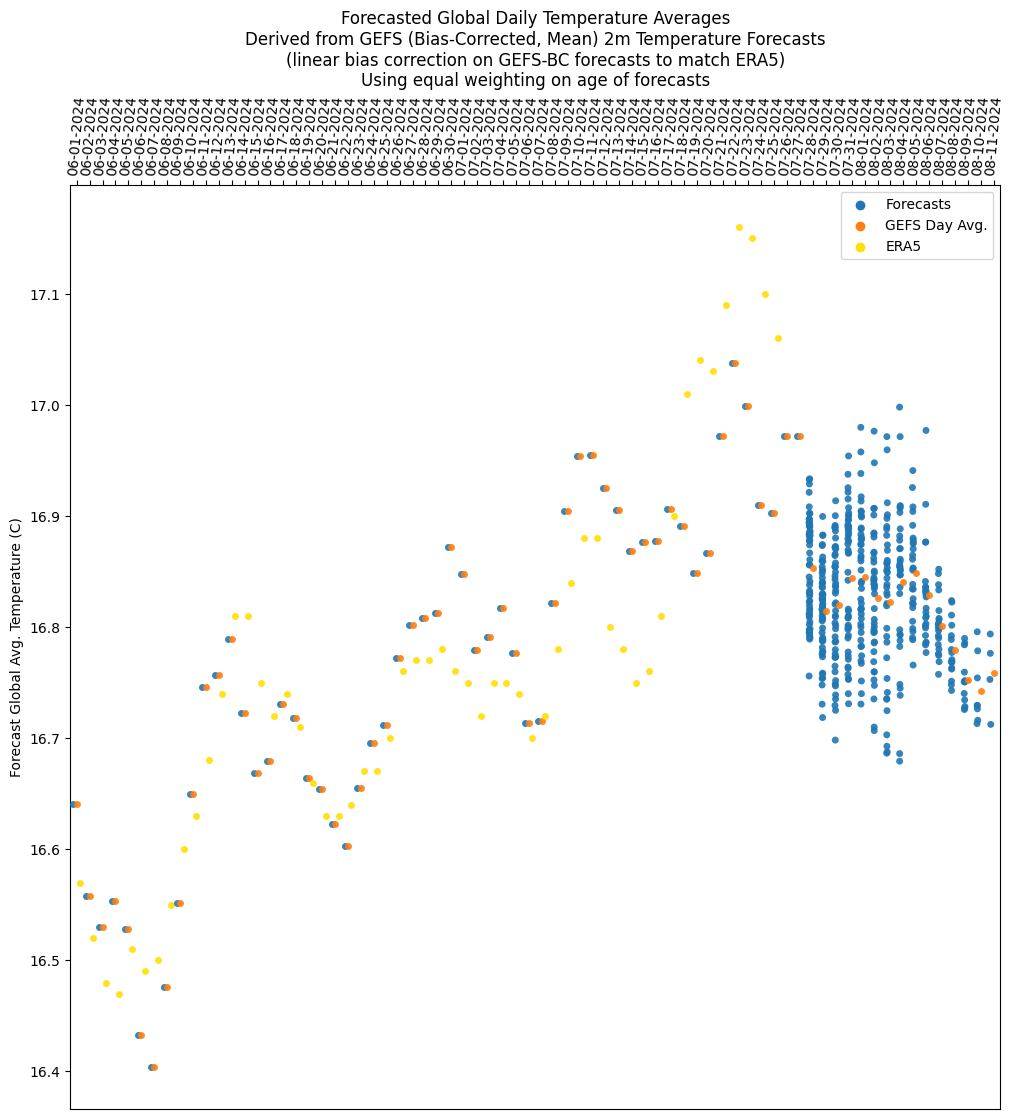
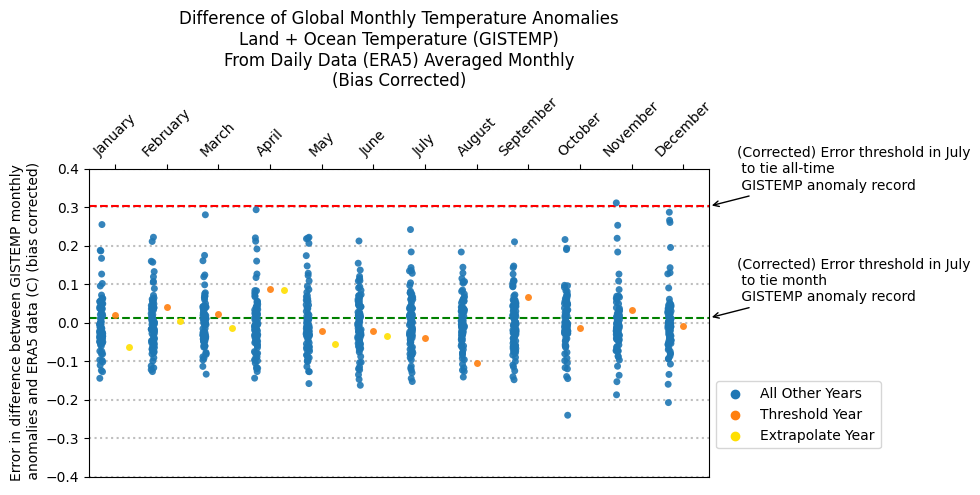
Pretty much agree with (the mean probability) everything except the monthly record.. like the other market I think > 1.195 is undervalued but I've already spent a 1000 mana betting it up.... This is based on the linear regression that the prediction error was moderate for last year (gistemp cooler than era5 suggests last year, but importantly, still within 1 sigma) and that possibly this year will be even have a slight positive error (a yellow dot above the green line):

With no offset for remaining couple days:
GIS TEMP anomaly projection (July 2024) (corrected, assuming -0.056 error, (absolute_corrected_era5: 16.847)):
  1.183 C +-0.065
The error to tie 1.195 is then only 0.012 C.
This gives a mean probability of ~ 42%, but with a wide 1 sigma CI of (11%, 79%)
The 1sigma spreads I get:
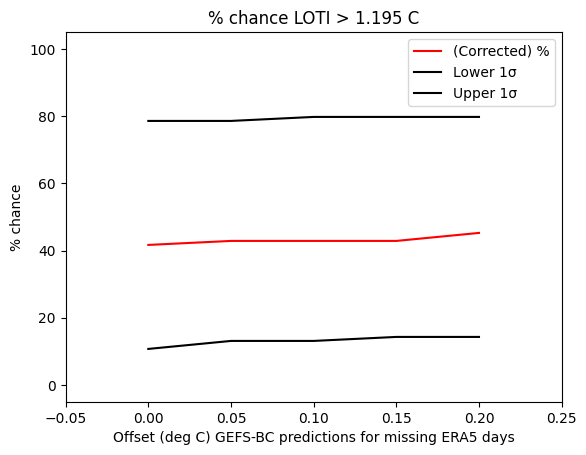
Alternatively in the past I've used a cutoff for the data to help debias the datasets to some degree... To achieve something similar, today I analyzed (for each month) the correlation between the gistemp prediction error I get (the difference between the predicted ERA5 anomaly temp (going from ERA5 daily averages to month averages) and the actual gistemp anomaly (this already offset by any monthly average bias present between the datasets)) and the absolute temperature (ERA5 month average) as I expected higher temperatures to be negatively correlated, and they were significant for most months (but not all). I then did a linear regression (between the error and the absolute temp for each month), (residuals looked ok I suppose), and further cross validation to get a RMSE for the error for each month. This I use to hope to reduce the predicted gistemp error (it decreases the anomaly by -0.054 C for the current month and temps with 0 C offset (-0.062 for 1.0C offset )...
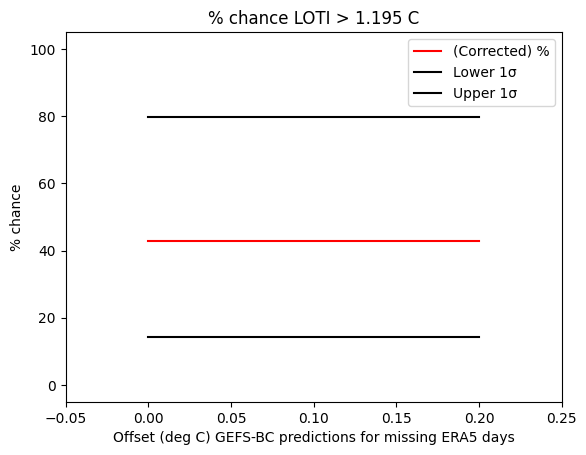
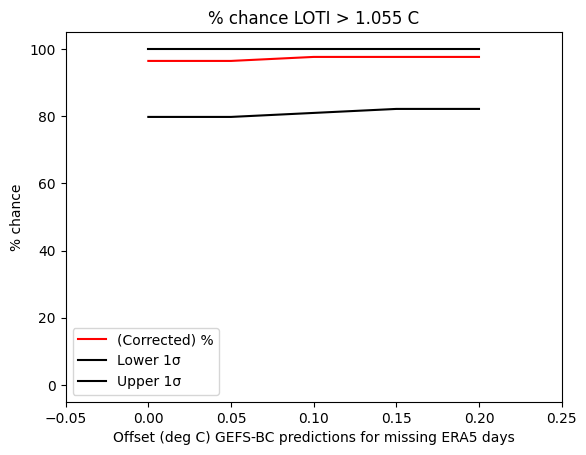
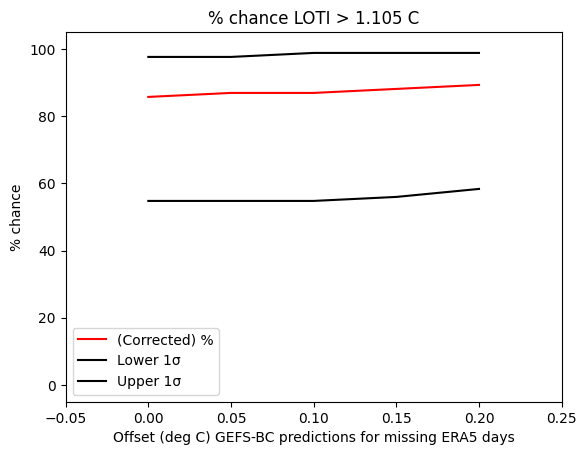
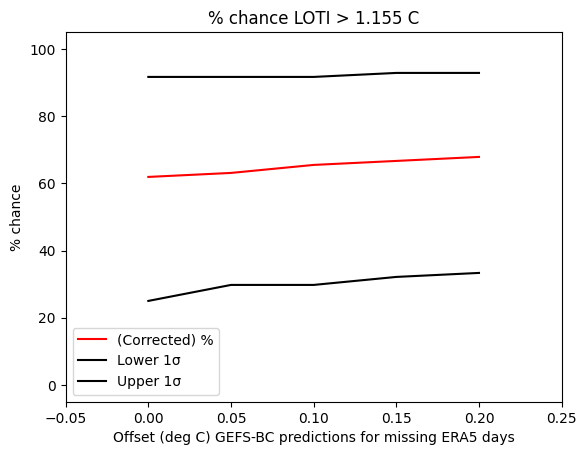
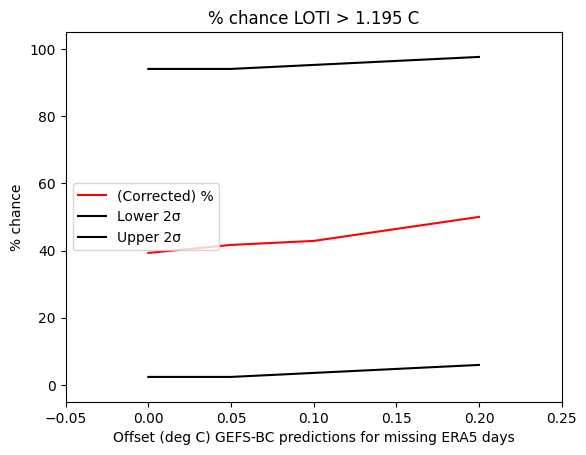
Finally, I produced 1 sigma, 2sigma charts for these exceedance percentages as usual based on different offsets for the GEFS data I have made (the days no pulse data is present).
Right now it continues to look like the offset of the higher end is more likely (0.1C offset looks more likely than 0.0C offset given the mean predictions look like they might end up on the low end from the recent temps). The wide CI confirms what I believed previously: I should have low confidence in getting an accurate prediction based on the uncertainty in the remaining days temps:
Edit: [ deleted ] (wrong upper)
2 sigma chart (> 1.195 C):
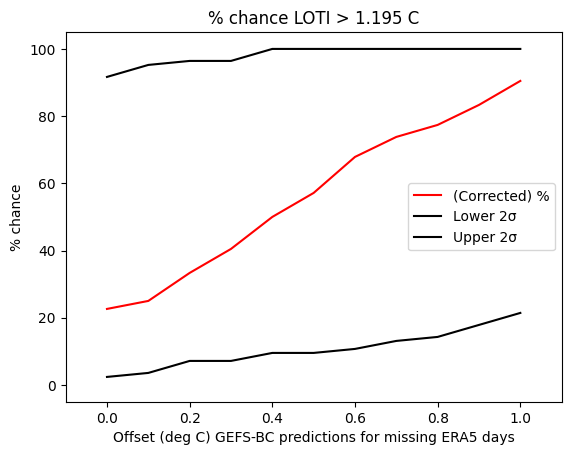
Edit: (fix legend)
I don't know why but I was definitely hallucinating that those offsets above 0.3 were reasonable... (I think I was mixing up 0.06 with 0.6 while looking at the y-axis 😭 ). 0.1 seems a reasonable offset, which means its more likely this month will NOT break the month's record (as one would expect from just looking at the ERA5 data), but the CI is still large.
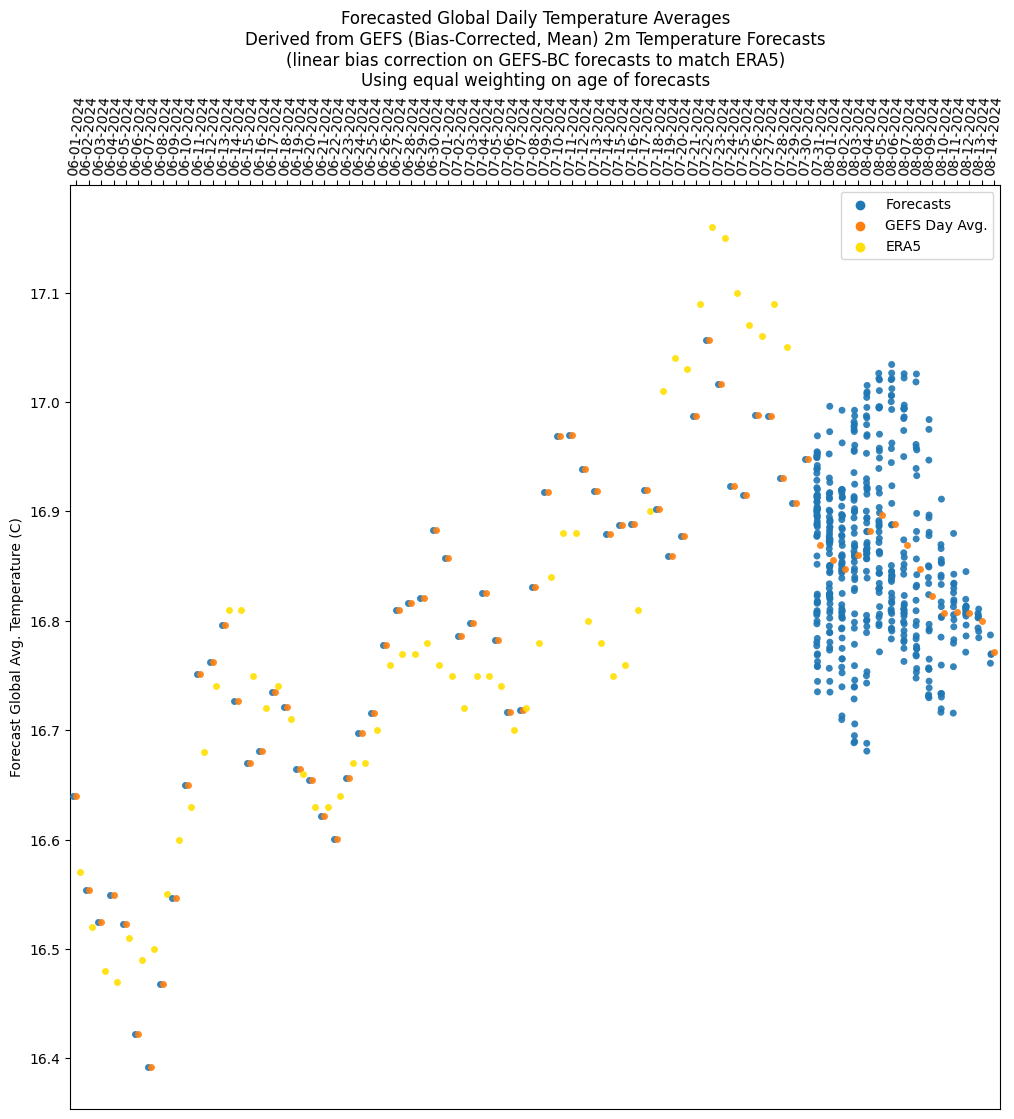
I finally noticed it today after working more on adjusting the ERA5 data more according to the same bias I use for the prediction error... this results in a slightly tighter chart for recent years errors, although the spread doesn't appear to change much for older years ... (i.e., the error for July from last year looks less outstanding; but, August is one of the months that doesn't fit the tight per month correction model, so correcting on a yearly basis results in almost no correction).
For GEFS offsets between 0 and +0.2 of predictions for days in July with no pulse/copernicus data, these result in predictions more in line with the markets although suggesting they are still under-valuing the probability of breaking the record (estimated mean of 45% based on the offsets):
[39.28571429 41.66666667 42.85714286 46.42857143 50. ]Edit: [deleted 1 sigma chart - wrong upper]
The margin of error still dominates:
On the low end with no offset:
1.178 C +-0.065
With +0.1 offset:
1.187 C +-0.065
With +0.2 offset (which is still feasible but less likely):
1.196 C +-0.065