
Data is currently at
https://data.giss.nasa.gov/gistemp/tabledata_v4/GLB.Ts+dSST.csv
or
https://data.giss.nasa.gov/gistemp/tabledata_v4/GLB.Ts+dSST.txt
(or such updated location for this Gistemp v4 LOTI data)
January 2024 might show as 124 in hundredths of a degree C, this is +1.24C above the 1951-1980 base period. If it shows as 1.22 then it is in degrees i.e. 1.22C. Same logic/interpretation as this will be applied.
If the version or base period changes then I will consult with traders over what is best way for any such change to have least effect on betting positions or consider N/A if it is unclear what the sensible least effect resolution should be.
Numbers expected to be displayed to hundredth of a degree. The extra digit used here is to ensure understanding that +1.20C resolves to an exceed 1.195C option.
Resolves per first update seen by me or posted as long, as there is no reason to think data shown is in error. If there is reason to think there may be an error then resolution will be delayed at least 24 hours. Minor later update should not cause a need to re-resolve.
 1,000
1,000🏅 Top traders
| # | Trader | Total profit |
|---|---|---|
| 1 | Ṁ515 | |
| 2 | Ṁ204 | |
| 3 | Ṁ140 | |
| 4 | Ṁ63 | |
| 5 | Ṁ19 |
People are also trading
Below will likely change by Friday since the early ghcnm data fluctuates quite a bit. NCEI's webpage has warned of a planned maintenance from Feb 4th to 6th (that might affect ghcnm releases) so we may not get an update on those days...
(I'll post with two decimals even though its officially rounded):
(ghcnm.v4.0.1.20250202)
135.51
Thread also has a couple other interesting posts:
@parhizj Do I understand correctly that GHCNm is only land air temp data? And there is also sea surface temperature from other sources in Gistemp formula, right? So the Gistemp likely to be little bit cooler than GHCNm?
@aenews thank you! Is there any online source where I can look for the ghcn/ersst data in simple (global average) form (like JRP posted above: ghcnm.v4.0.1.20250203 135.34)?
Сan't figure it out on the official pages.
@GG23 That is the temp from gistemp LOTI which combines the two datasets after some processing. As far as I know beyond the gistemp official source (https://data.giss.nasa.gov/gistemp/) which does provide land and ocean index temperatures separately (which may be what you want) there is no source, but the data for the month in question is only provided once the report comes out (which is the whole point of this market) — you can get the previous months though from it.
Remember ghcnm isn’t gridded data like ersst5 so there is nothing like a global average that can be simply derived from the dataset.. there is a gridded version ghcnm produced (https://psl.noaa.gov/data/gridded/data.ghcncams.html) but it lags behind ghcnm (January isn’t available for instance)
@parhizj thank you! But I can't understand from what source you get the following data:
ghcnm.v4.0.1.20250203
135.34
@GG23 https://www.ncei.noaa.gov/pub/data/ghcn/v4/
See https://data.giss.nasa.gov/gistemp/sources_v4/gistemp.html
The actual 135.34 is from running gistemp (slightly modified to not round in output).
the gistemp website provides source code for gistemp as well as other tools for getting the ersst5 processed into the sbbx format. I updated gistemp to run on modern python but I haven't been able to get the ersst5 sbbx tool (that they provided the source code last year) to work ; some time ago I wrote my own tool to generate it... these are at my gistemp repo: https://github.com/JRPdata/gistemp4.0 ; its very unofficial though.
@ScottSupak likely will be hottest per GISTEMP (much more confidently than NCEI,ERA5 dataset questions which I put both as a point estimate in the neighborhood of maybe 65-70%).
Comparison of polymarket bins to my model

Polymarket's 95% seems a tad overconfident in comparison to my model, likely because they are seeing point estimates for the temperature roughly ~0.1C above last year's temp (1.25):
GIS TEMP anomaly projection (January 2024) (corrected, assuming -0.066 error, (absolute_corrected_era5: 13.150)):
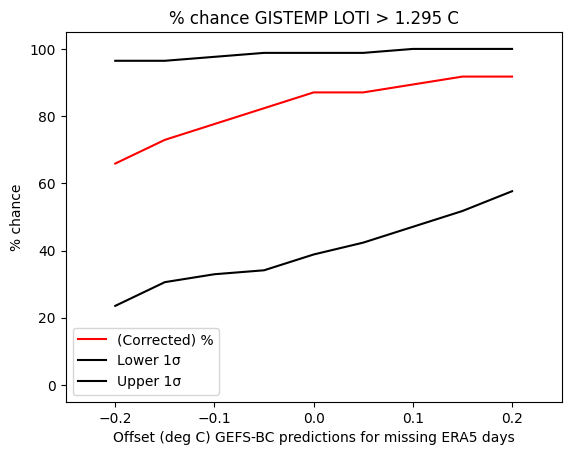
1.359 C +-0.077The point estimate I have for above is around 87% of being > 1.255 from the model I use, but using the Z-score from that CI puts it not breaking the record at ~ 1.35 std.deviations away (9%), corresponding to 91% chance of it breaking the record. Enough variation in remaining days to shift the middle point +-0.015 C (+- 0.1 C offset for remaining days).
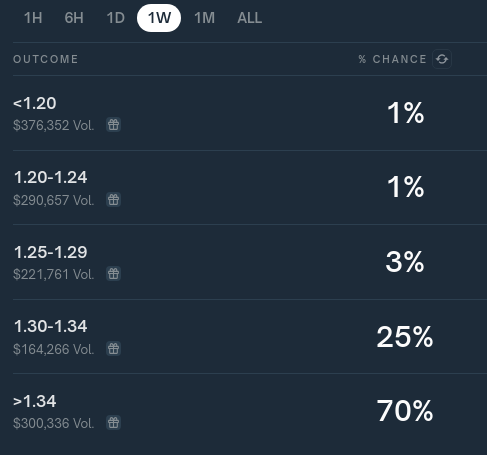
This questions bin for reference:

@LeonardoParaiso you do a ERA5 daily temps -> GISTEMP month model:
say the ERA5 temp for this month will be 13.221 C (use GEFS or ERA5 or some other model to extrapolate rest of month). Calculate the average temps for January for ERA5 then calculate the same for GISTEMP LOTI; the difference will give you a rough estimate of how much to offset the 13.221 C. You can be more sophisticated and add error correction terms (like the more warm ERA5 temps the more we should reduce the temp as this is a proxy for the bias of GISTEMP which fixes the ice free area so it tends to underestimate the ERA5 temps in the current modern, warmer climate) in which case for a simple linear model for January I get an adjustment of -0.068 C bringing the ERA5 temp down to 13.153 C. This produces then a GISTEMP temp of 1.361 C for my model.
This is > 0.1C the January 2023 temp of 1.24. I recall the January 2024 temp itself is probably on the border of almost reaching 1.25 i.e. ~1.244 from the recent gistemp run I have done) so this puts it at around 1.361 - 1.244 = 0.117 C higher:
GIS TEMP anomaly projection (January 2024) (corrected, assuming -0.068 error, (absolute_corrected_era5: 13.153)):
1.361 C +-0.074@parhizj Why do you still have positions between 1.19 and 1.30 if your gistemp runs go so high? Also, you dont take into account any of the ERA5 SSTS? Can you elaborate on why?
@LeonardoParaiso That is (roughly) the probabilities I get for it.

I only use the ERA5 global temps for this model (https://sites.ecmwf.int/data/climatepulse/data/series/era5_daily_series_2t_global.csv) as this is just simpler. If I wanted to try to go for the best accuracy I would redo all the ERA5 global 2m temp averages myself trying to regrid them according to the (ice-free) subboxes present in the gistemp baseline (this takes way too time and is a waste of compute for these predictions).
As for using the ERA5 SSTS I don't know how I could effectively use them (are you thinking of combining the ERA5 land temps and the SSTs separately and trying to infill like GISTEMP? You still would need to redo all the years to get a model to match to GISTEMP, and this seems much more complicated and I don't know how much benefit there would be.) Otherwise, more speculatively you could try to refine the error terms for SST instead of using a simple linear correction model? (again I don't know how much benefit there would be). In all there is not much motivation to refine the model I have given the uncertainty already present in the data itself (gistemp itself has an uncertainty of ~0.05C already).
@parhizj I see what you mean now. I just don't understand that, by now, knowing the that GISTEMP will be around 1.36C with the uncertainty of ~0.5C how can you put the odds of much lower than that so high? Like the interval of 1.15-1.29. Are you counting on La Niña adjustments or SST adjusments like i said?
@LeonardoParaiso No I'm not using La Nina, SST adjustments like I said.
My uncertainty isn't 0.5C, the CI estimate I have for the last step in the model is ~0.07 C, 1.36 - 0.07 = 1.29C.
The point estimates for the bins I calculate as an exceedance statistic using the errors in the model, i.e. for the month in question calculate how much error there would need to be to tie the exceedance temp and then count how many months historically have an error exceeding this. For example, say January is 1.36 C and the exceedance temp is 1.305, the error threshold it cannot exceed to still fit into the bin is then -0.055 (actual - predicted >= -0.055); from the ERA5 model and the GISTEMP model we have can calculate (an adjusted) predicted and actual temps, the difference is the error for each month, then we just count how many months out of total for January have an error >= -0.055 to get the exceedance statistic. We can then subtract the exceedance bins start range values from starting from the low end of the range subsequently to get each bin's contribution (i.e. 1 - statistic for > 1.145 gives the first bin, repeat for the complement of this value - next bin's statistic, etc.)
@parhizj I see what you mean but GISTEMP is pretty much always higher than ERA5 in january, as far as i know. Thanks for the tips!