Data is currently at
https://data.giss.nasa.gov/gistemp/tabledata_v4/GLB.Ts+dSST.csv
or
https://data.giss.nasa.gov/gistemp/tabledata_v4/GLB.Ts+dSST.txt
(or such updated location for this Gistemp v4 LOTI data)
January 2024 might show as 124 in hundredths of a degree C, this is +1.24C above the 1951-1980 base period. If it shows as 1.22 then it is in degrees i.e. 1.22C. Same logic/interpretation as this will be applied.
If the version or base period changes then I will consult with traders over what is best way for any such change to have least effect on betting positions or consider N/A if it is unclear what the sensible least effect resolution should be.
Numbers expected to be displayed to hundredth of a degree. The extra digit used here is to ensure understanding that +1.20C resolves to an exceed 1.195C option.
Resolves per first update seen by me or posted as long, as there is no reason to think data shown is significantly in error. If there is reason to think there may be an error then resolution will be delayed at least 24 hours. Minor later update should not cause a need to re-resolve.
 1,000
1,000🏅 Top traders
| # | Trader | Total profit |
|---|---|---|
| 1 | Ṁ1,087 | |
| 2 | Ṁ74 | |
| 3 | Ṁ0 |
People are also trading
1.08
@ChristopherRandles , this can resolve now.
For reference, based on the /pub/gistemp directory they used the ghcnm revision from Sunday night so they did the run monday morning most likely...
ghcnm.tavg.v4.0.1.20260208.qcf.datghcnm.v4.0.1.20260206:
107.55
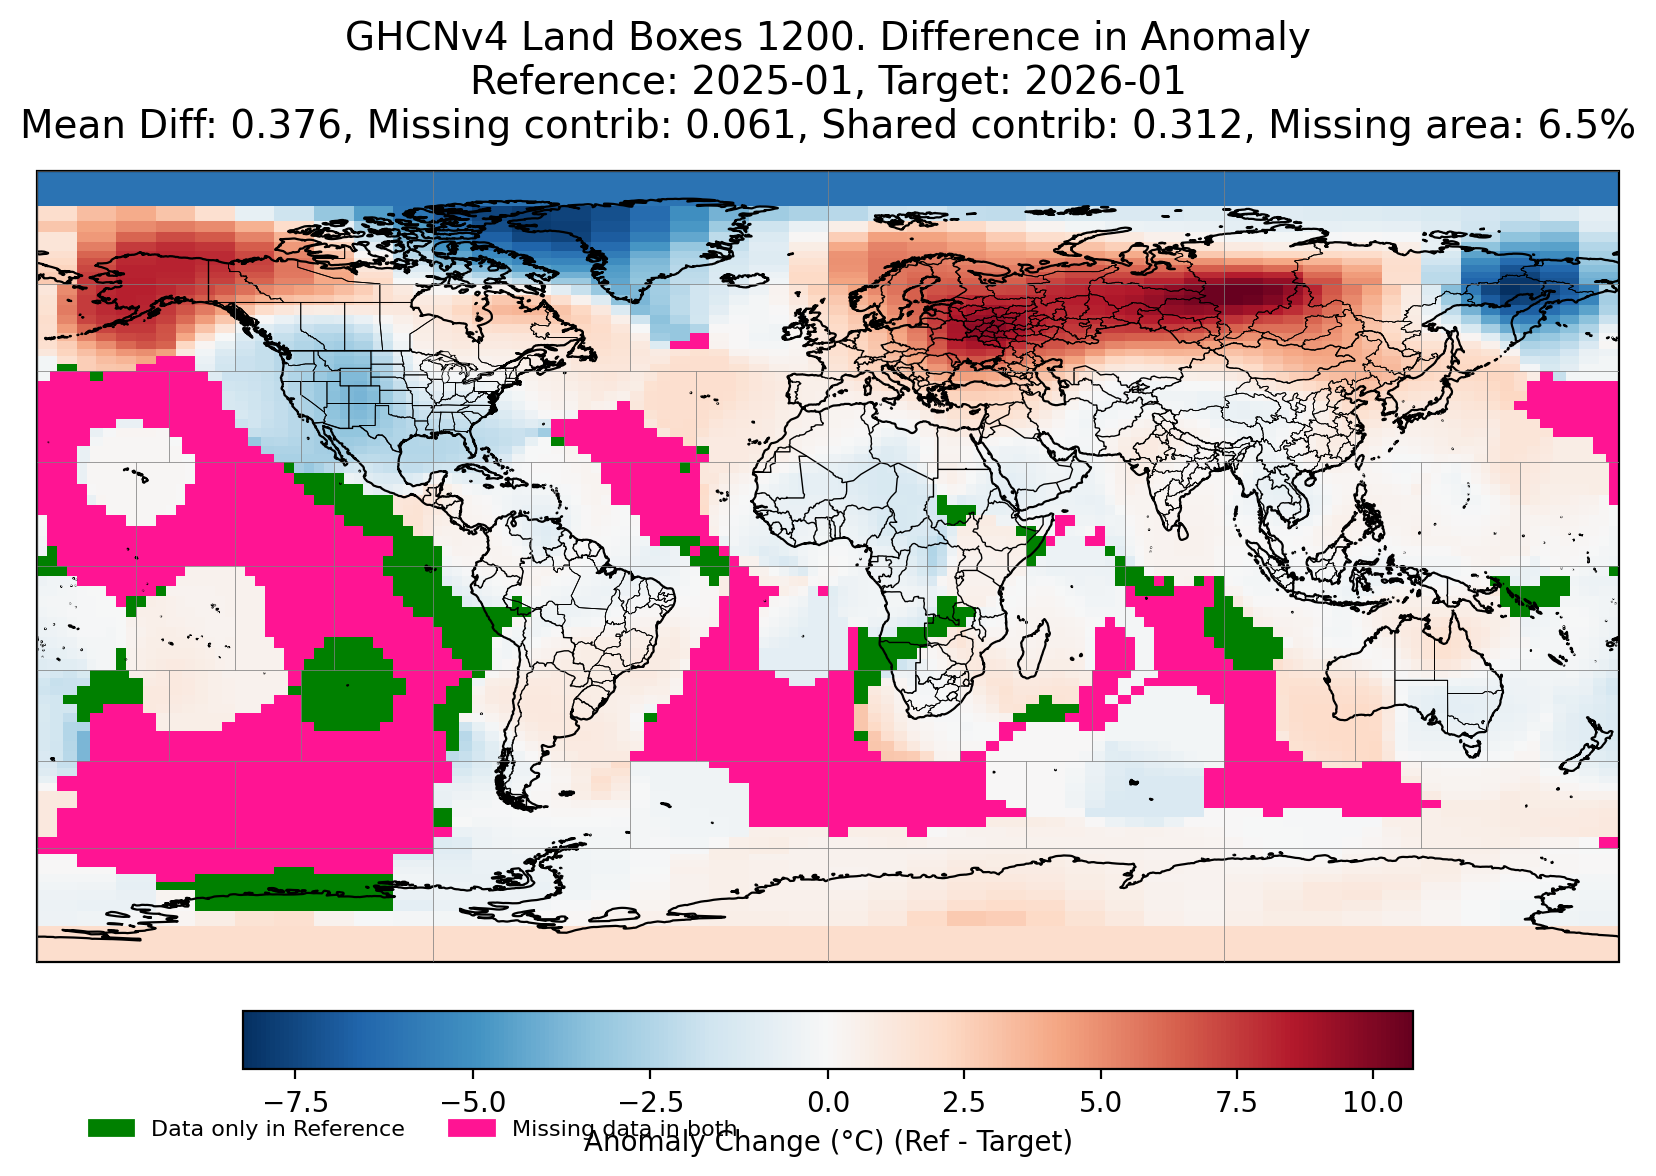
Overall it's some what difficult to see now how we could get an increase of 0.02C given the coverage (see below), but I think at least a 0.01C increase is very feasible. I believe with revisions to the homogenization for existing subboxes with greater station density together with some biasing due to certain areas we could see a 0.02C increase but I'm not willing to be as confident as polymarket which is at 88% since I've seen such large shifts with increasing stations (for reference we should get something like 1300-1400 more stations in the next 2-3 days if the usual pattern has held).
~
It took me a while to go over today's results because I was skeptical of the good coverage % given the number of stations, and more importantly some other experimental code I've been testing had a diagnostic that happened to show thousands of less stations historically in the dataset with the recent couple ghcnm runs compared to the Jan 2 ghcnm, but I'm not sure if that is significant as its hard to interpret if it effects this month's preliminary results (edit: I compared the actual gistemp values between the past runs and there is no significant difference historically so I think it may just be a bug in the new program's experimental diagnostics).
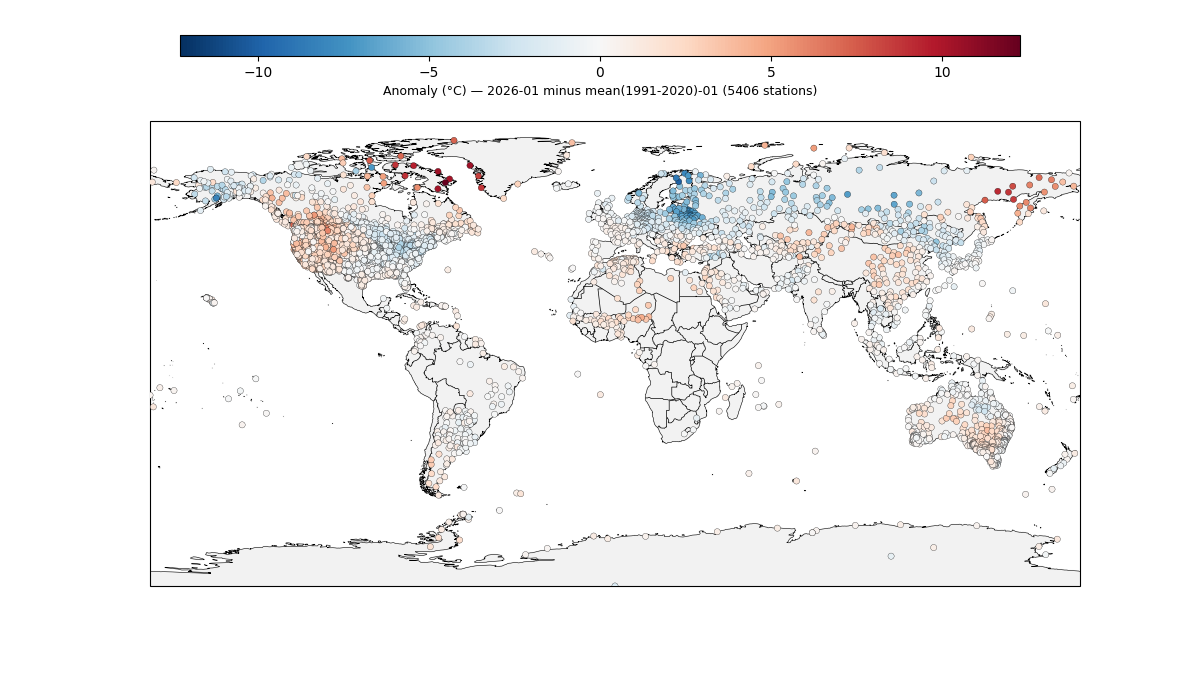
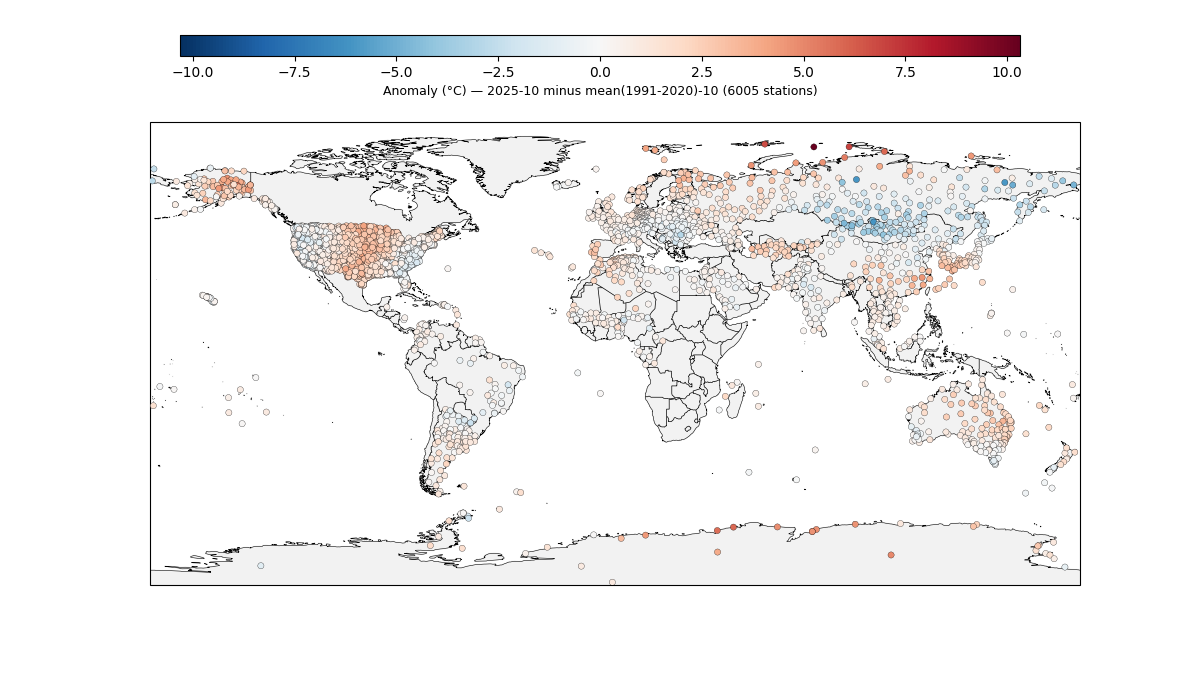
Some notable infilled subboxes that are could cause increases if they come in are are Svalbard and Jan Mayen (I don't recall for sure if they both came in last month on time but I think they did come in for November). There are also some unknowns like Mexico, parts of South Africa, Easter Island, Papa New Guinea, Bolivia and Peru; it's not clear how well they are infilled. West Antarctica is also an unknown since it is missing and I didn't check whether it was particularly warm this year or not relative to 2024...
(remember for the below blue means this year was hot relative to 2024):
Based on some very preliminary experimental model I'm working on still for the preliminary GHCNm data it still looks like a roughly 60/40 split or a 55/45 split (if you assume a normal distribution) is fair at the moment...
Adjusting based largely on the bias between ERA5 and GHCNm/ERSSTv5 with primary subboxes (i.e. taking stations greatest weights for a subbox and weighting each subbox with station data while interpolating ERA5 to the same covered (primary) land subboxes this results in obtaining a land bias, similarly moving ERSSTv5 and ERA5 to subboxes and calculating the relative bias for the ocean component): the best features however found so far as ocean bias and global bias (land bias turns out isn't well correlated in this approach but ocean and global bias is!), and then using this to refine an initial prediction, this results in a new center point adjusted downward from 1.11 to 1.09:
Forecast: 1.0915 ± 0.0225
I don't have much faith in the new CI since I haven't finished getting enough samples of historical bias data, but this is more objective and seems reasonable given my subjective estimates. The polymarket value of 88% still looks overconfident...
Edit: After computing more historical bias data now I have enough samples to say the above analysis was too preliminary and I did not enough samples ( the correlation dropped to 0.3 and the stddev improvement only ended up now being 6% ).... This second stage bias's adjustment is now a mere -0.009, putting it near 1.10 now with today's ghcnm data (1.1028 ± 0.0367). This seems less plausible for the moment but it is based on the expectation of the value after much more data comes in (beyond the current month when we might get the full data set).
@Rhhgdd I have it dated to the ghcm for dec5 that it came in at least for november early... (date is when I created it)
/mnt/xfs/d/ghcnm/ghcnm-nov-dec06.png
also for October data it came in early also:
/mnt/xfs/d/ghcnm/ghcnm-oct-nov6-1991clim.png
@parhizj based on updated coverage im leaning towards 1.09, if the trend followed last month's ghcnm data availability we would probably see something like 1.03-1.06-1.13-1.12 and 1.10(upon release) and settling in the 1.08-1.09 area towards the end of the month e. but because we have so many more stations we are reaching that end of month figure a lot sooner than expected.
anyway, it just means that my predictions will get a lot more accurate from this point onwards gives ghcnm coverage just keeps getting better
ghcnm.v4.0.1.20260207:
107.54
Only ~40 more stations ( Mexico and Europe)

:
No changes to GISTEMP station data despite new ghcnm release (exact same value as yesterday).
~
I went back through old markets to look at the posts but I didn't always keep good enough records of when what day data they released it. 2/7 times they did the run the day before (i.e. used a ghcnm date 2 days less than the release date) and 5/7 times two days before.
Given we have decent coverage but not great density seems like the probability should be at least 71% then they will use last night's ghcnm. However given that it still seems difficult for it to rise another 0.02 C for a possible ghcnm tonight that includes more data (including necessarily missing parts of the Arctic mentioned) that seems a bit too low, so I'm adding another small bet on top of that.
Same as yesterday -- no change despite a new revision. Given they'll likely use one of these two runs, the only uncertainty is whether they will delay release due to the lack of the total number of stations (~5400 or so) since it is less than even the other preliminary runs by perhaps a significant amount...
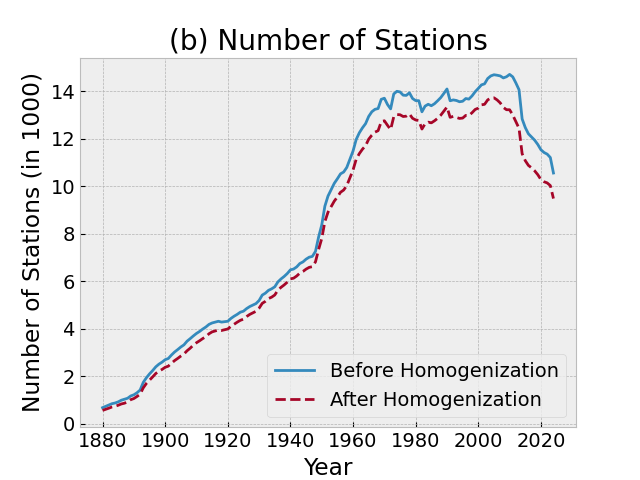
For reference, the past "preliminary" months' runs still had roughly 65%-70% or so of the # stations the year prior for their run (about a 1000+ or so more stations); this would drop it down to 55% or so...
Unlike the runs though from prior to the 1940s the coverage is good so I only give this scenario a very sketchy guess of at most 5-15% since we are in uncharted waters historically as far as number of stations.
Reading rec : https://mailchi.mp/caa/another-el-nino-already-what-can-we-learn-from-it
Good discussion in latest Hansen newsletter of El Niño, brief discussion of RONI (https://www.bom.gov.au/climate/enso/?ninoIndex=nino3.4&index=rnino34&period=weekly#overview-section=Monitoring-graphs is a good source for it)
Hansen provides some hedging material (based on climate priors) given the NCEP spread
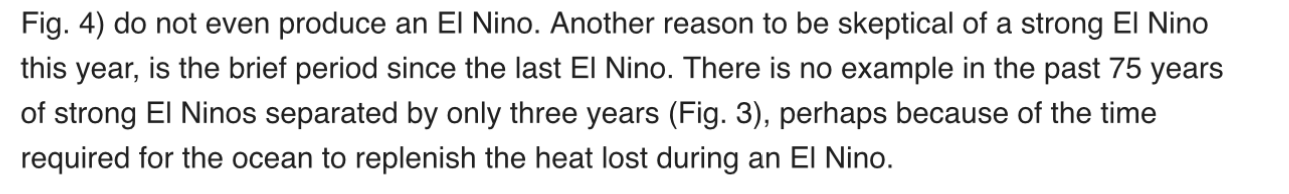
But despite the lower end spread in the NCEP runs for even a no El Niño scenario, the ECMWF plumes show greater likelihood in the Feb run than the Jan run, with a higher end and mean going into June and July (a good percentage of members showing a strong El Niño, indicating a moderate strong or strong El Niño is likely )
Re La Niña minimum.. it seems guaranteed we will not drop this year below the 1.4 C (12 month mean)….
More exceptional will be it looks like two back to back strong El Niño will happen based on the ECMWF El Niño plumes..
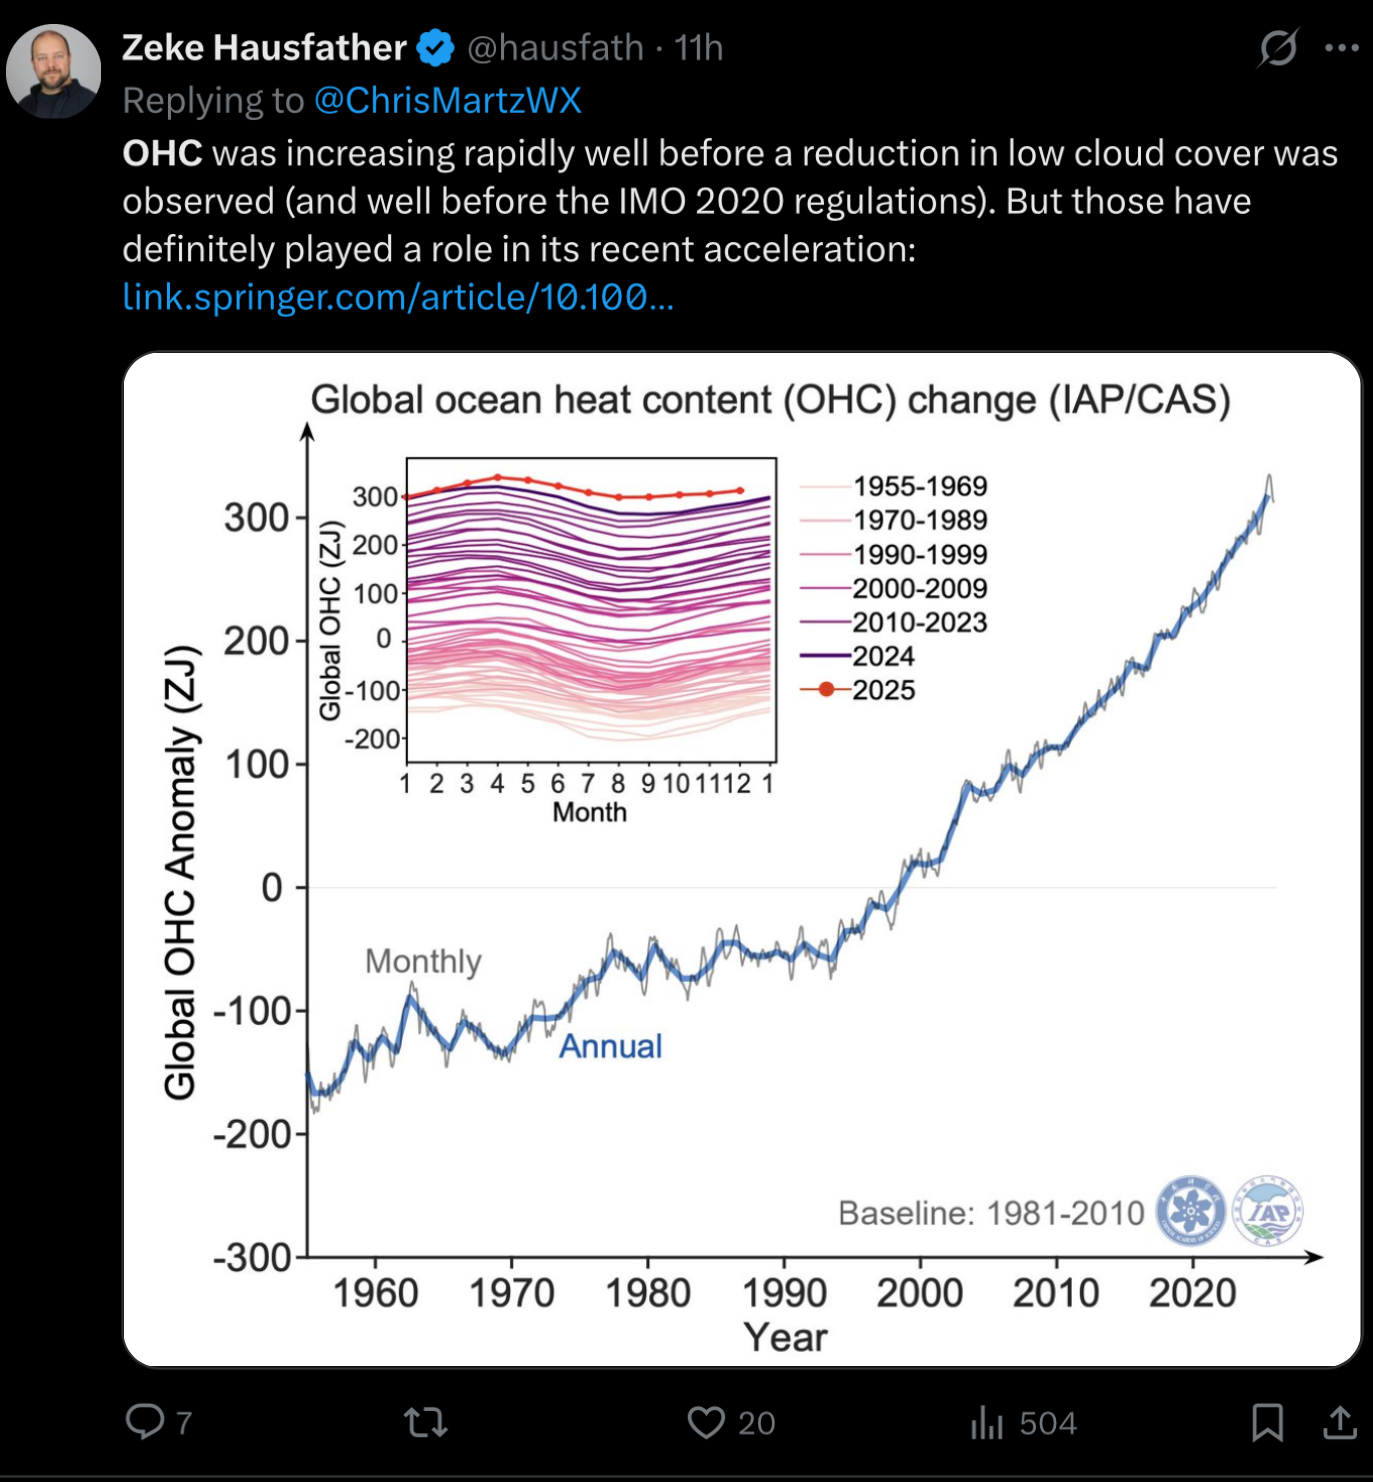
The OHC and anomalies are quite absurd…
Despite the how badly Hansen burns Zeke for his error bars, Zeke has put a lot of emphasis on it lately in his posts and in turn we see Hansen focusing on it this newsletter…
Edit Feb 5: first revision of ghcnm did come late (see lower comment)... so what I said at the bottom no longer looks likely...
While the ERSSTv5 data became available yesterday we still have no GHCNm data for 2026... (technically we have been seeing ghcnm revision updates but no 2026 data)
Not 100% clear to me if this is from the new notice (regarding ngdc) as it doesn't seem to have anything to do with the ASOS and GCHN data... (I note that the search interface for the GCHNh data reveals even a lot of the US data is far behind.)
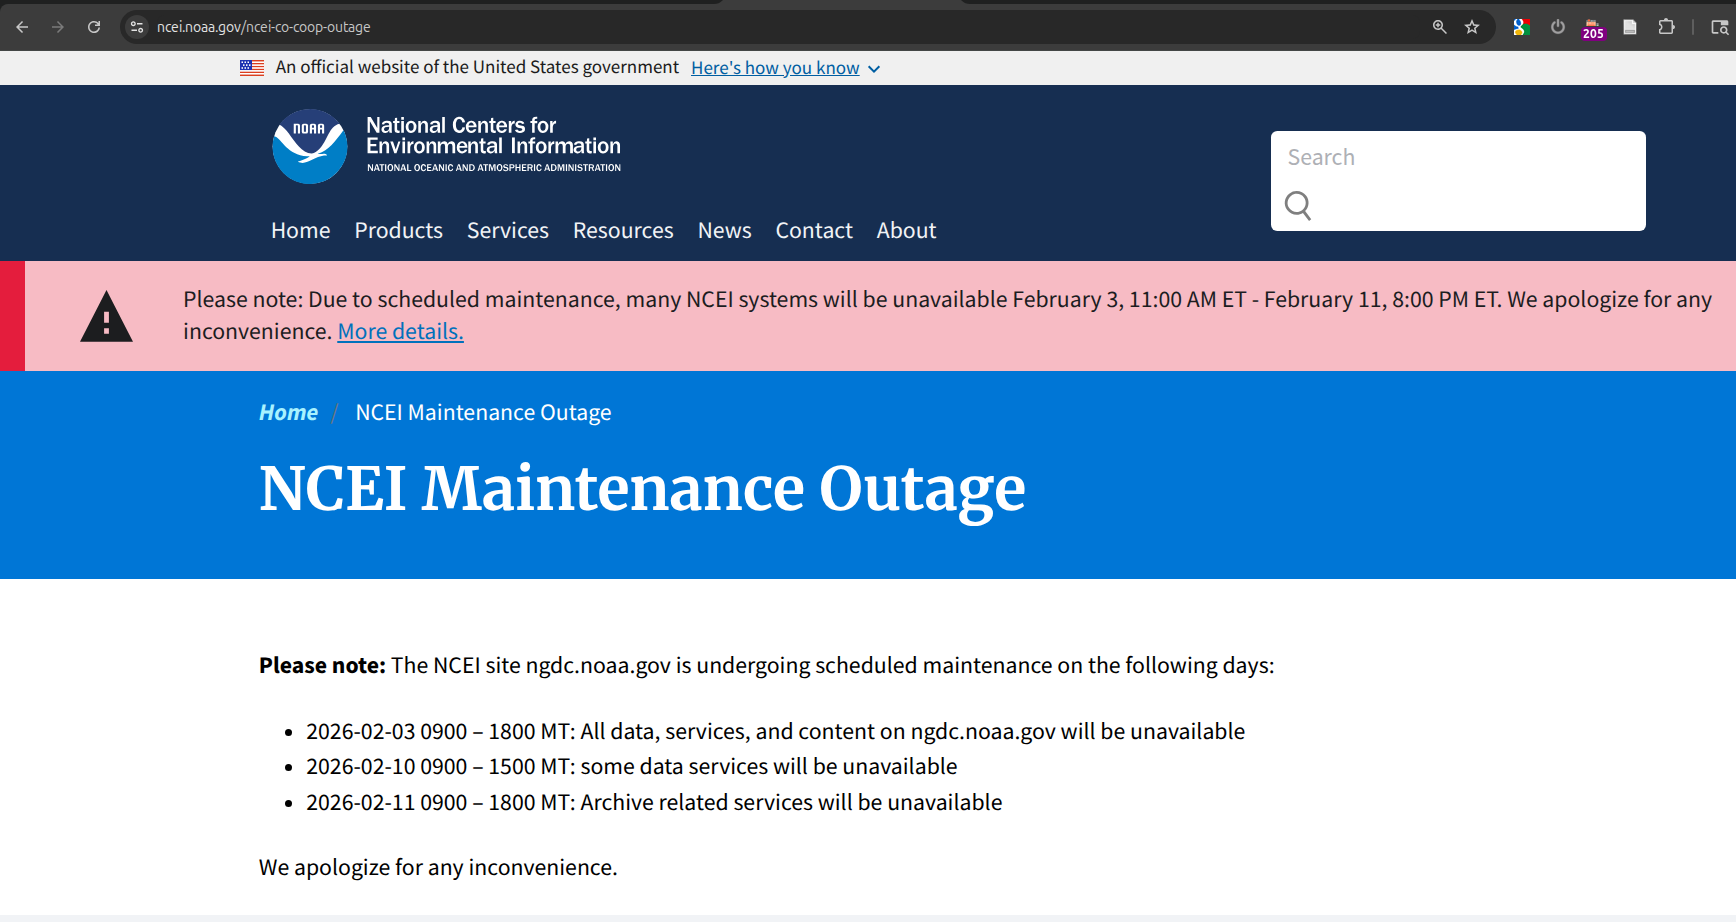
It seems more likely whatever delay there is with the GCHN data its still part of the ongoing upgrade process. Given this is abnormal and looking at the available GCHNh at this point we should probably expect a delay in the release this month ...
Oof something happened in the latest ghcm (ghcnm.v4.0.1.20260205). Probably should discard it for doing any runs (technically looks like better coverage but its missing more stations then yesterday)....
Yesterday:
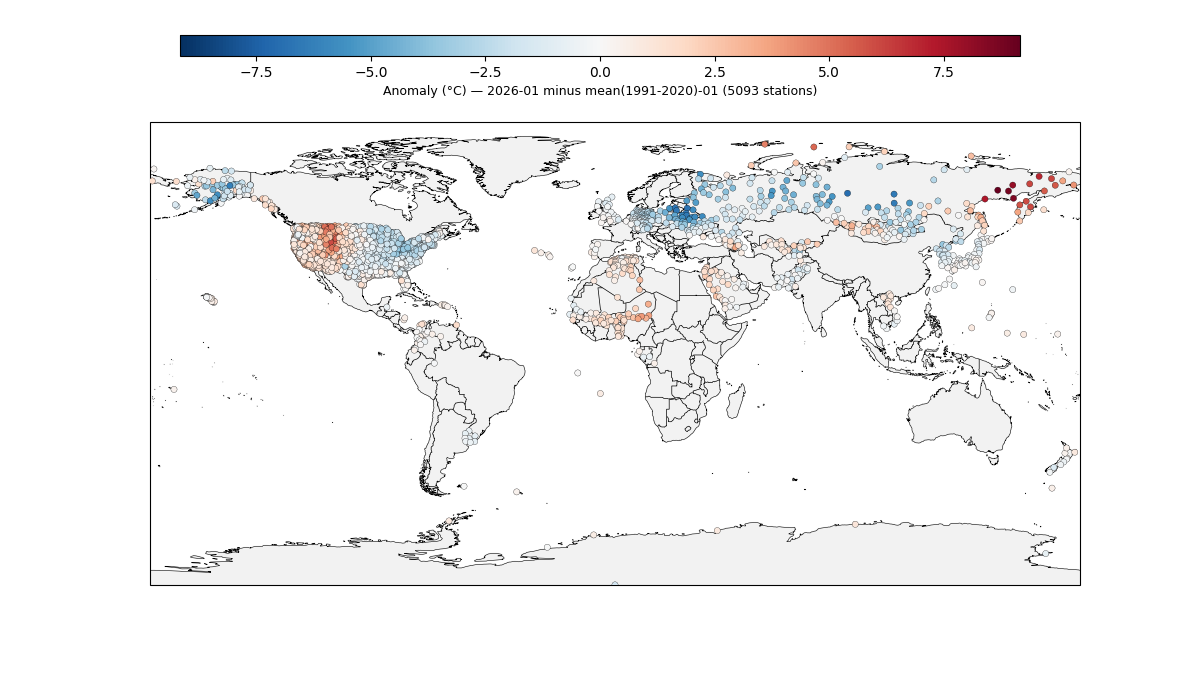
Reference range 1991-2020, month 1: 17866 usable stations, Overlap 5093
Today:
Reference range 1991-2020, month 1: 15758 usable stations, Overlap 3932
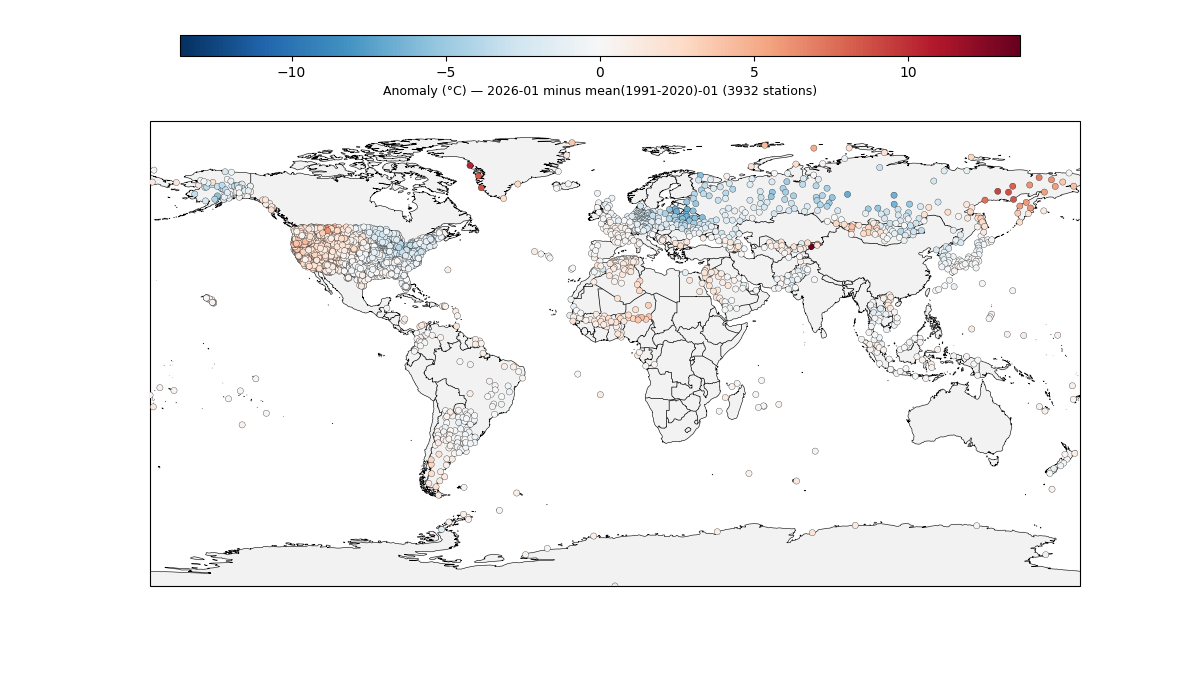
@Rhhgdd Looks good.. On the high side for my end as a center point prediction (~1.135), but I haven't looked at the spatial anomalies to see how if there are any particular areas where data availability might bias it.... (Also the Jan month model is one of those that have a fairly large ERA5->gistemp correction in my linear model)...
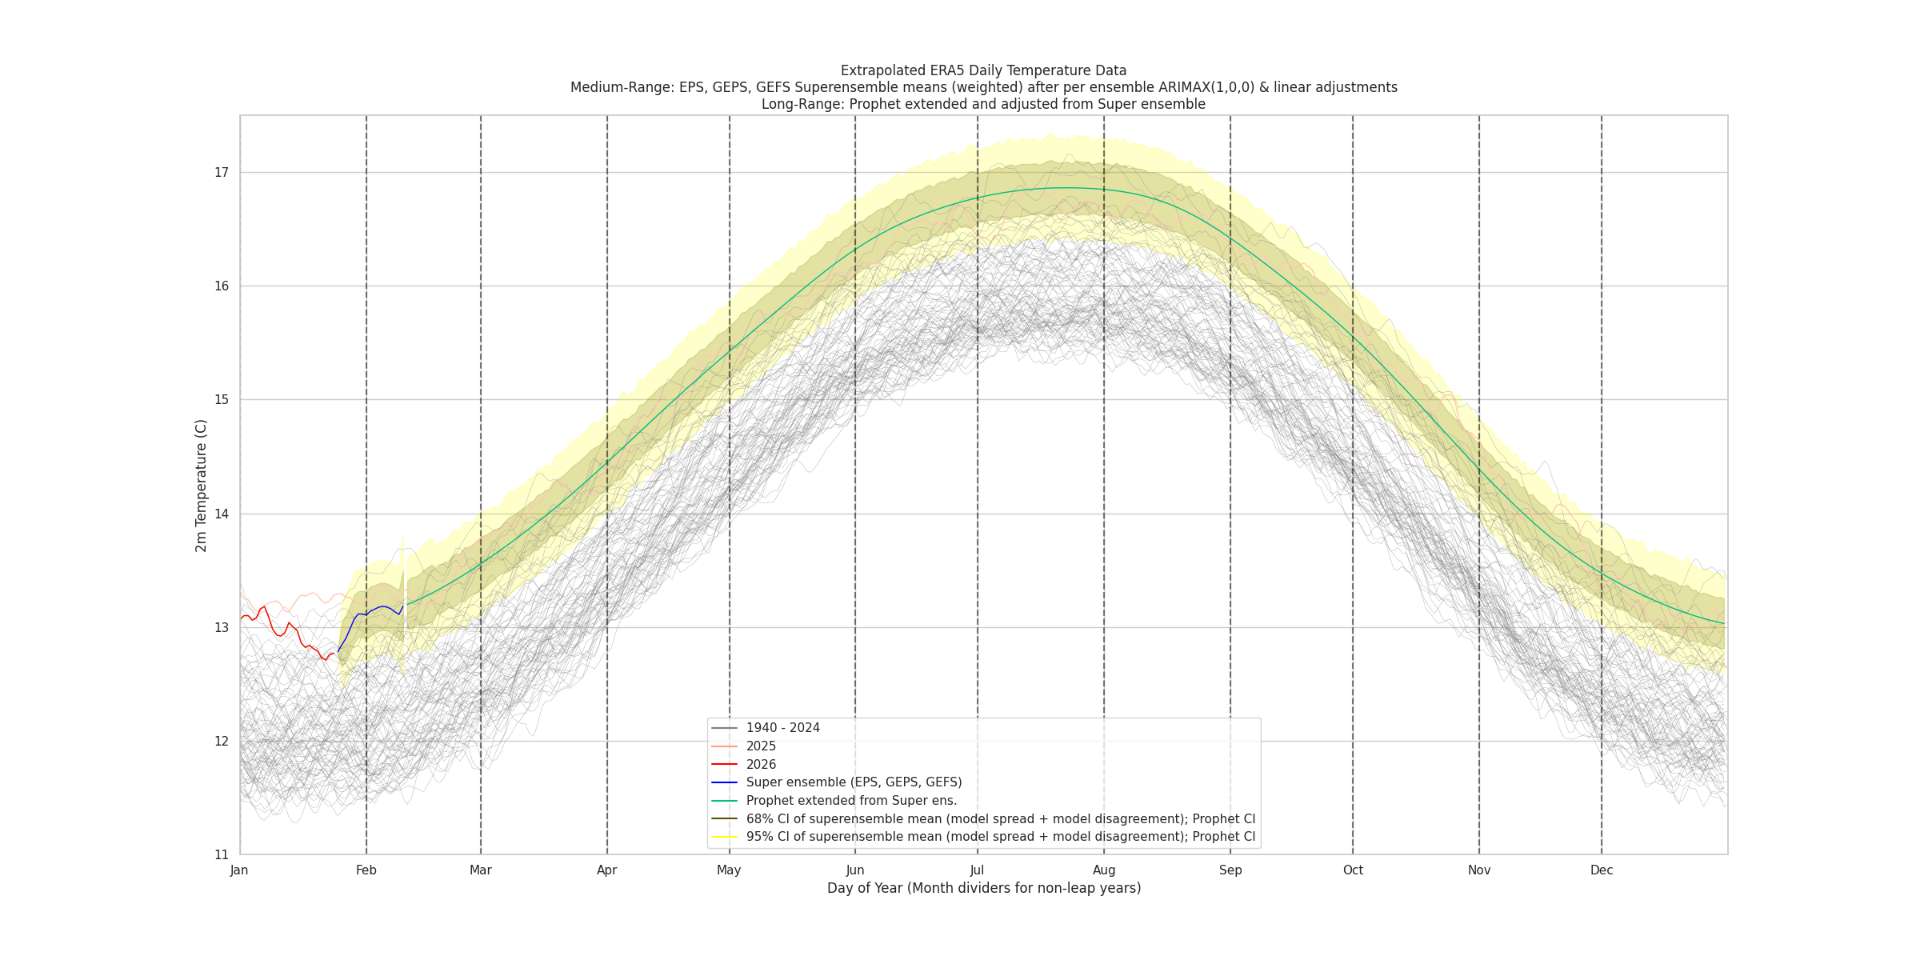
the AO trending neutral at the end of the month is likely the main contributor to the return to warmer temps. At the moment I would discount the climatological rise for the second half of Feb for the moment given the more recent, albeit speculative SSW forecasts ..
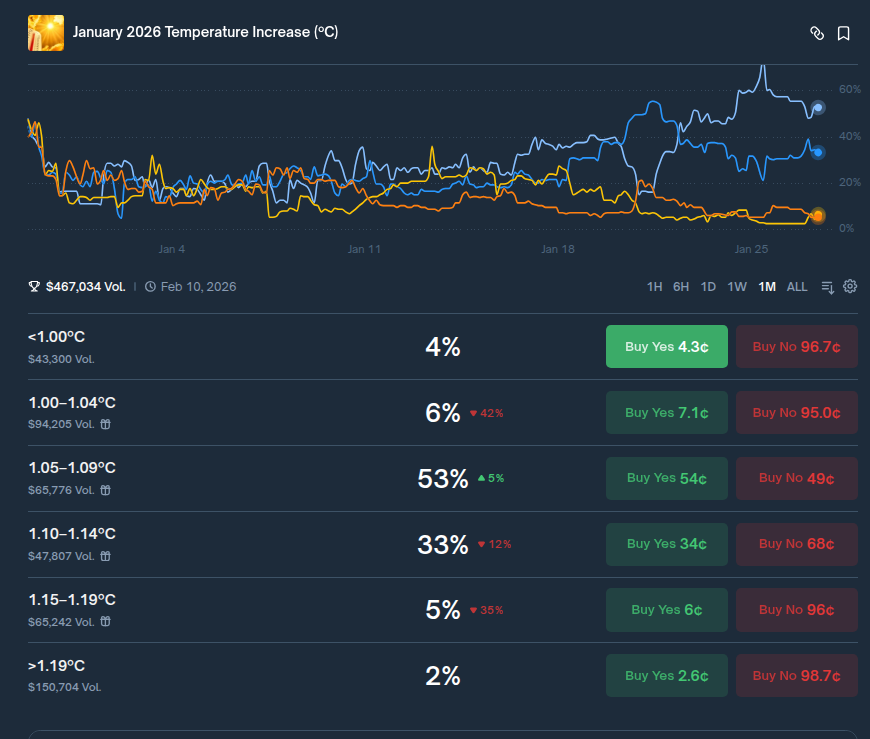
Holding fairly steady, so I don't understand what polymarket is up to... looks quite a bit mispriced for the last few days ... Maybe someone has developed a better model based on the incomplete data to be expected and how it will bias? That or the biggest bettors are leaning heavily on a statistical model? The latter seems unlikely based on Polymarket's track record but I don't know who is responsible for the current pricing....
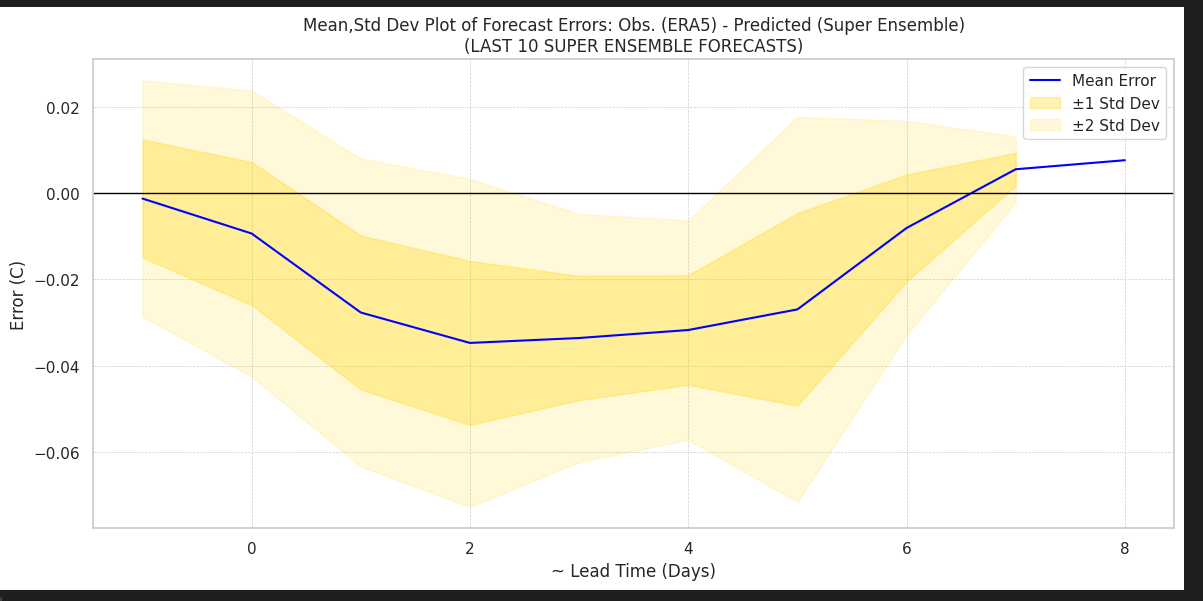
Recent errors for short lead times for the superensemble haven't been particularly bad. With 6 days left, despite models being on slightly the warm side (fairly usual performance), even a average daily conservative error with respect to ERA5 of -0.03 wouldn't amount to a change more than -0.03*6/31 ~= -0.006 C, which wouldn't anywhere near account for the discrepancy between our center point predictions and Polymarket's implied one.
Final ERA5 data is in last night, so for my ERA5->GISTEMP prediction (adjusted) is 1.128 C (1.114 C unadjusted).
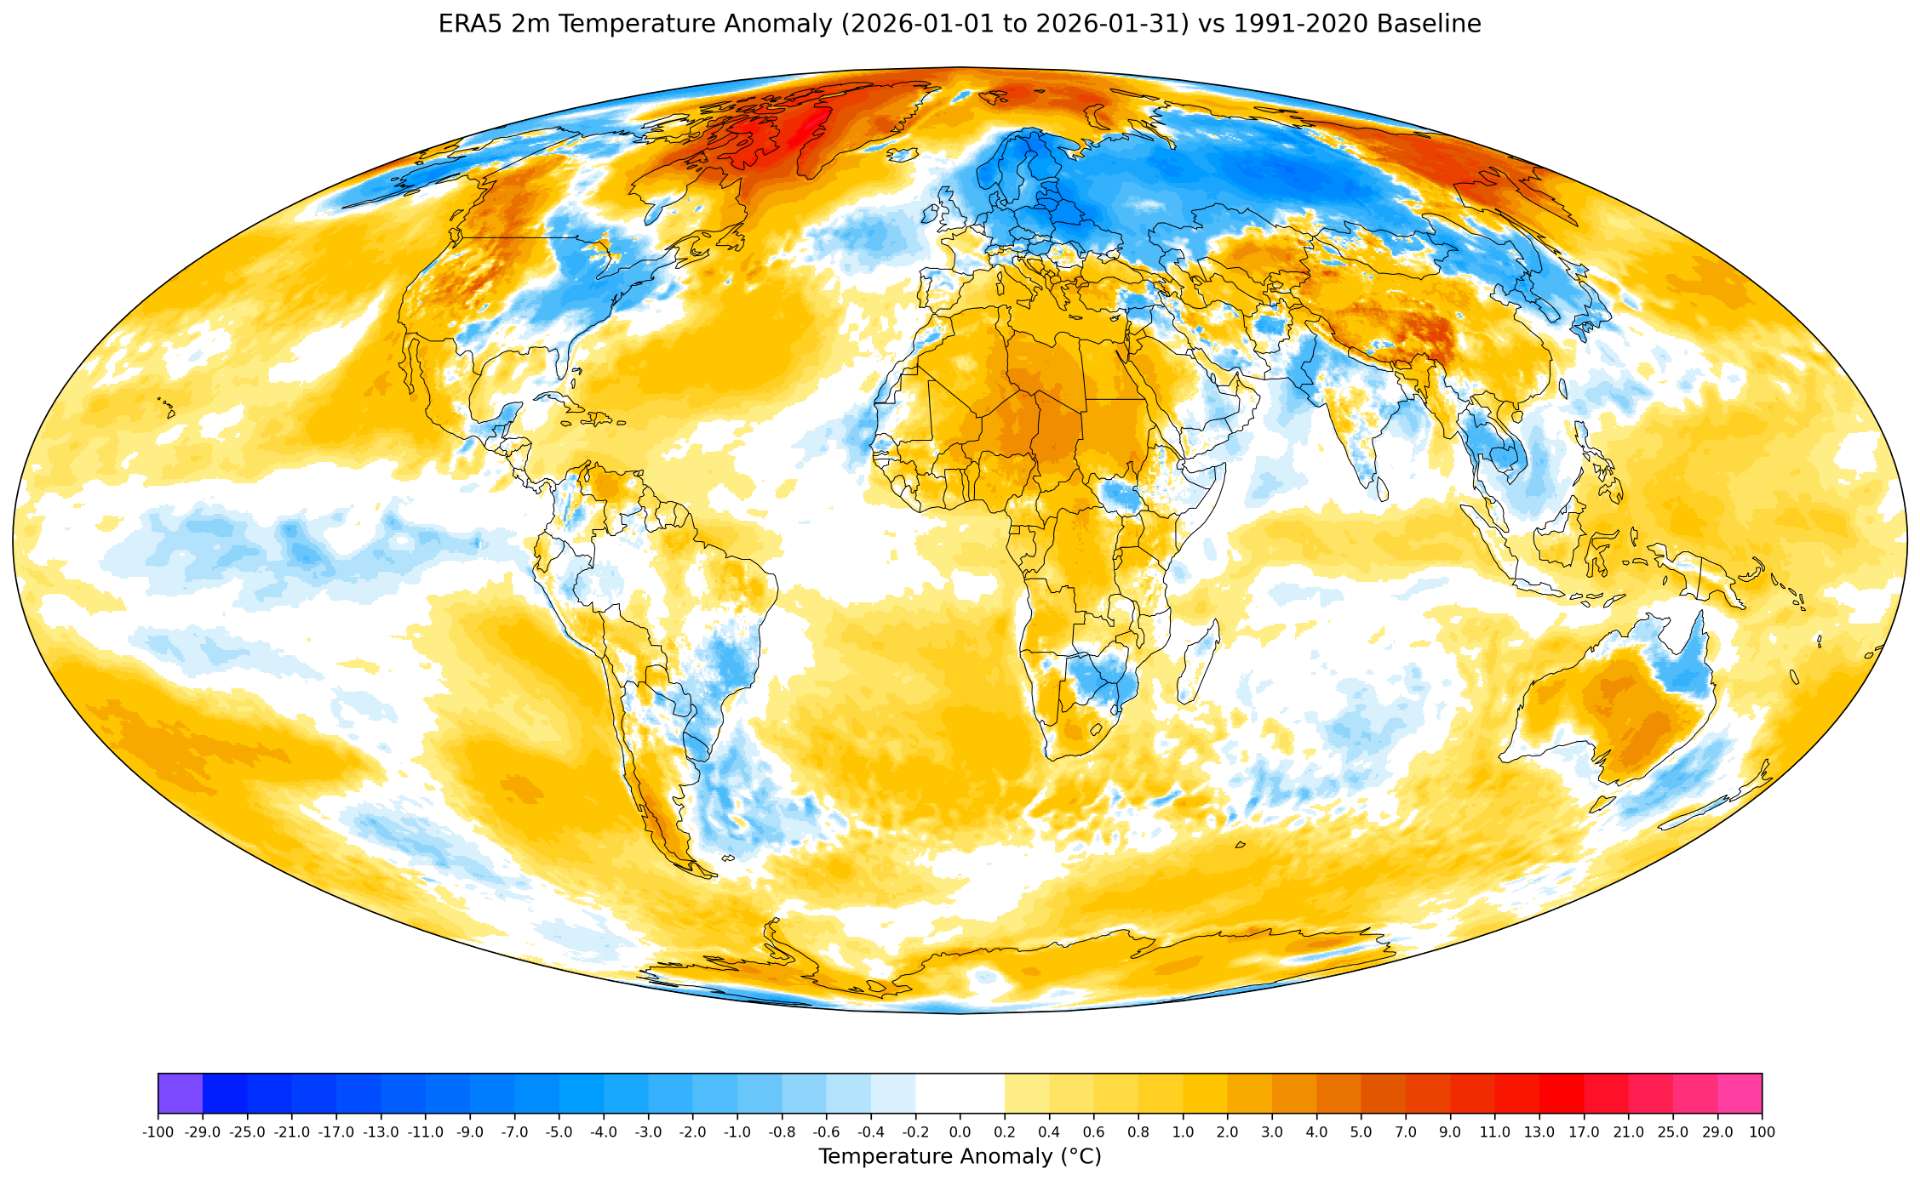
Edit (gfx to 31st): Looking at the ERA5 anomalies .....
ghcnm data that could be late based on the past few months where it has been erratic that could cause it to be lower would be China and Svalbard & possibly Jan Mayen as it seems would likely be infilled with less anomalously hot temps.
Given that I've noticed a pattern of more of the central Antarctic stations showing up later then the coastal ones I don't think this will cause it to drop down and actually might contribute slightly warmer until they do. China is the biggest risk though.
Given the disagreement with polymarket, I went back to the predictions I've made in the last year or so as well:
Last year, the error for my January 2025 prediction with the linear model was 0.00C (this was before I started collecting unrounded decimal data from gistemp).
Considering that currently the mean bias that I use to adjust my prediction is 0.014, I should probably expect the final temp to be between the unadjusted and adjusted prediction I made (and similarly for the probabilities; I calculated this time two sets for both -- that is with and without the adjustment), and thus I adjust my bets now splitting both (the probs for the bin below,above the main bin just end up swapping probabilities since the center is close to the middle of the bin, which results in a symmetric dist. when taking the difference).
Given all of the above I take the probability for the central point to be somewhere between 16/18 (the number of predictions I considered decent / total predictions) of the way between the inherit probabilities you could derive from gistemp alone and my own forecast errors (which would put it at 62% instead of 64%, and then reduce it slightly further based on China, etc (perhaps I should have reduced it further than 60% but I am hopeful enough that the necessary data will be there this month by Jan 9....).
More notes for self regarding the two large misses last year (Aug. and Sep. 2025):
In 2025 though there were two months that were outliers -- August and September; even using more up to date data for those errors they still significant outliers (0.123 and 0.078); I switched to a per month linear model more than a year ago rather than switch back and forth to a yearly model depending on the scoring (i.e. significant p-value) as it seemed more worth it subjectively, however even taking the linear model correction for August it wouldn't significantly reduce the error (perhaps down to ~0.10). September does have a significant p-value so the large error is still unexplained. I thought some months ago perhaps this error would go away with more data, but now with only ~400 less stations (9466 vs 9883 compared to last year when going by those with enough data in common with 1991-2020 baseline) it seems this isn't the case. This only means there is still some significant bias/variance between datasets remaining that needs to be adjusted for to go beyond the naive, linear ERA5->gistemp model -- this is future work I've put off for a long time. For reference January monthly model is a good fit as well.
For all other errors I use the unrounded value at the release date, which gives this past history of errors:
array([-0.02 , 0.01 , 0.03 , 0.01 , 0.02 , 0.03 , 0. , -0.01 , 0.021, 0.052, 0.004, -0.013, 0.053, 0.123, 0.078, 0.005, 0.011, 0.02 ])
For the time being I've removed them (bolded) from the calculations as outliers until I can do enough research to come up with a robust improvement to the linear model.
@Rhhgdd the ERA5 data was finalized yesterday morning so my numbers are already final from that. Feel free to bet the lower bin up more if you want ...
In other news, still no ghcnm revision yet today for Feb 4 (its usually out by now, but it could come later...)
@Rhhgdd no official schedule but yes (barring data problems!!; from my understanding H.R. 6938 passed with strong support and should be signed by Trump next week I guess? So they shouldn’t affected politically by any February shutdown which is in the 20% ish range?)