
Data is currently at
https://data.giss.nasa.gov/gistemp/tabledata_v4/GLB.Ts+dSST.csv
or
https://data.giss.nasa.gov/gistemp/tabledata_v4/GLB.Ts+dSST.txt
(or such updated location for this Gistemp v4 LOTI data)
January 2024 might show as 122 in hundredths of a degree C, this is +1.22C above the 1951-1980 base period. If it shows as 1.22 then it is in degrees i.e. 1.22C. Same logic/interpretation as this will be applied.
If the version or base period changes then I will consult with traders over what is best way for any such change to have least effect on betting positions or consider N/A if it is unclear what the sensible least effect resolution should be.
Numbers expected to be displayed to hundredth of a degree. The extra digit used here is to ensure understanding that +1.20C does not resolve an exceed 1.205C option as yes.
🏅 Top traders
| # | Trader | Total profit |
|---|---|---|
| 1 | Ṁ631 | |
| 2 | Ṁ347 | |
| 3 | Ṁ88 | |
| 4 | Ṁ13 | |
| 5 | Ṁ5 |
People are also trading
September market is up:
https://manifold.markets/ChristopherRandles/global-average-temperature-septembe
@parhizj Some troll made an account "0x2..." and "aelarps". Then they renamed "aelarps" to "aenews3" and I think the other to "aenews20". They kept spamming the comments with misinformation and attacking me. Presumably they were trying to pump N bags on some other account. Anyways, I found them very, very annoying.
@parhizj Lol yeah apparently you didn't "convert Fahrenheit to Celsius" lmao, he just kept slinging mud at the wall and hoping something sticks...
@aenews Somehow I doubt the majority of polymarket bettors are paying attention to these Manifold markets....
@parhizj Ngl I'm surprised you guys put so much work into this for mana (and open source the alpha) when that kind of edge on Polymarket would easily make you 10's or 100's of K on these temp markets (well maybe some of you do =).
@aenews The benefits of getting better at predicting is priceless (for me at least).
Edit: For me, lack of competitors seems to be what hurts getting better the most, and data moats for products used for predictions only weaken the field more.
@parhizj yep 1.30 published
https://data.giss.nasa.gov/gistemp/tabledata_v4/GLB.Ts+dSST.txt
@parhizj
August 2024 was the joint-warmest August globally (together with August 2023), with an average ERA5 surface air temperature of 16.82°C, 0.71°C above the 1991-2020 average for August.
If that is tied to nearest hundredth, why are you expecting LOTI to be 10 hundredths warmer?
(Assume I am being thick and not following what your graphs and explanations show.)
@ChristopherRandles Referring to the graphs below based on ERA5 data? The last prediction I made before ERSST data came out was 1.294 C. Look at the error from last August 2023 (orange dot) using that method (ERA5->GISTEMP) -- it was ~ 0.1C cooler than expected, but the range of values is also large (~0.1C). The error for the linear model I used for August (to try to correct any bias between ERA5 and GISTEMP) is also ~0.1C. I hope this explains why I expected it to be ~1.29; in other words, I interpret it as an unknown mix in this model of either the GISTEMP value from last year was underestimating or ERA5 overestimating the value from August 2023.
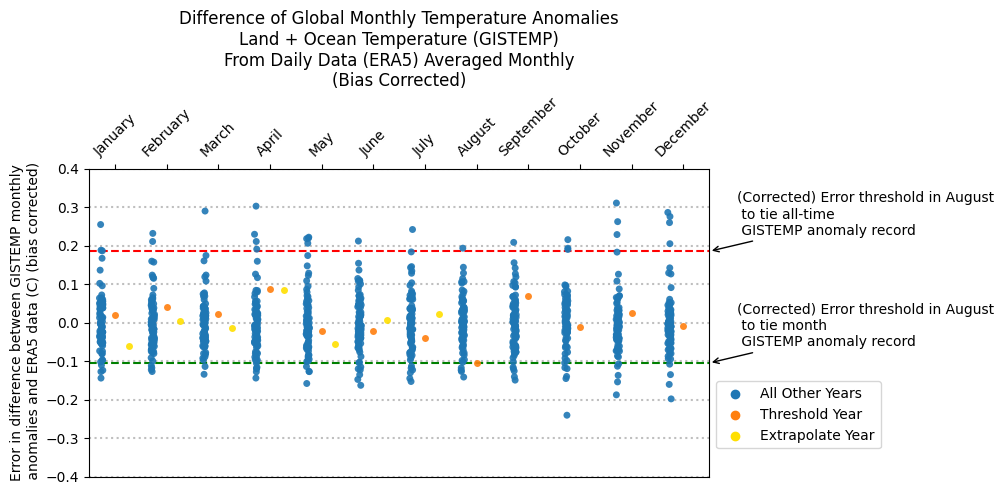
@ChristopherRandles That actually implies similar anomalies. My ERA5 model median was 127 for GISTEMP based on a near tie in ERA5. Why? On same base period, that is actually a 131 anomaly. We expect the differential between GISS and ERA5 to not be as large anymore (119 vs 131), as it was last year (due to the El Nino).
In any case, we now have GHCN and ERSST data which settles it.
@aenews Or to put it another way, the differential between ERA5 and GISTEMP was anomalously high last year (owing to quirks of hot and cold patches instigated by El Nino). So they should be close to in line now that we are back to ENSO Neutral.
@aenews Yeah. Remember I posted the link to the repo in last months market. It requires using an old version of their own ERSST for the correct masking by month and sub box though.
Polymarket has 97% chance record warm
https://polymarket.com/event/2024-august-hottest-on-record?tid=1725282541031
No ersst data yet... seems to be pure modeling... Don't know how to reduce my error bars to make them tighter given my simple model....
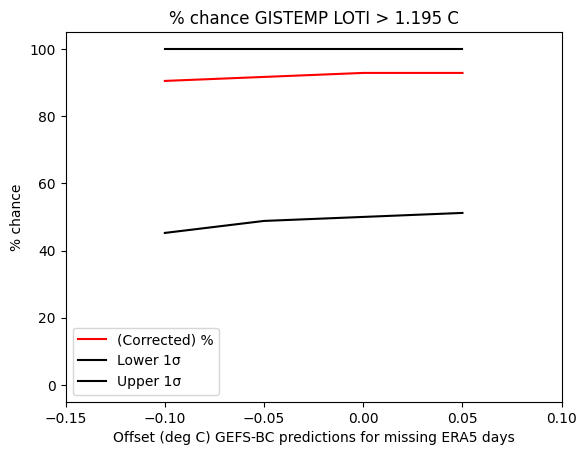
GIS TEMP anomaly projection (August 2024) (corrected, assuming -0.014 error, (absolute_corrected_era5: 16.805)):
  1.294 C +-0.098
To be fair to the 97% on poly, I do get a really high prediction.... I'd have to reduce it the prediction a bit more for it to not be in the 1 sigma margin of error I get...
@parhizj I think ppl might be creating „fake“ ERSST & GHCNM files using other datasets. Then you can run the code as normal. That presumably gives you a decent bit more accuracy. Also, in my experience, the OISST dataset correlates better with ERSST than ERA5 does
Changed my betting based on a metaprediction for rest of month's predicted temps still being cooler than actual (i.e. meaning I need to offset temps for remaining days at least +0.1C still):
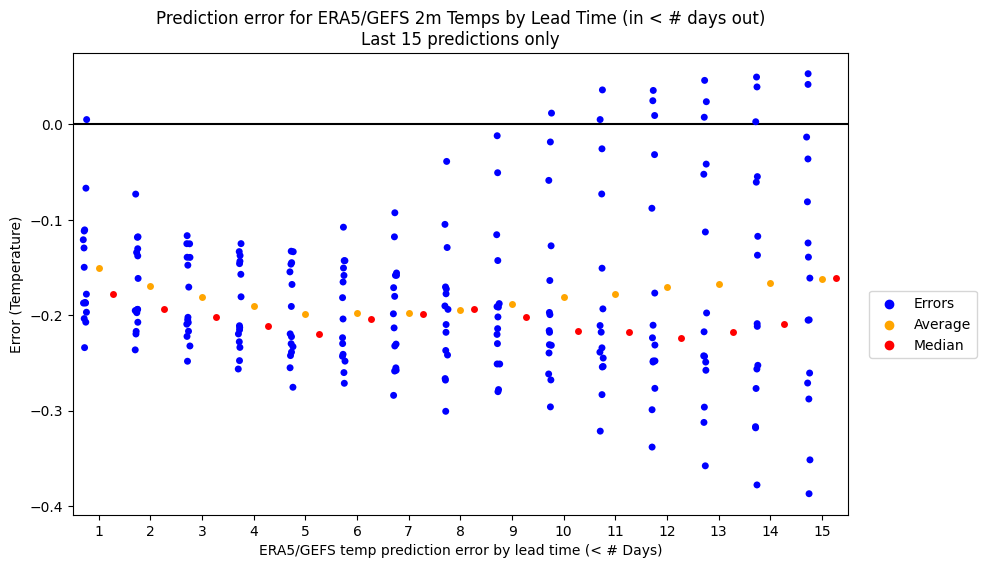
With it I get much less conservative (center) predictions but the lower end isn't improved too much...
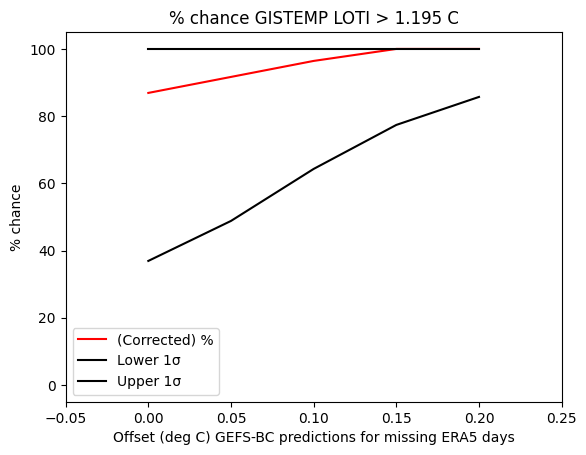
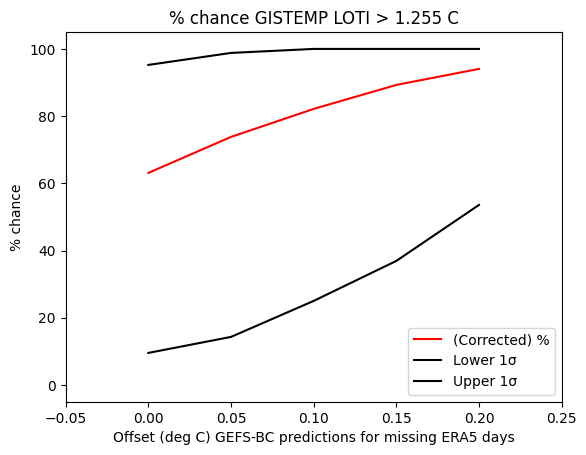
Large amount of gefs-era5 prediction error the last two days in the opposite direction of the metaprediction (about 0.1 degrees cooler than predicted) causing me to pick a more neutral offset for the remaining days to update upon:
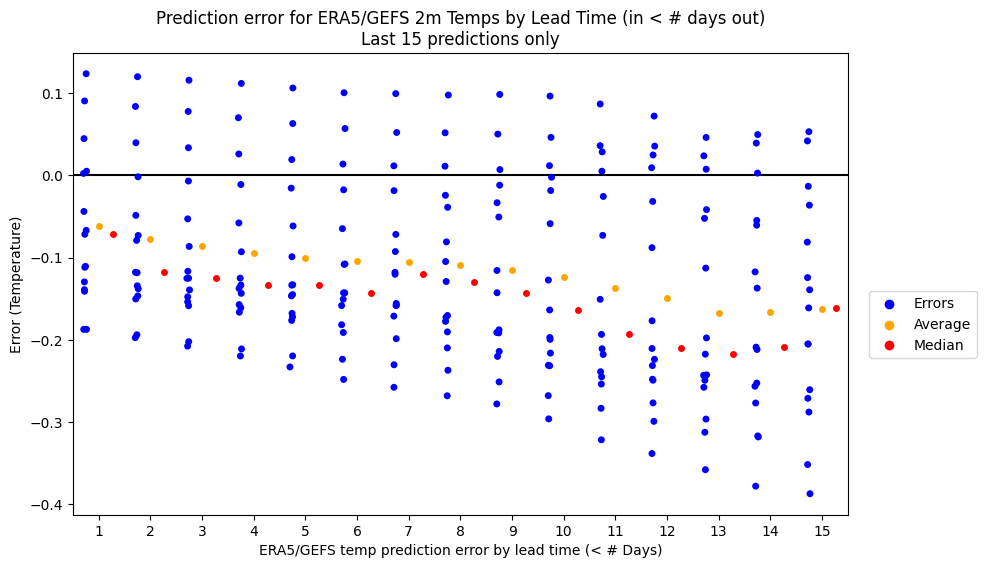
Only the highest bin suggests some additional correction might be needed...
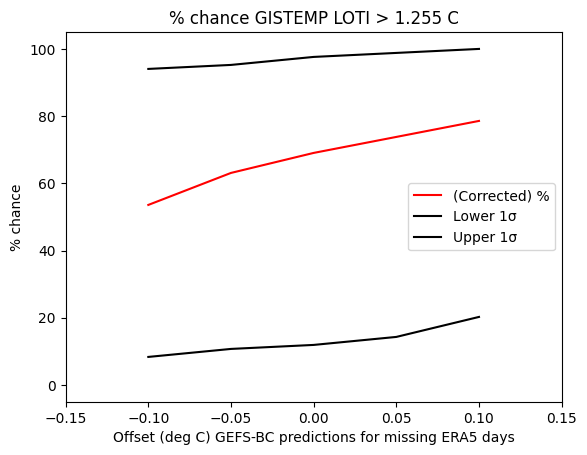
Edit: Polymarket suggests ~50% or lower and that's higher than even my more conservative estimates.
For August I don't have a large correction going from ERA5 to gistemp error in my model as August is one of those months that is not fitted per month like most of the other months. This seems to account for the moment for the largest amount of uncertainty (as opposed to the era5-gefs prediction error).
Right now I have with a neutral ERA5-GEFS offset (and a ERA5-gistemp correction of -0.014) a gistemp prediction of:
1.282 C +-0.098On the other hand the correction I used for July was shown to be actually too large (I had predicted ~1.18 or so if I recall and it was 1.21 so the correction I made of about -0.06 which was about twice as much. Here I have a correction of only -0.014 for August; even if I guess a correction of -0.03 that would bring that 1.282 down to 1.266, and rounded would become 1.27
In what I would consider a plausible worst case is if the remaining days gefs predictions are on average 0.1 warmer than ERA5 (requiring an offset of -0.1) ... This gives a corrected gistemp prediction of:
1.263 C +-0.098Subtracting again 0.016 leads to 1.247 C, rounded to 1.25 C. This scenario seems more in line with polymarket's current odds (which adding up the >=1.25+ bins gives 53%).
