Data is currently at
https://data.giss.nasa.gov/gistemp/tabledata_v4/GLB.Ts+dSST.csv
or
https://data.giss.nasa.gov/gistemp/tabledata_v4/GLB.Ts+dSST.txt
(or such updated location for this Gistemp v4 LOTI data)
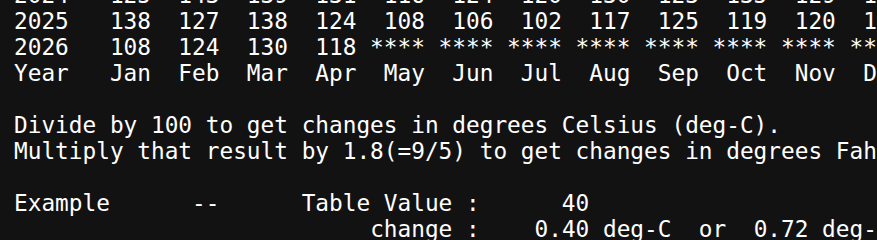
January 2024 might show as 124 in hundredths of a degree C, this is +1.24C above the 1951-1980 base period. If it shows as 1.22 then it is in degrees i.e. 1.22C. Same logic/interpretation as this will be applied.
If the version or base period changes then I will consult with traders over what is best way for any such change to have least effect on betting positions or consider N/A if it is unclear what the sensible least effect resolution should be.
Numbers expected to be displayed to hundredth of a degree. The extra digit used here is to ensure understanding that +1.20C resolves to an exceed 1.195C option.
Resolves per first update seen by me or posted as long, as there is no reason to think data shown is significantly in error. If there is reason to think there may be an error then resolution will be delayed at least 24 hours. Minor later update should not cause a need to re-resolve.
May 2026 market
 1,000
1,000🏅 Top traders
| # | Trader | Total profit |
|---|---|---|
| 1 | Ṁ959 | |
| 2 | Ṁ610 | |
| 3 | Ṁ401 | |
| 4 | Ṁ224 | |
| 5 | Ṁ180 |
People are also trading
@ChristopherRandles Can resolve now. 1.18 C official
They did indeed use ghcnm dated 20260507 (doing the run on Friday)
      ghcnm.tavg.v4.0.1.20260507.qcf.dat                    2026-05-08 02:20  165M
ghcnm.tavg.v4.0.1.20260507.qcu.dat 2026-05-08 02:20 165M @zenarxy This was a pretty good forecast. Initial data is 120.212 (ghcnm from last night, 20260502).
We got some Antarctica coverage already.
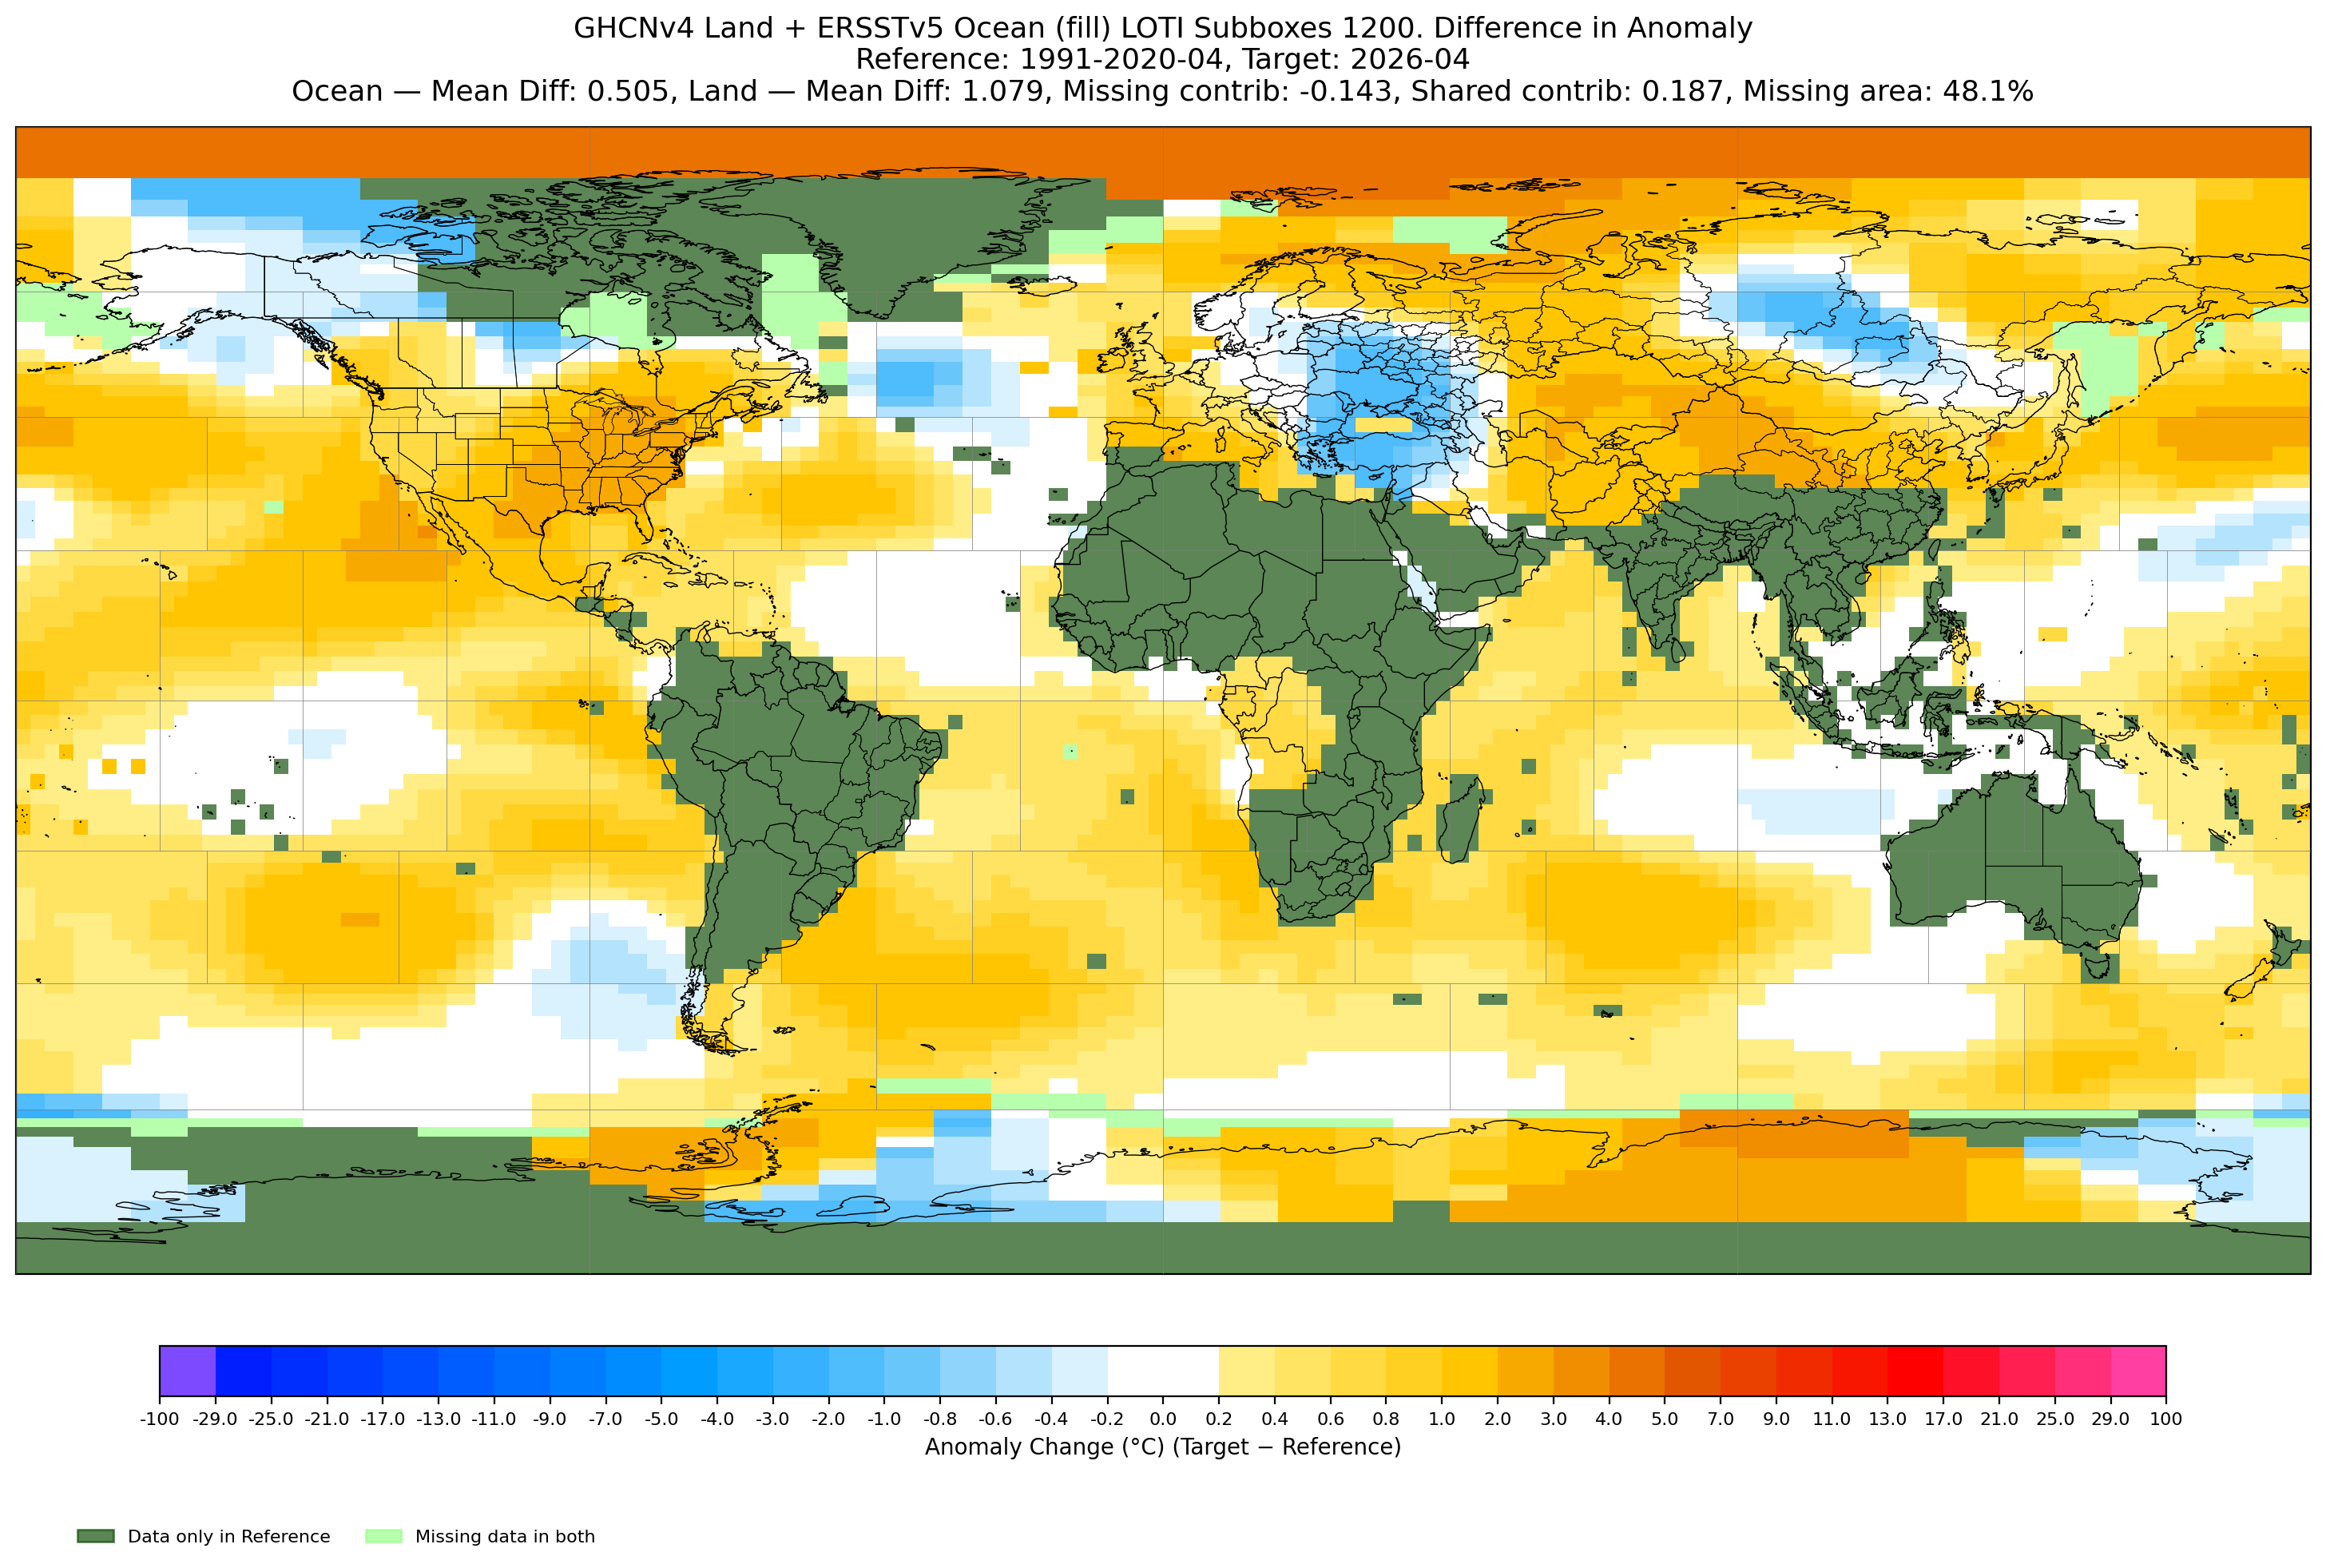
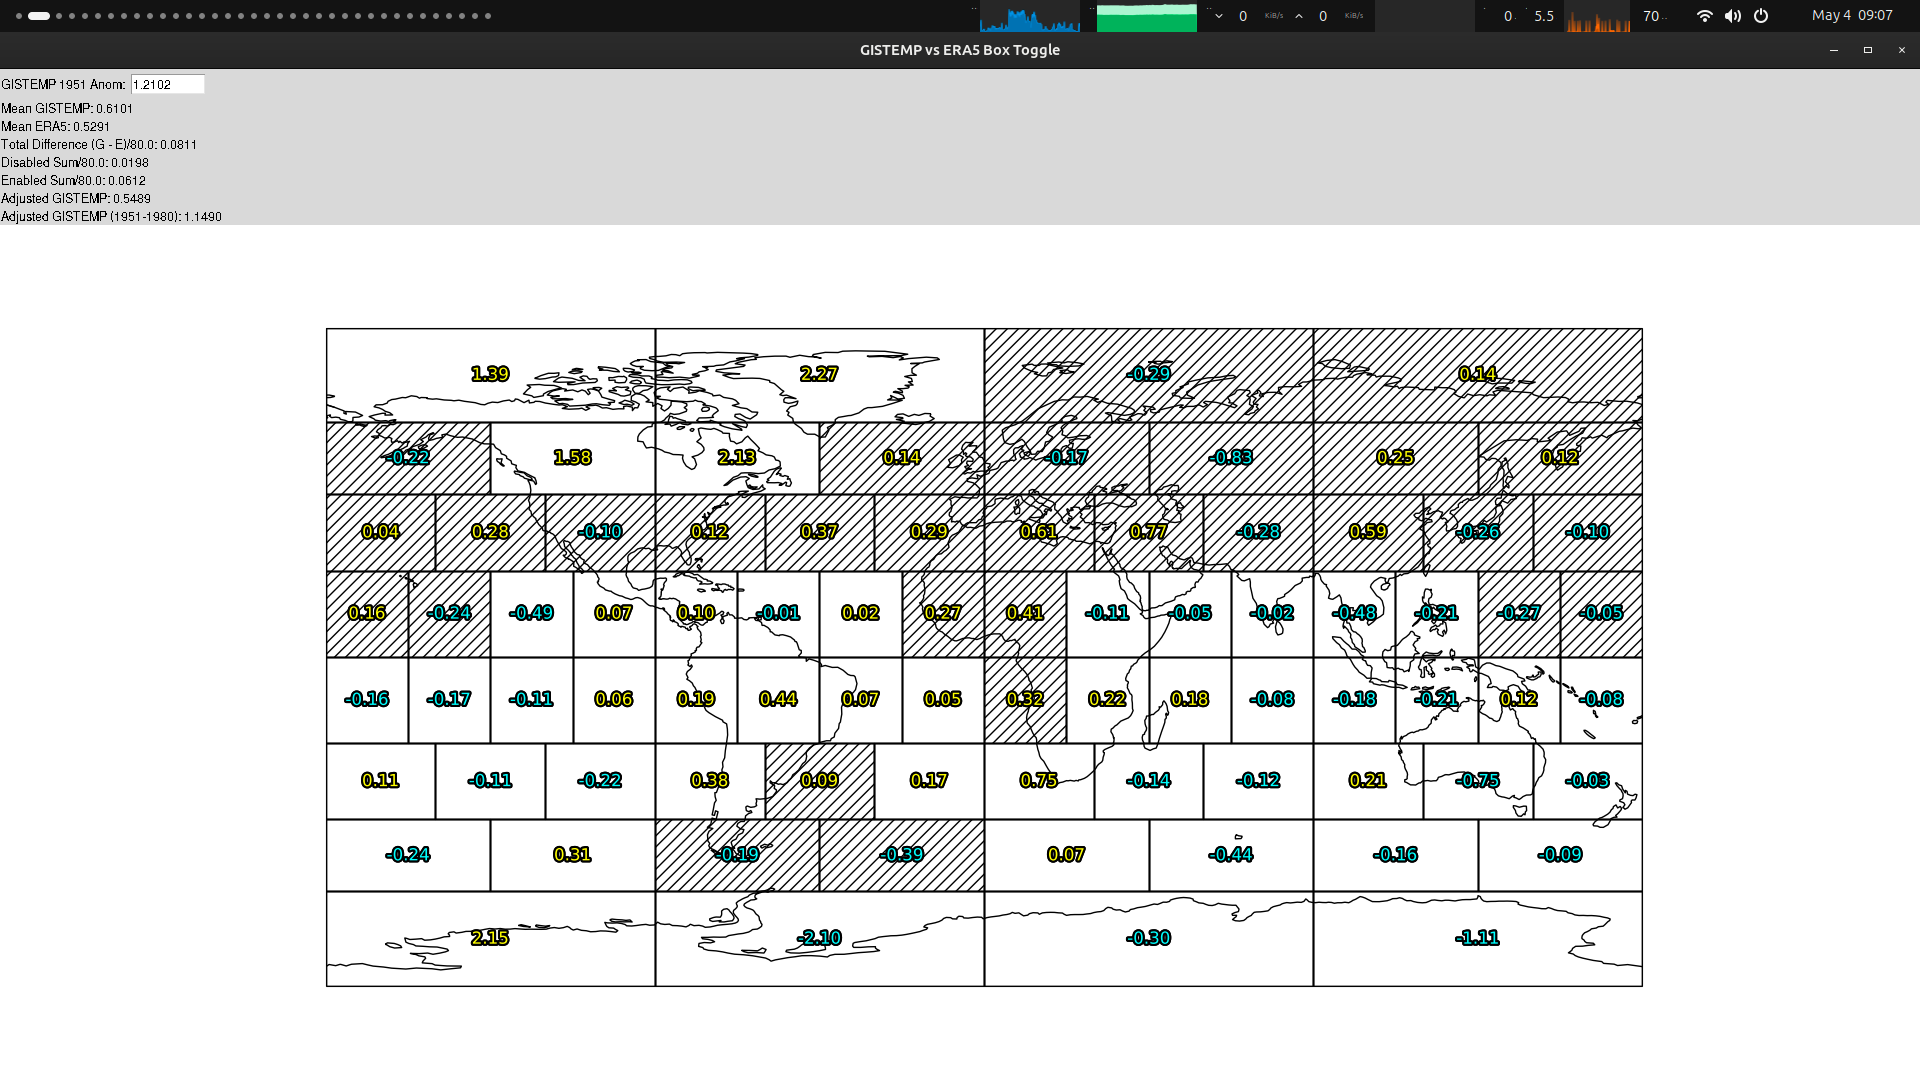
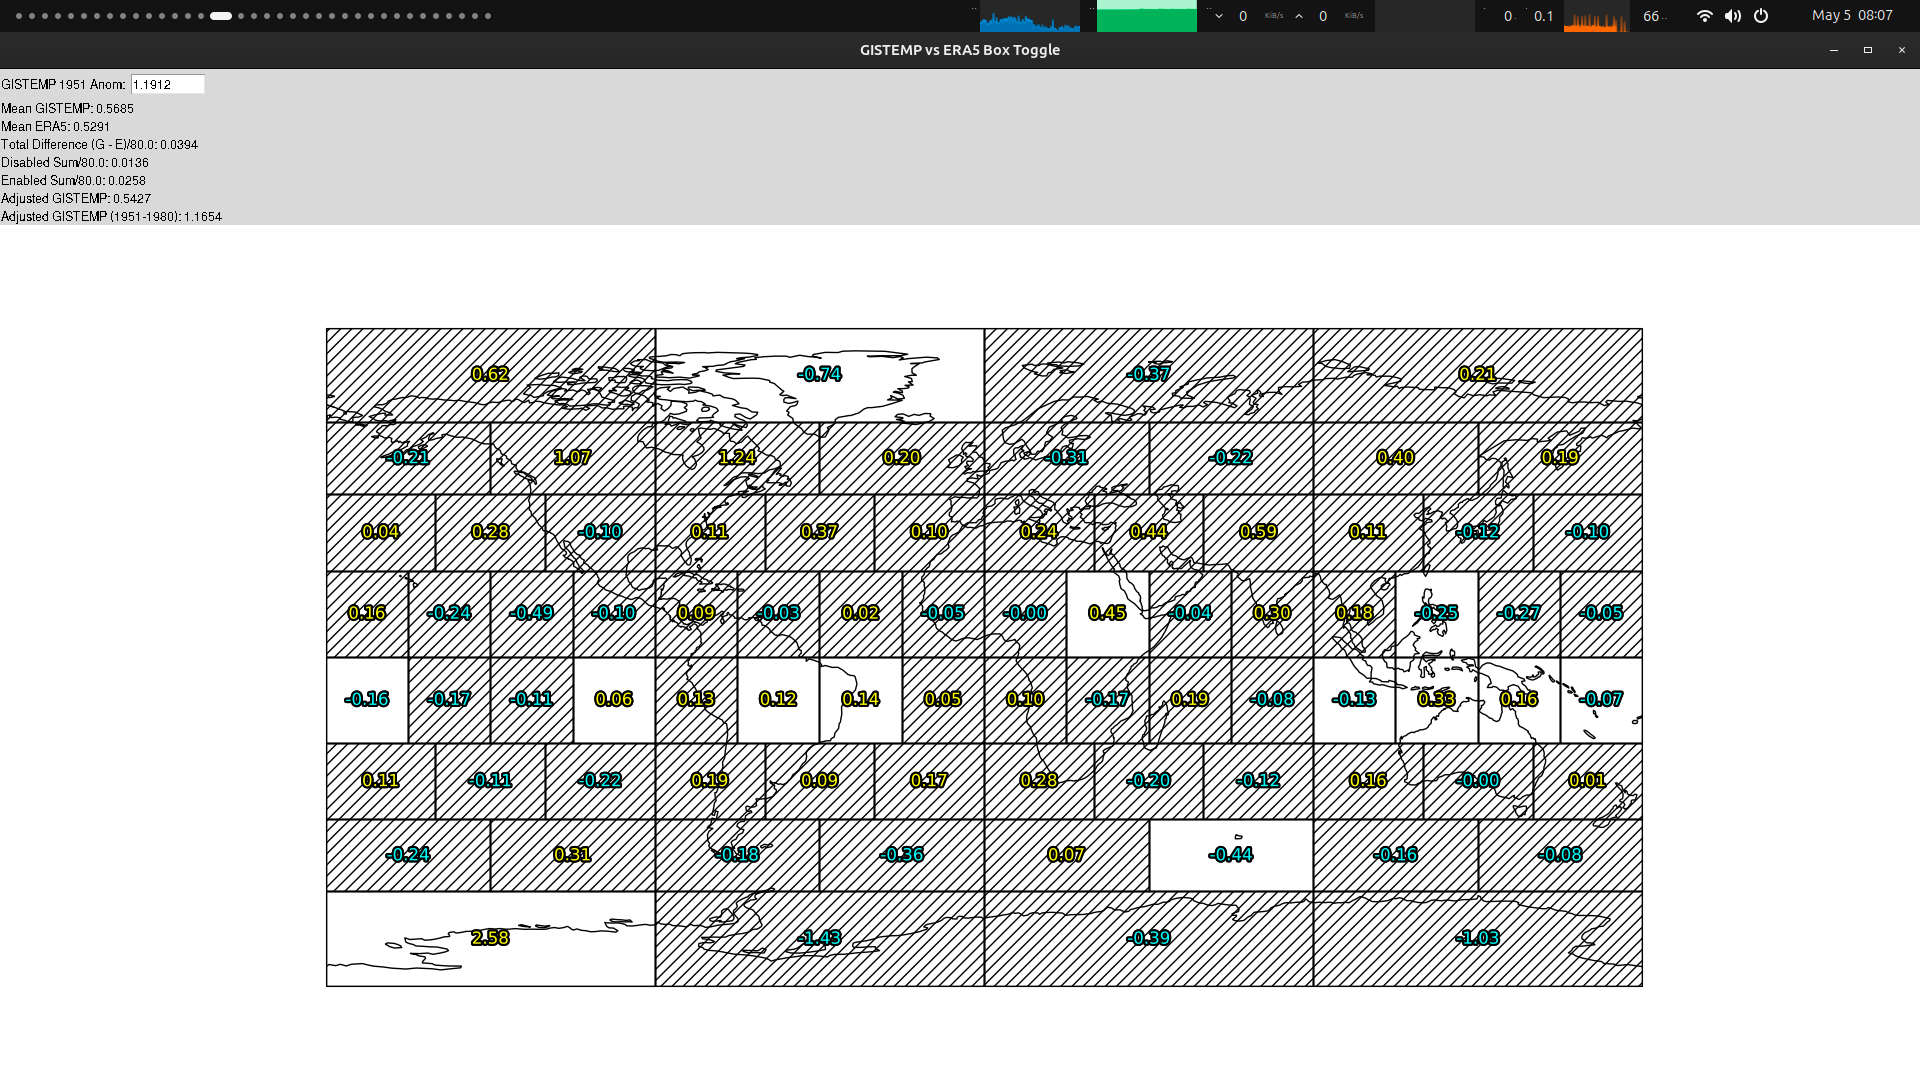
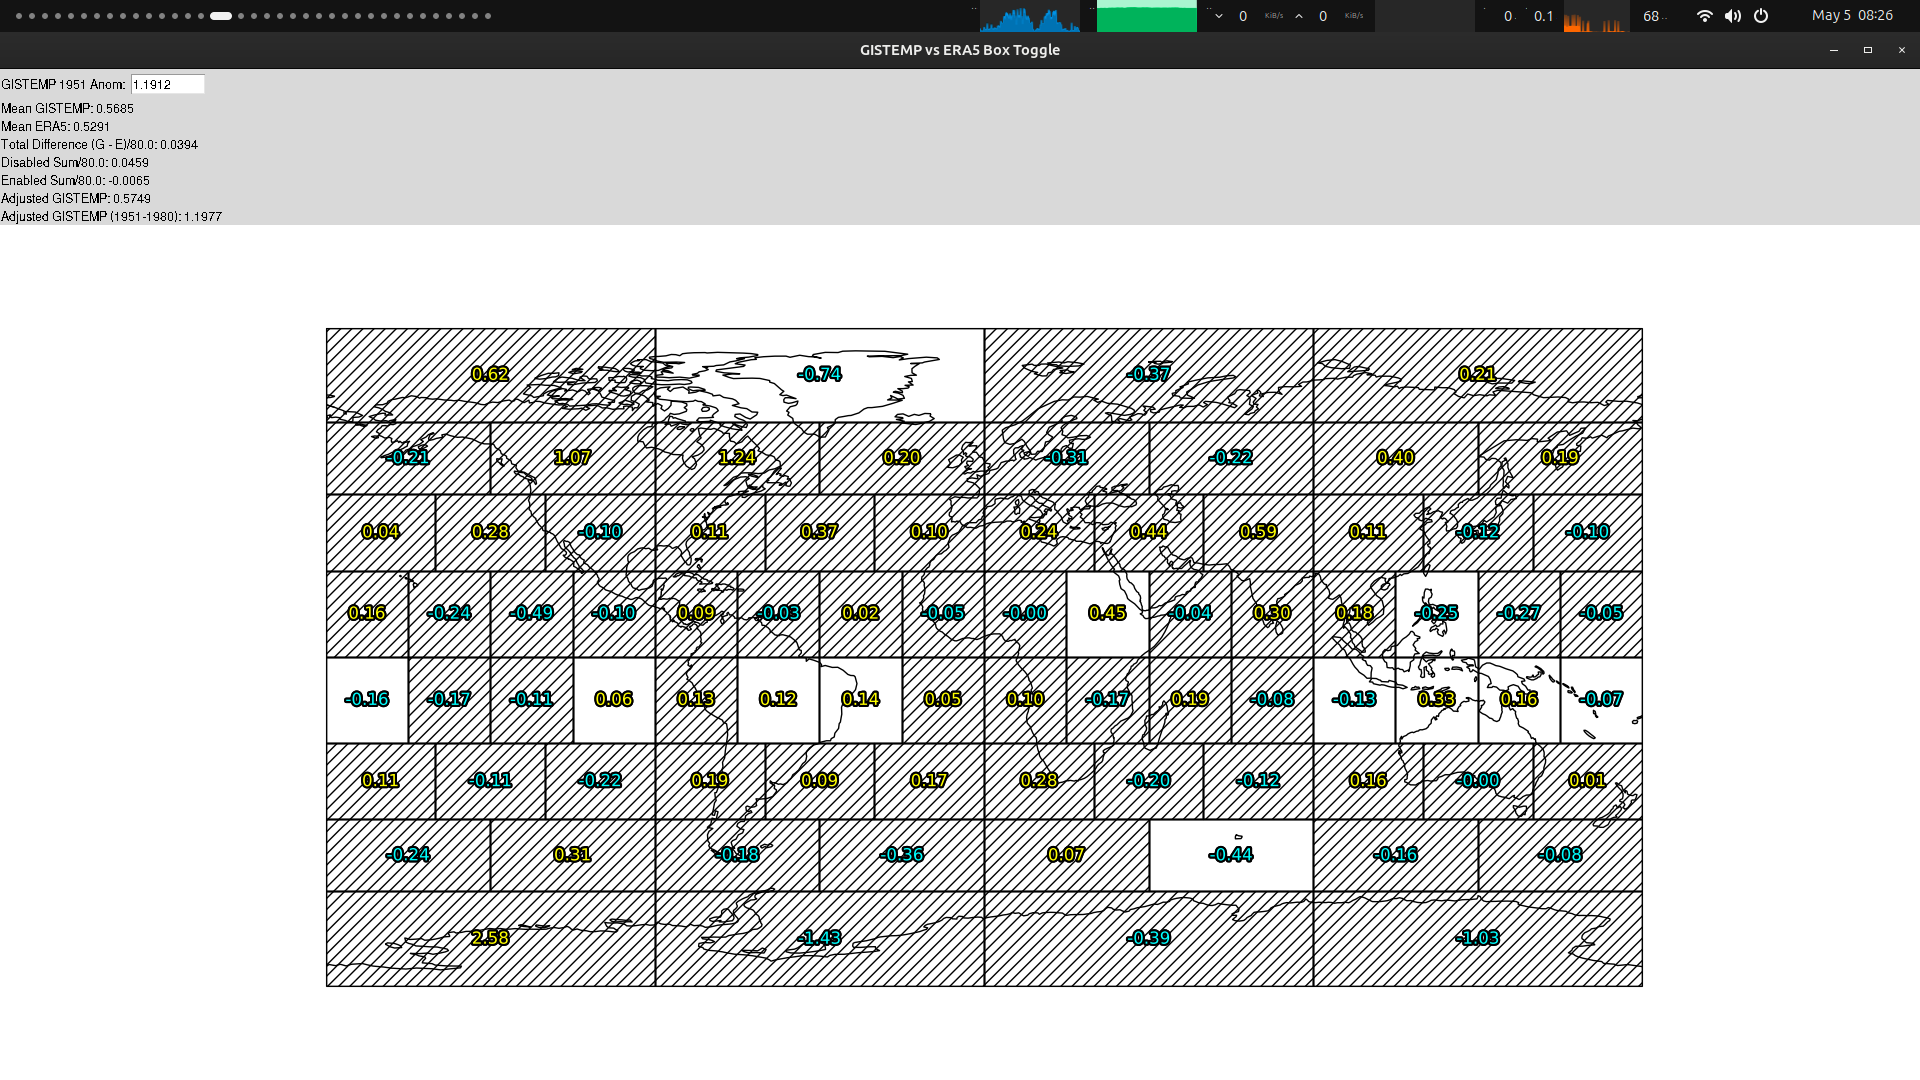
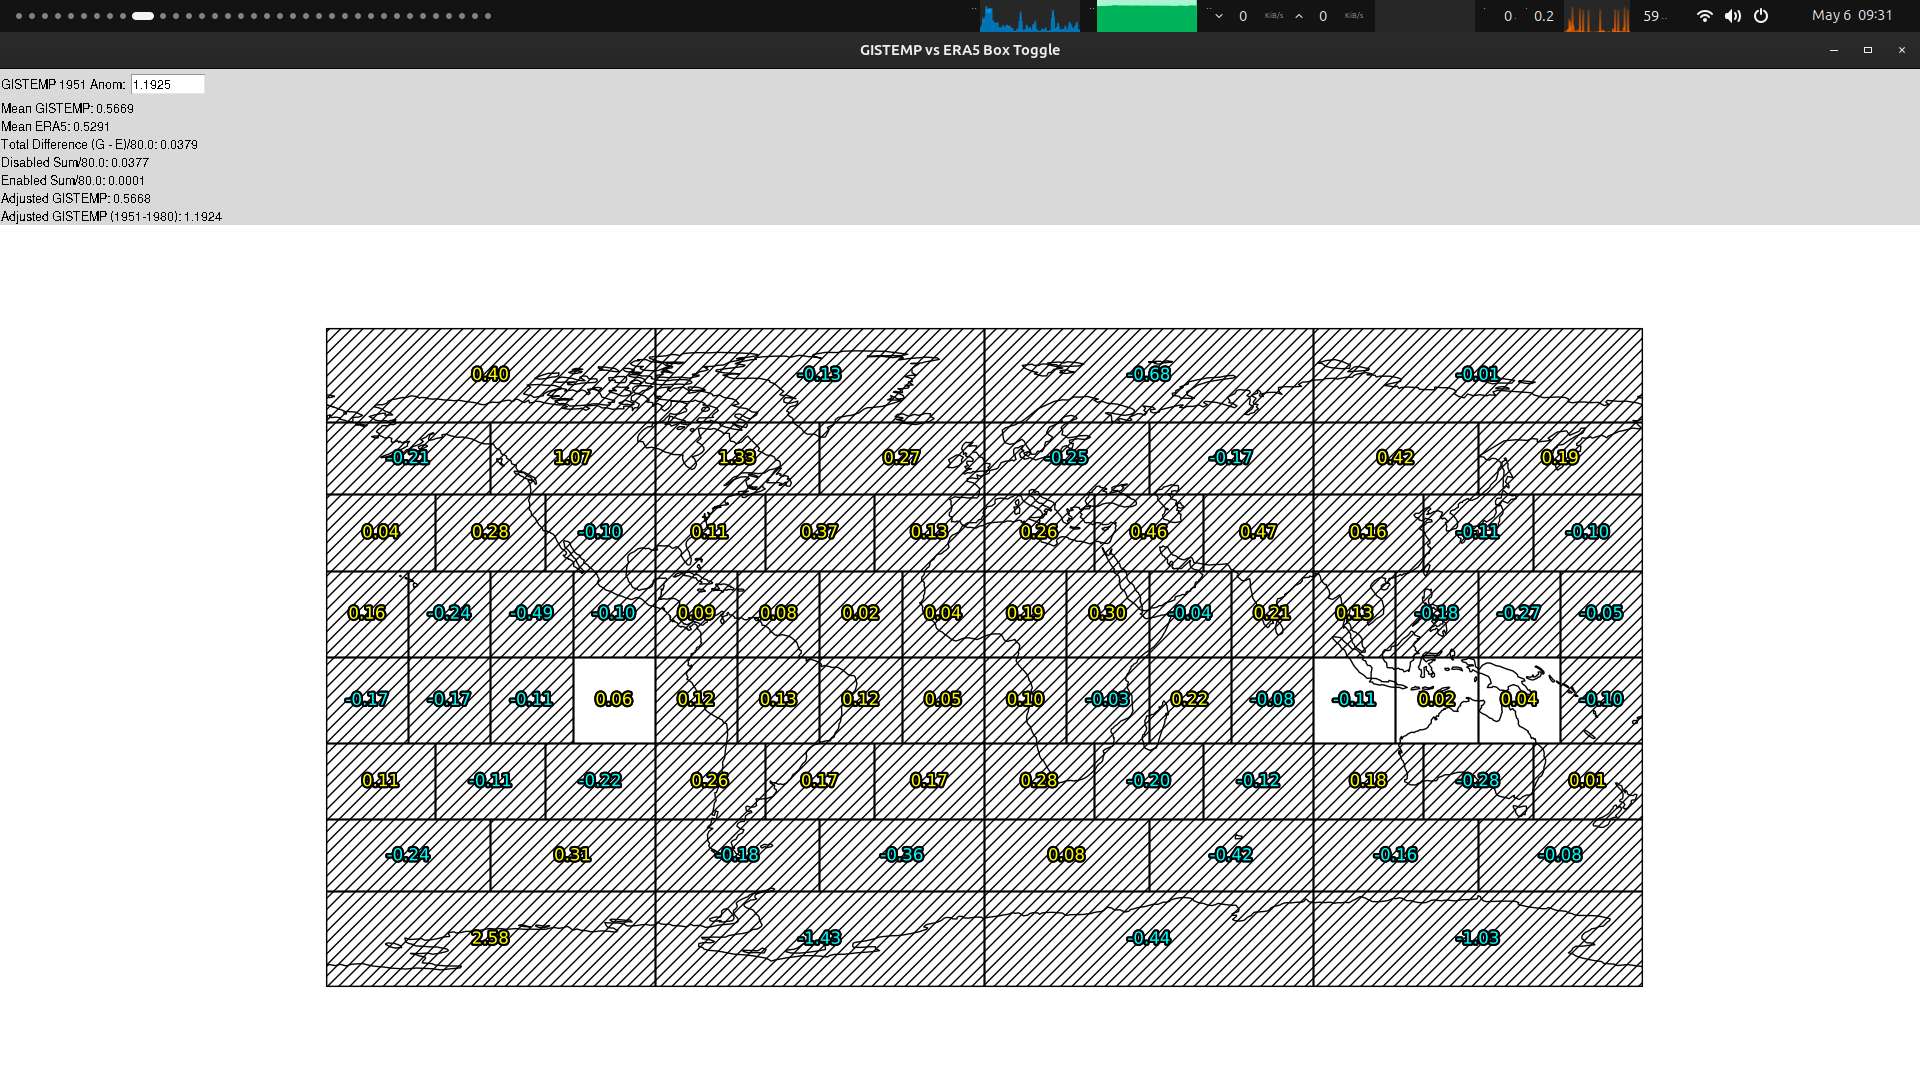
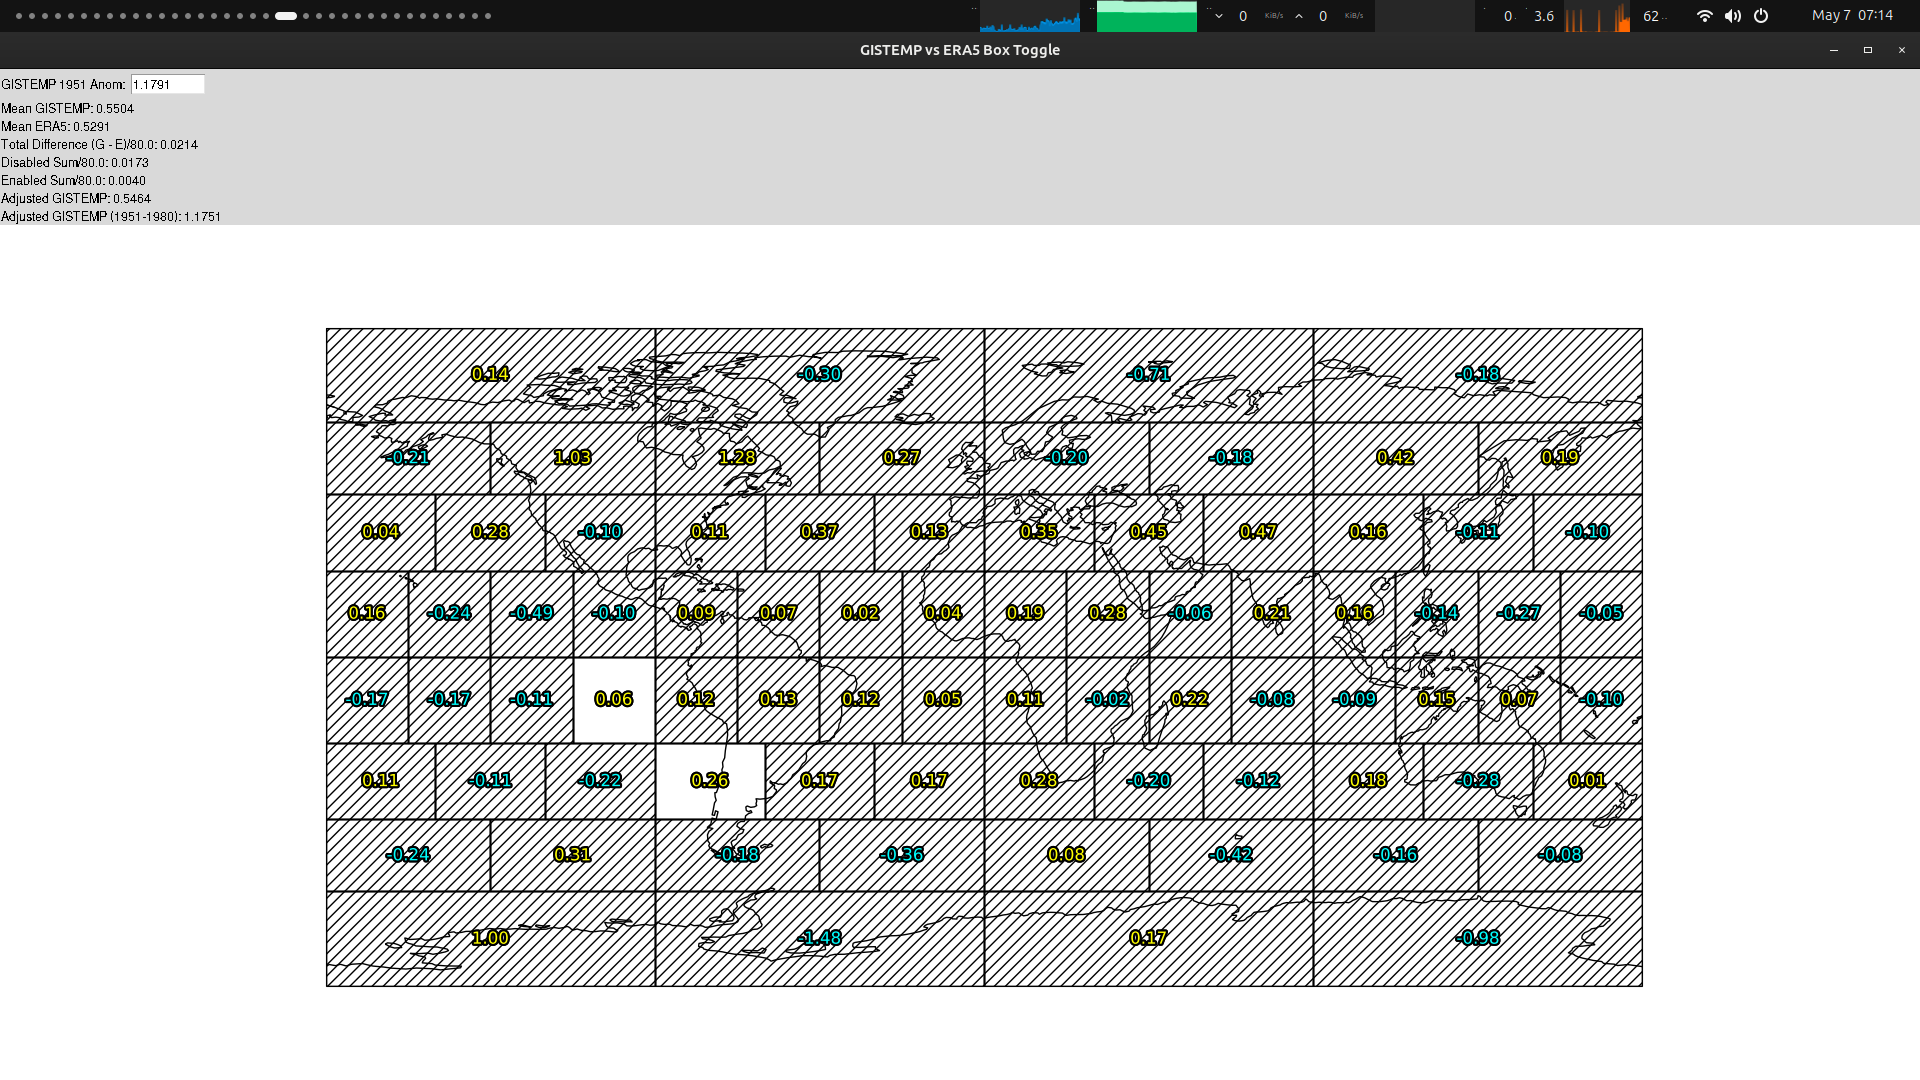
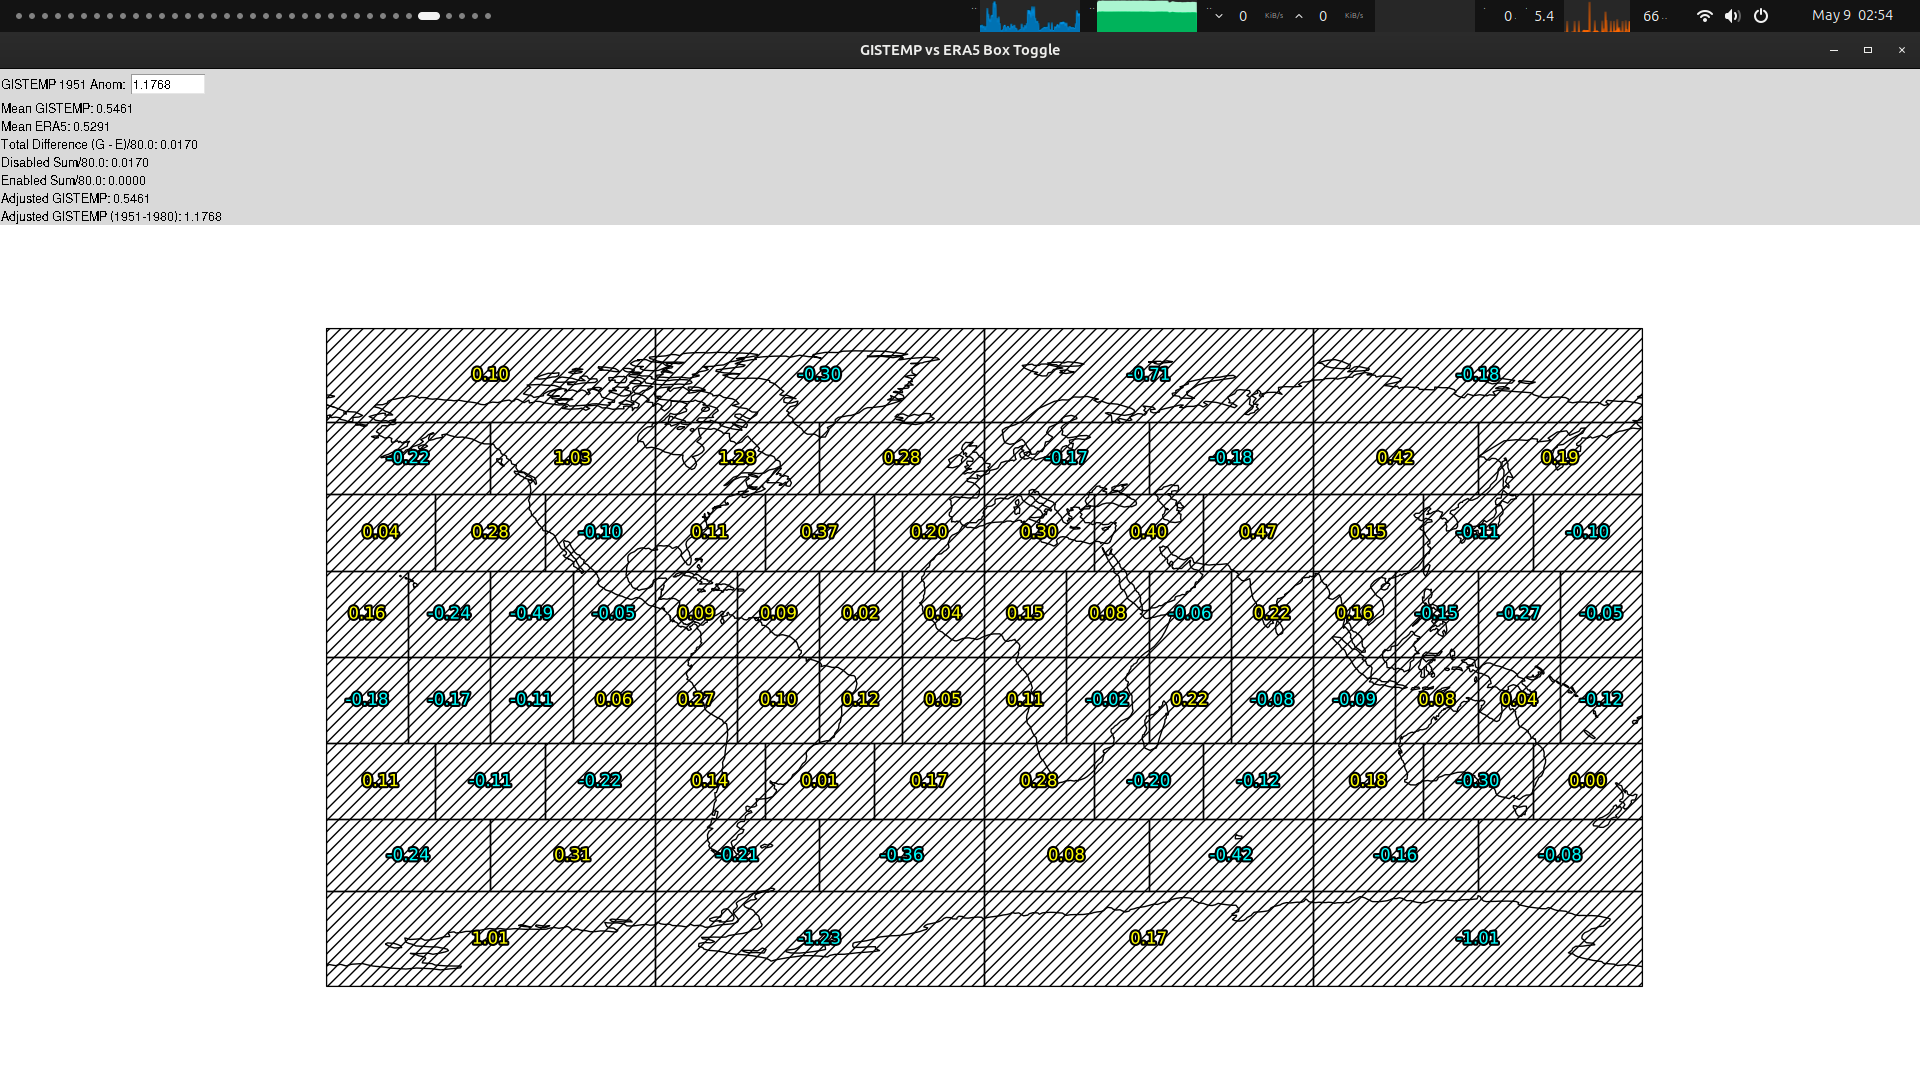
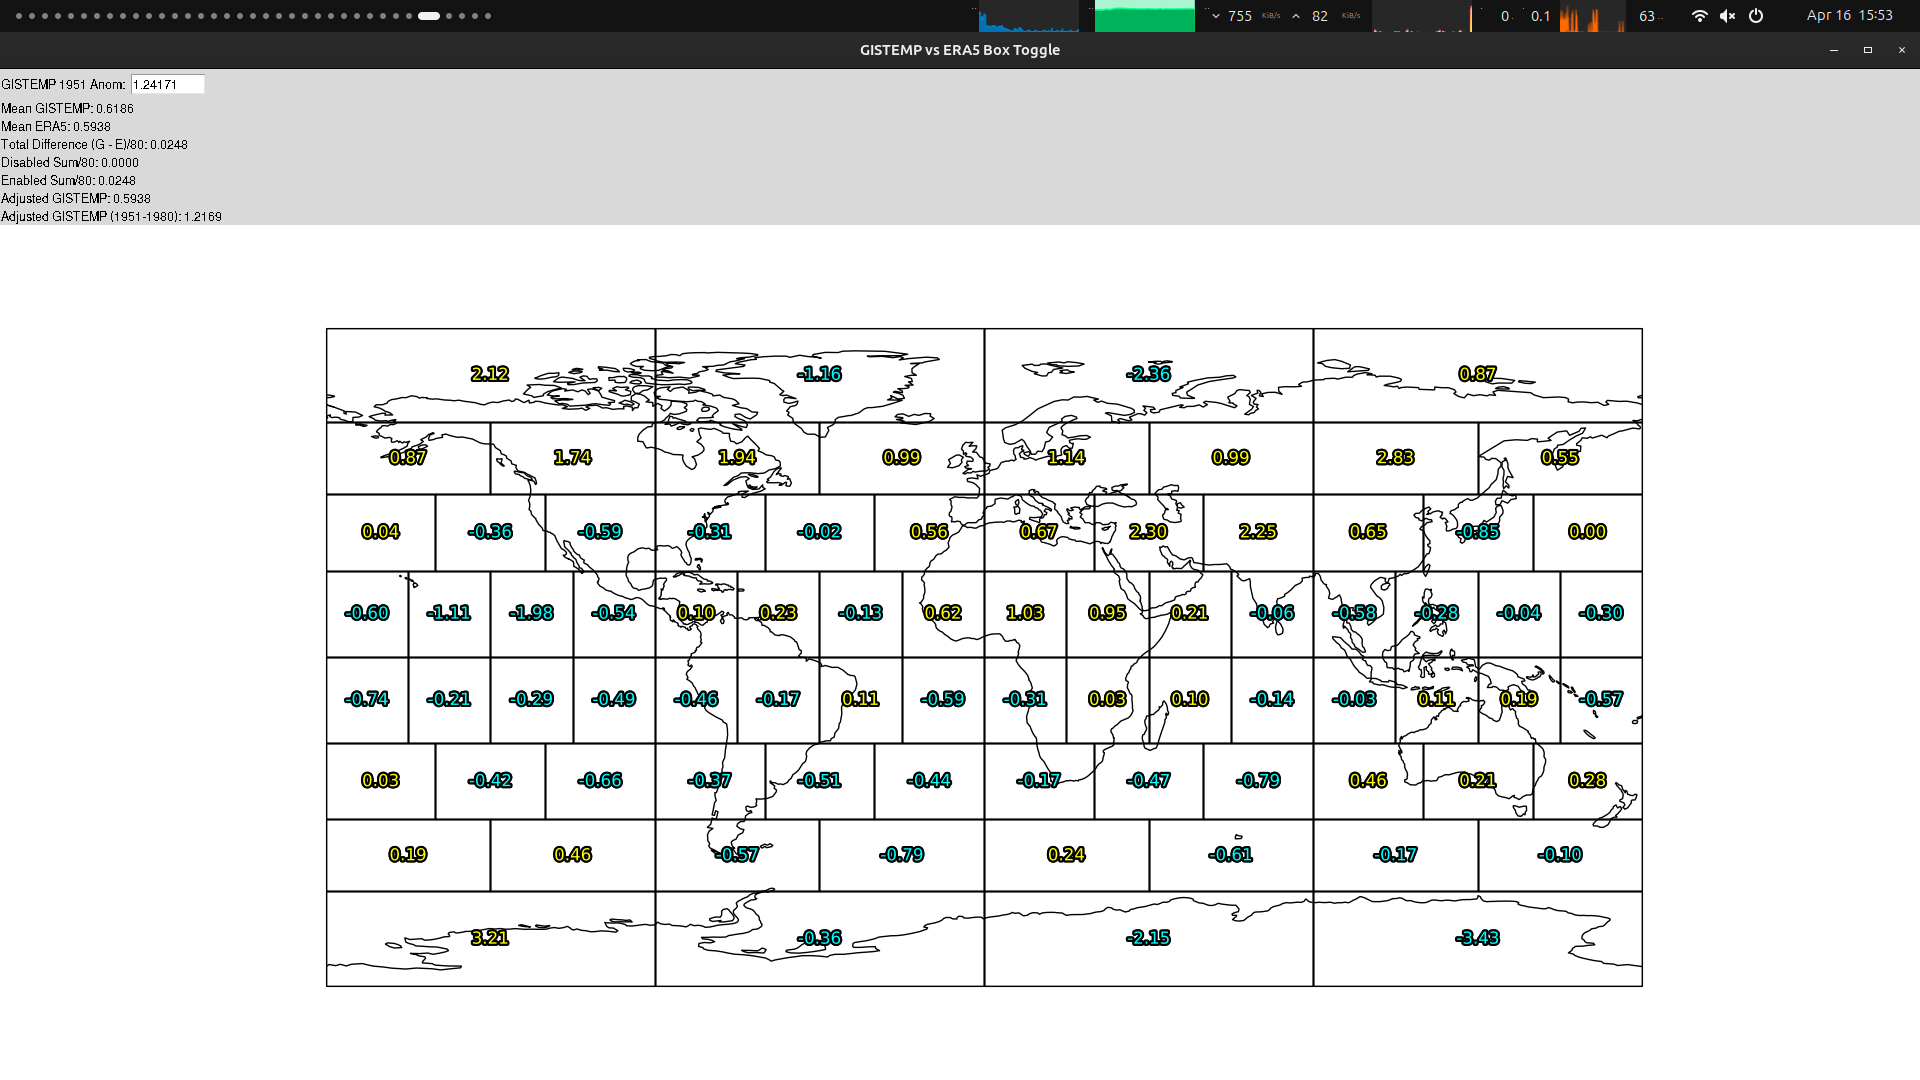
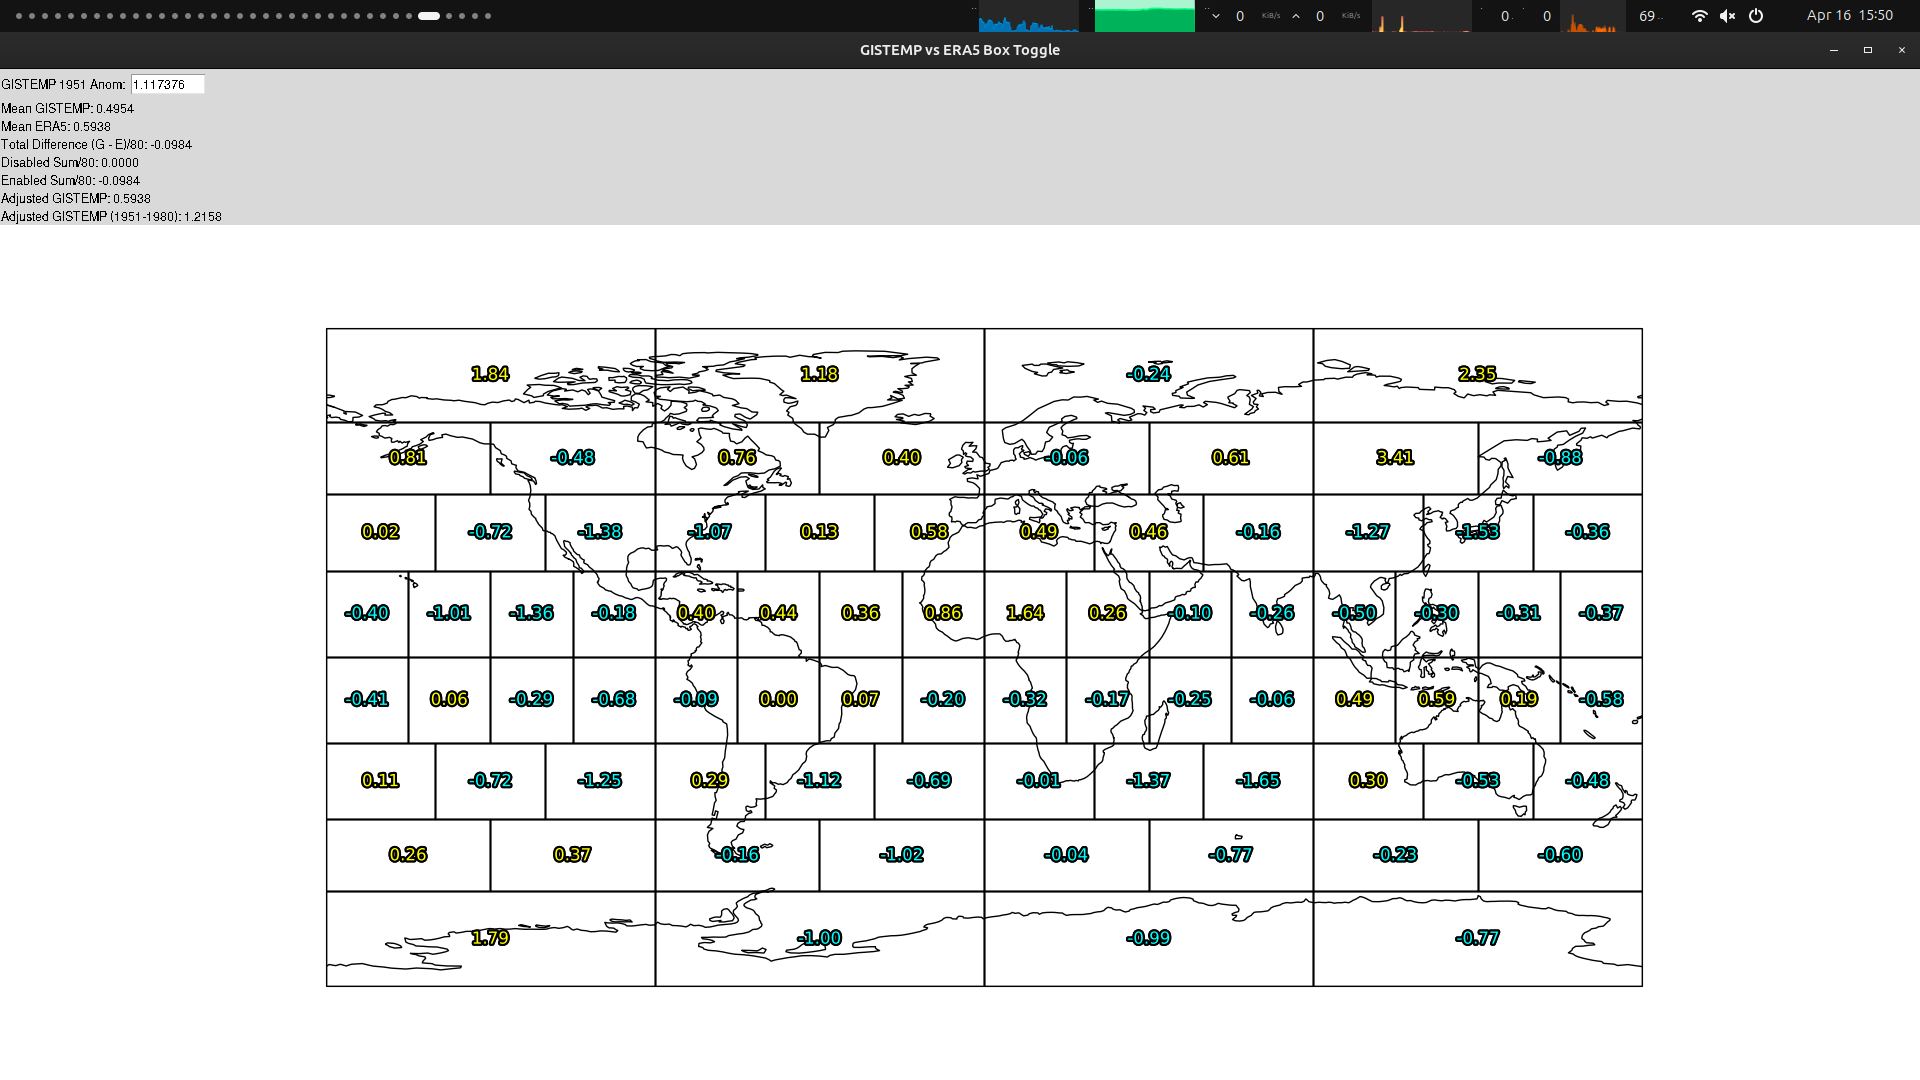
Reference case below starts off at 1.219 C from what is largely missing data, but excluding what I think are the largest variables left: the 3 Canada boxes, the Greenland box, and one of the Antarctica boxes which doesn't look filled in appropriately I'd guess (with the assumption all other boxes that are enabled being subject to further significant change when data comes in following similar to ERA5 )
Adding the Canada and Greenland deltas from ERA5 it drops it down to 1.129 C (-0.090 C) (in particular I don't think Greenland wlll drop anywhere near that far).
Adding the last Antarctica box raises it to 1.153 C (+0.024 C) (conversely I doubt the raise will be that substantial from additional land stations from that single box as the extremes aren't usually represented to such a degree when most of the anomaly as shown from the ERA5 is over the ocean areas).
So if we get half of the anomaly drop from Canada+Greenland and half of the raise from that Antarctica single box that makes for a change of 0.5 * (-0.090 + 0.024) = -0.033 from the reference of 1.219 C, to a guess of 1.186 C, using this ad-hoc method, and assuming all the other boxes that have almost no data or I judge poorly are infilled follow the ERA5 deltas.
This is a lot smaller drop than I'd expect subjectively from this point judging visually but this is why I am experimenting with this ad-hoc guessing.
Given we have merely 48% coverage I haven't updated too strongly towards 1.15-1.20 bin given my earlier priors from ERA5 model earlier.

ghcnm.v4.0.1.20260504:
119.12
~
We got quite a bit more data last night.
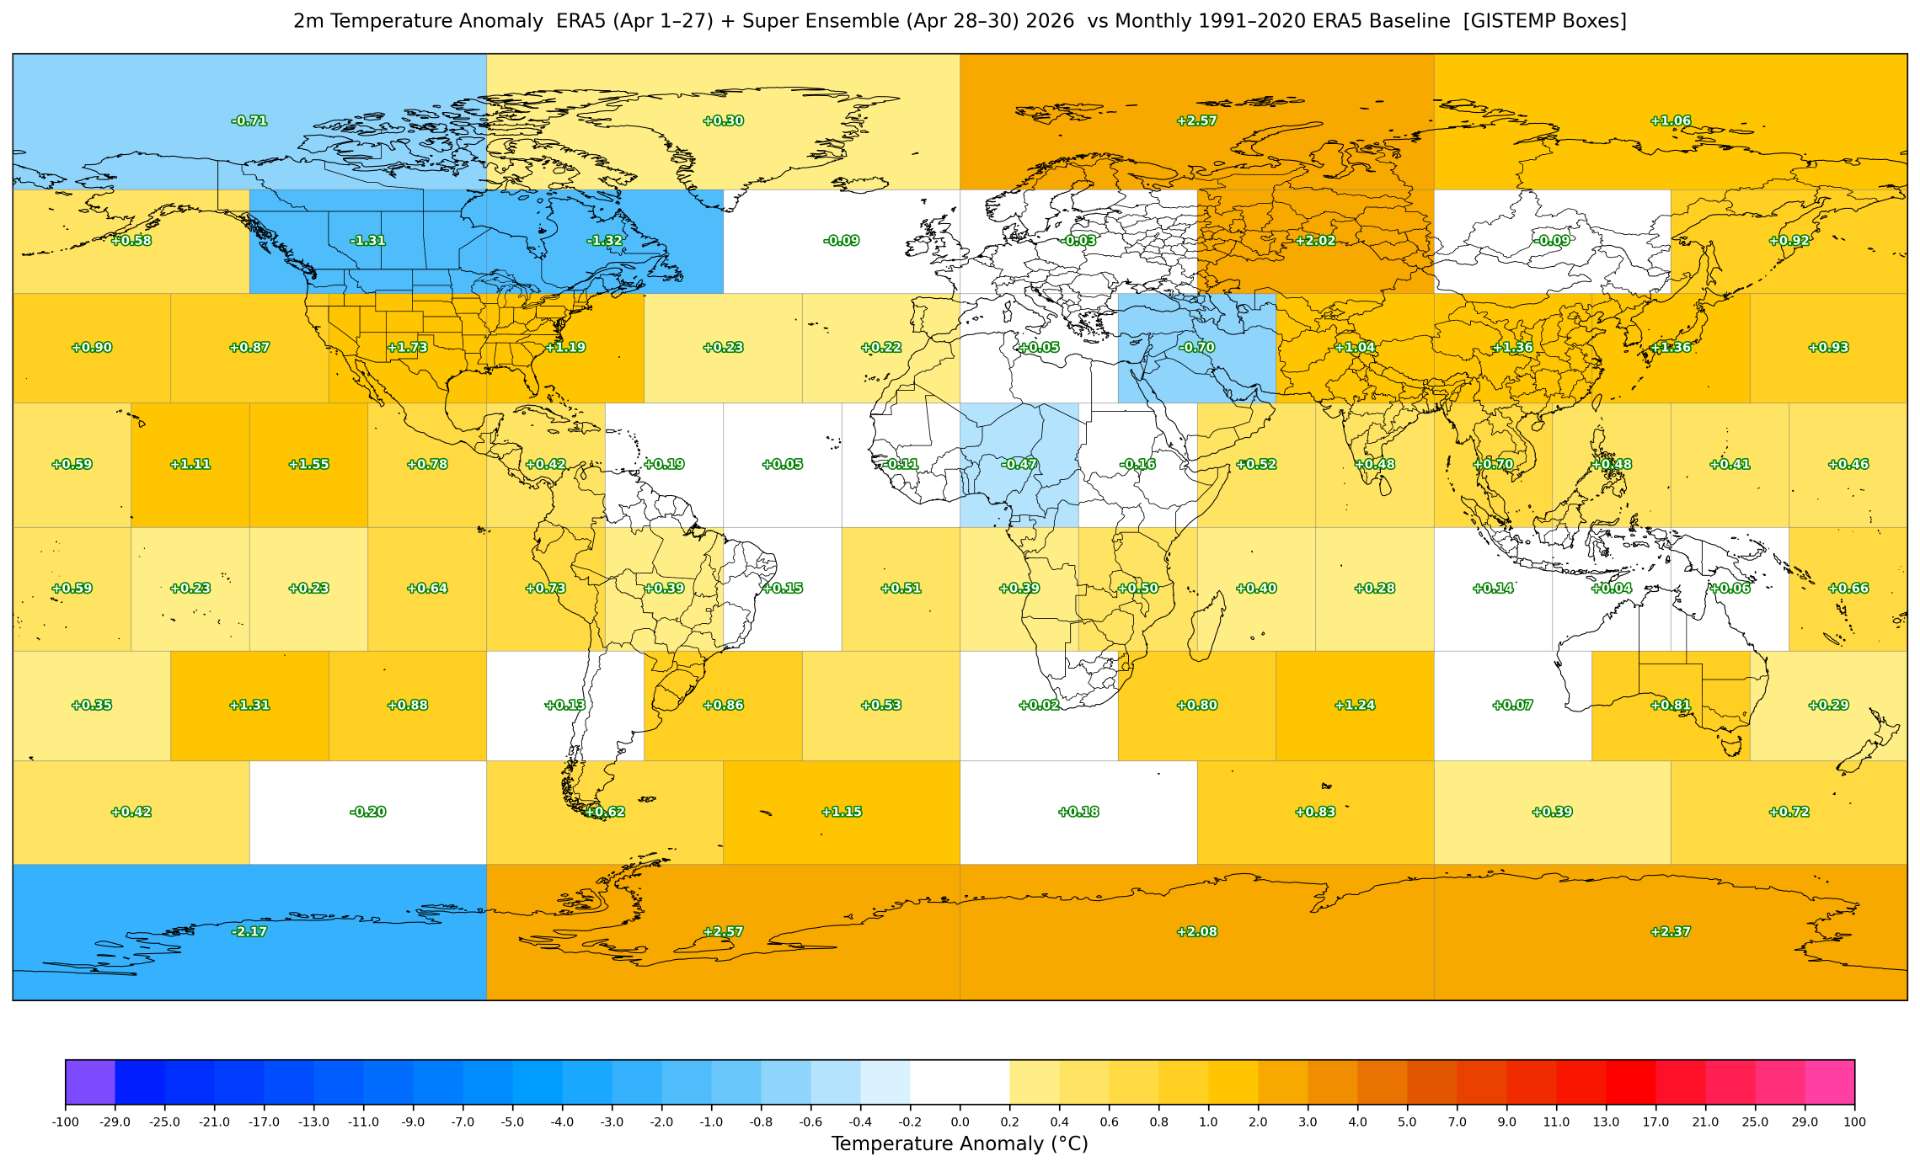
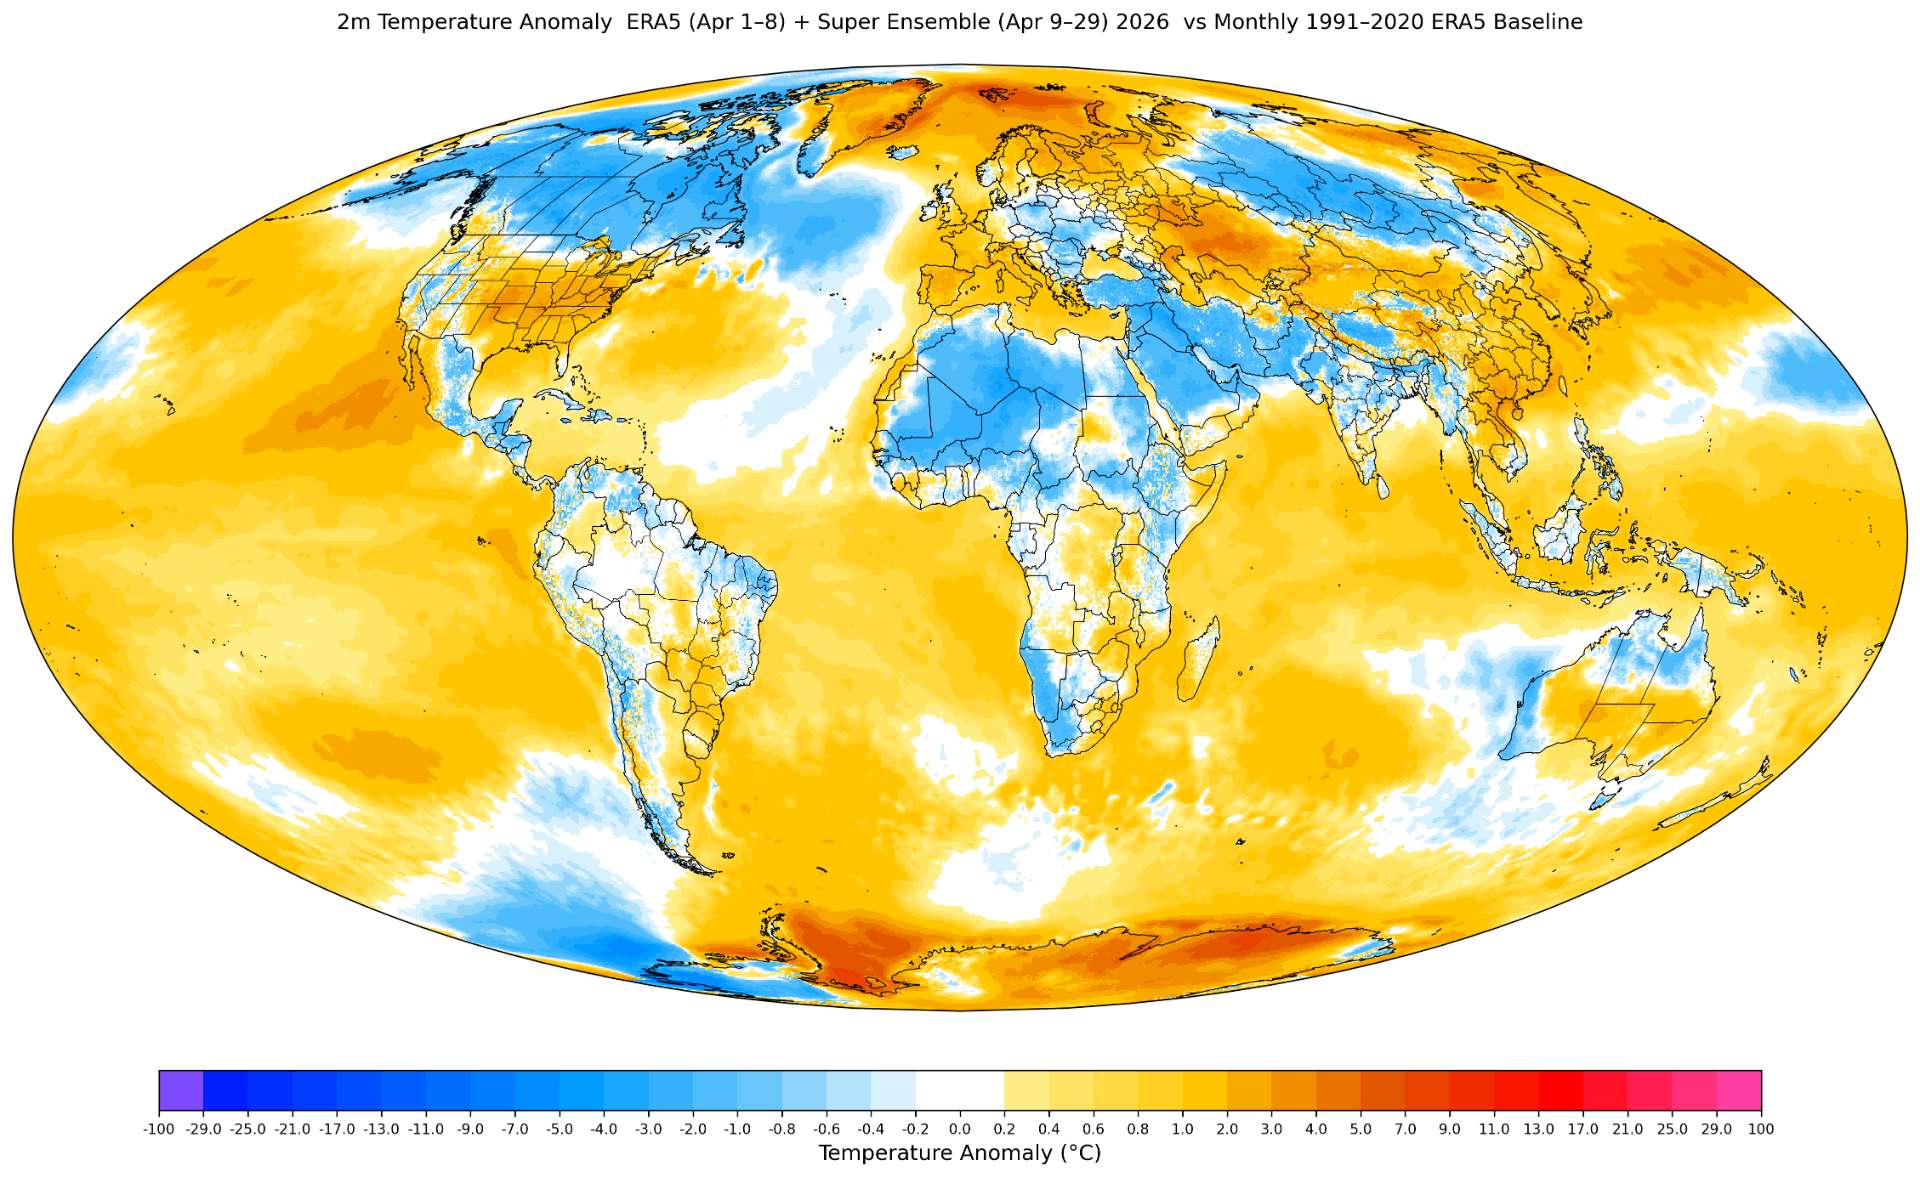
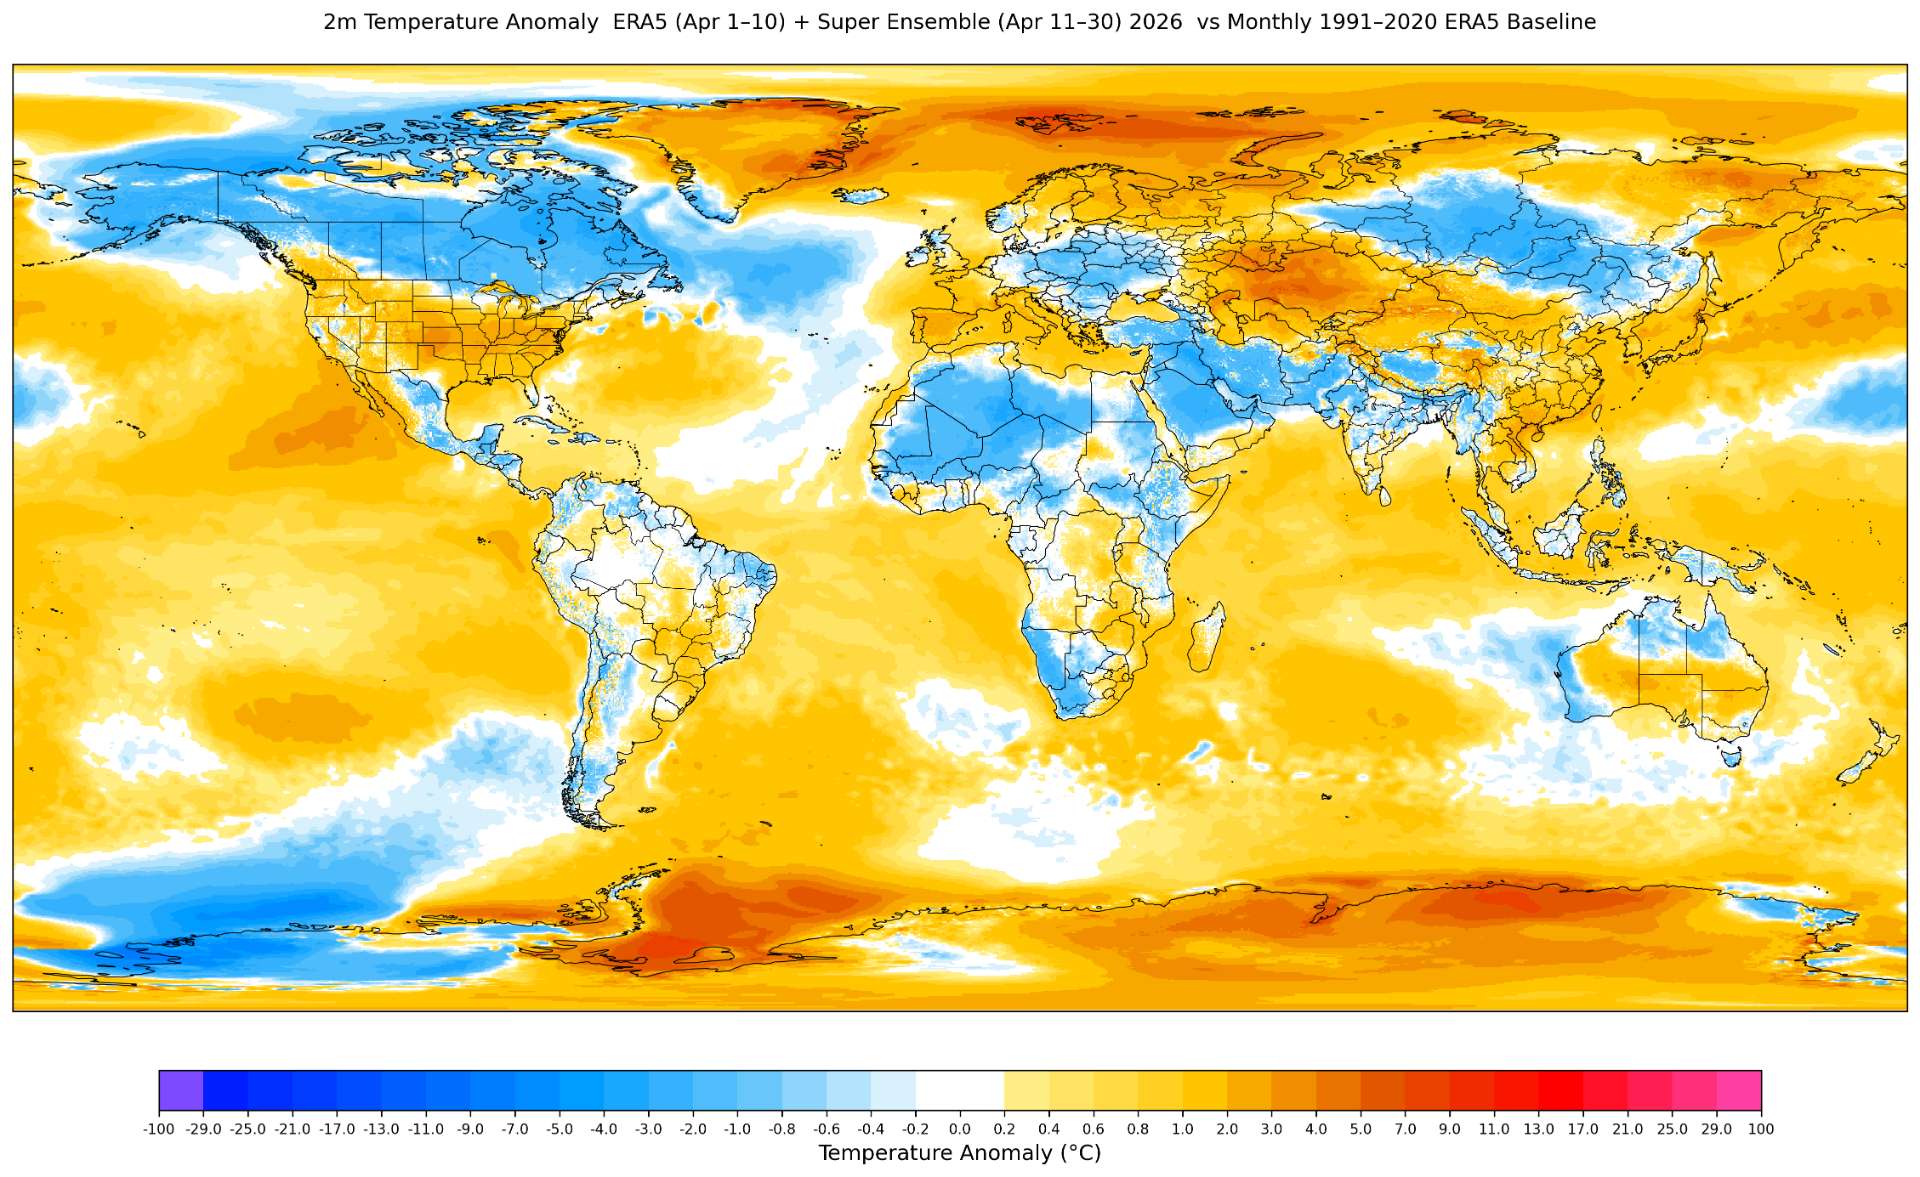
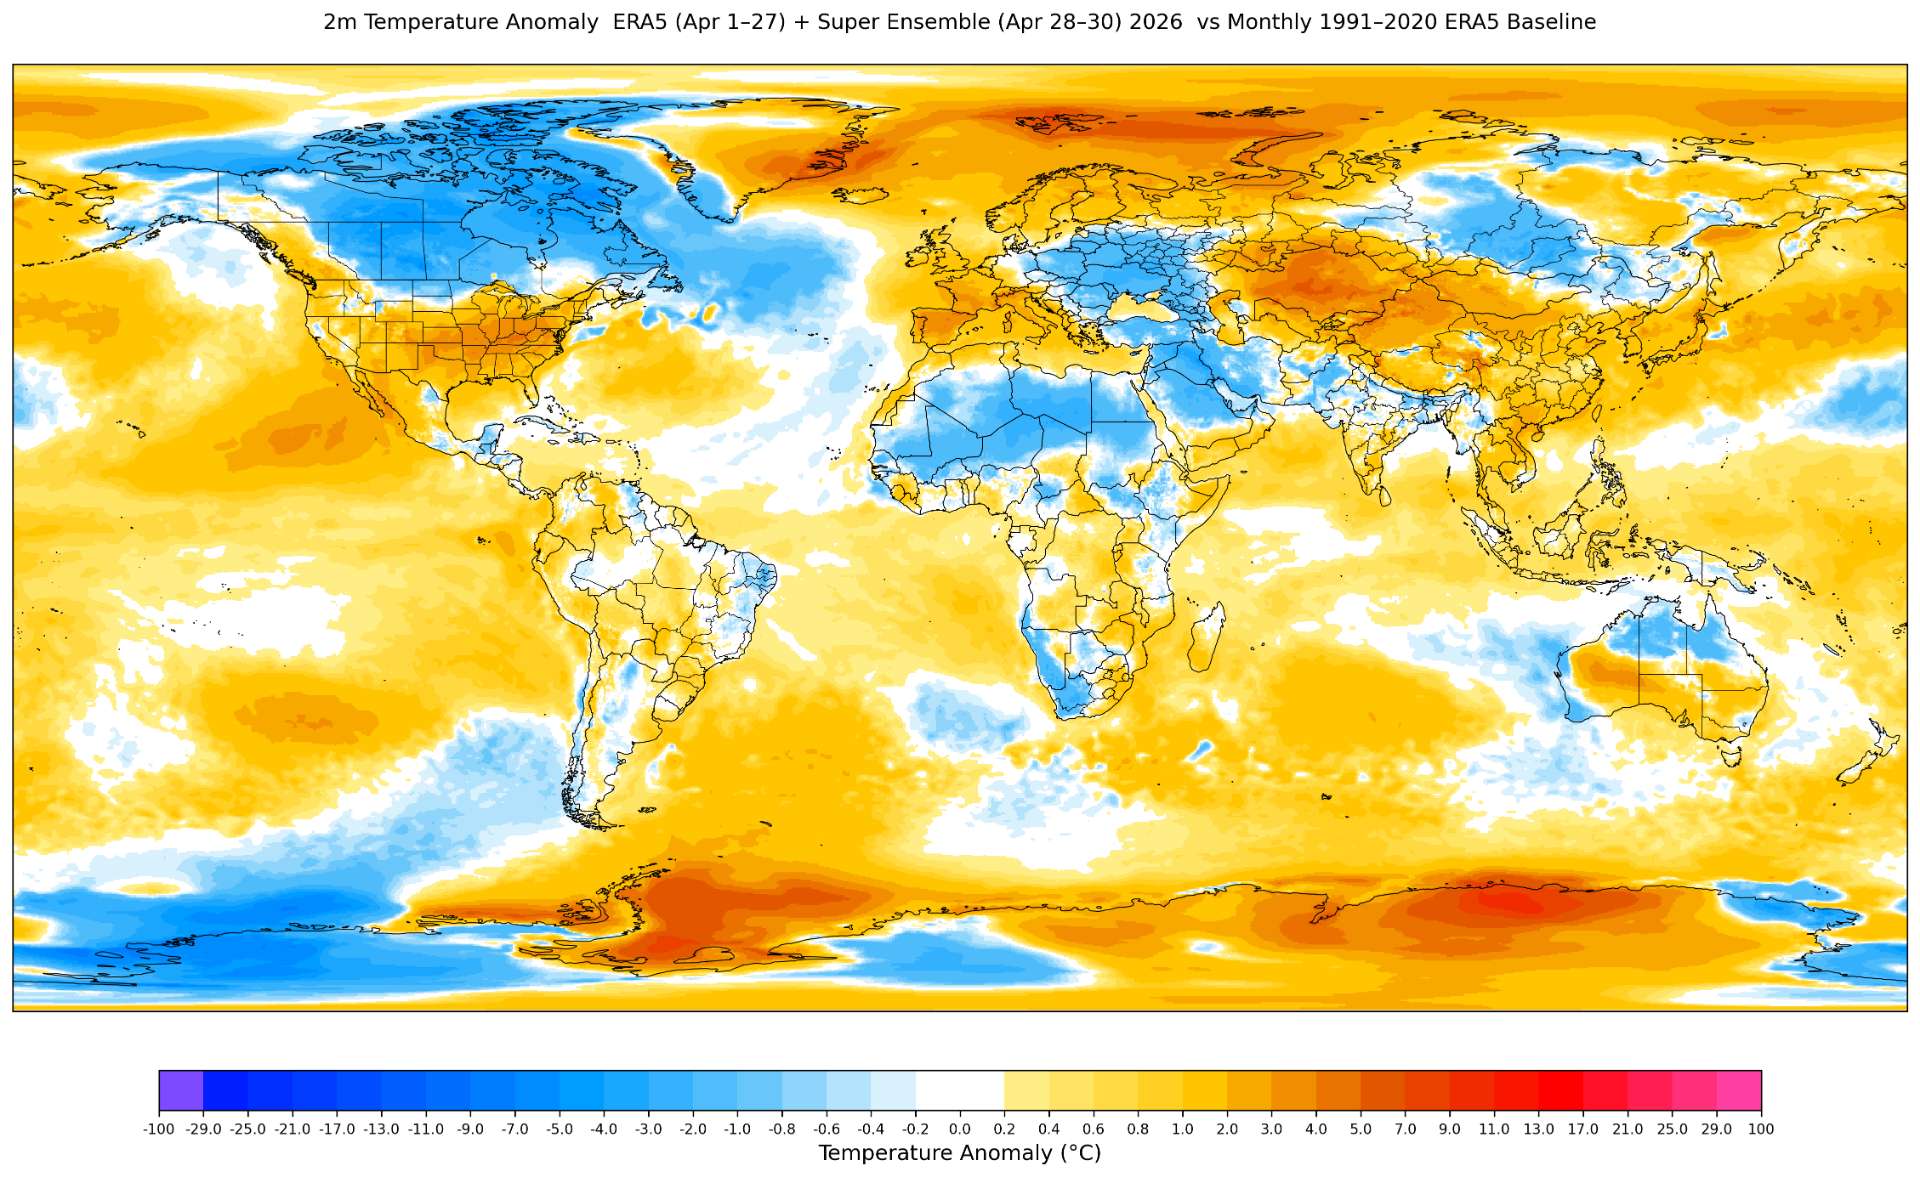
ERA5 interpolated to subboxes for reference (only last day is from super ensemble):
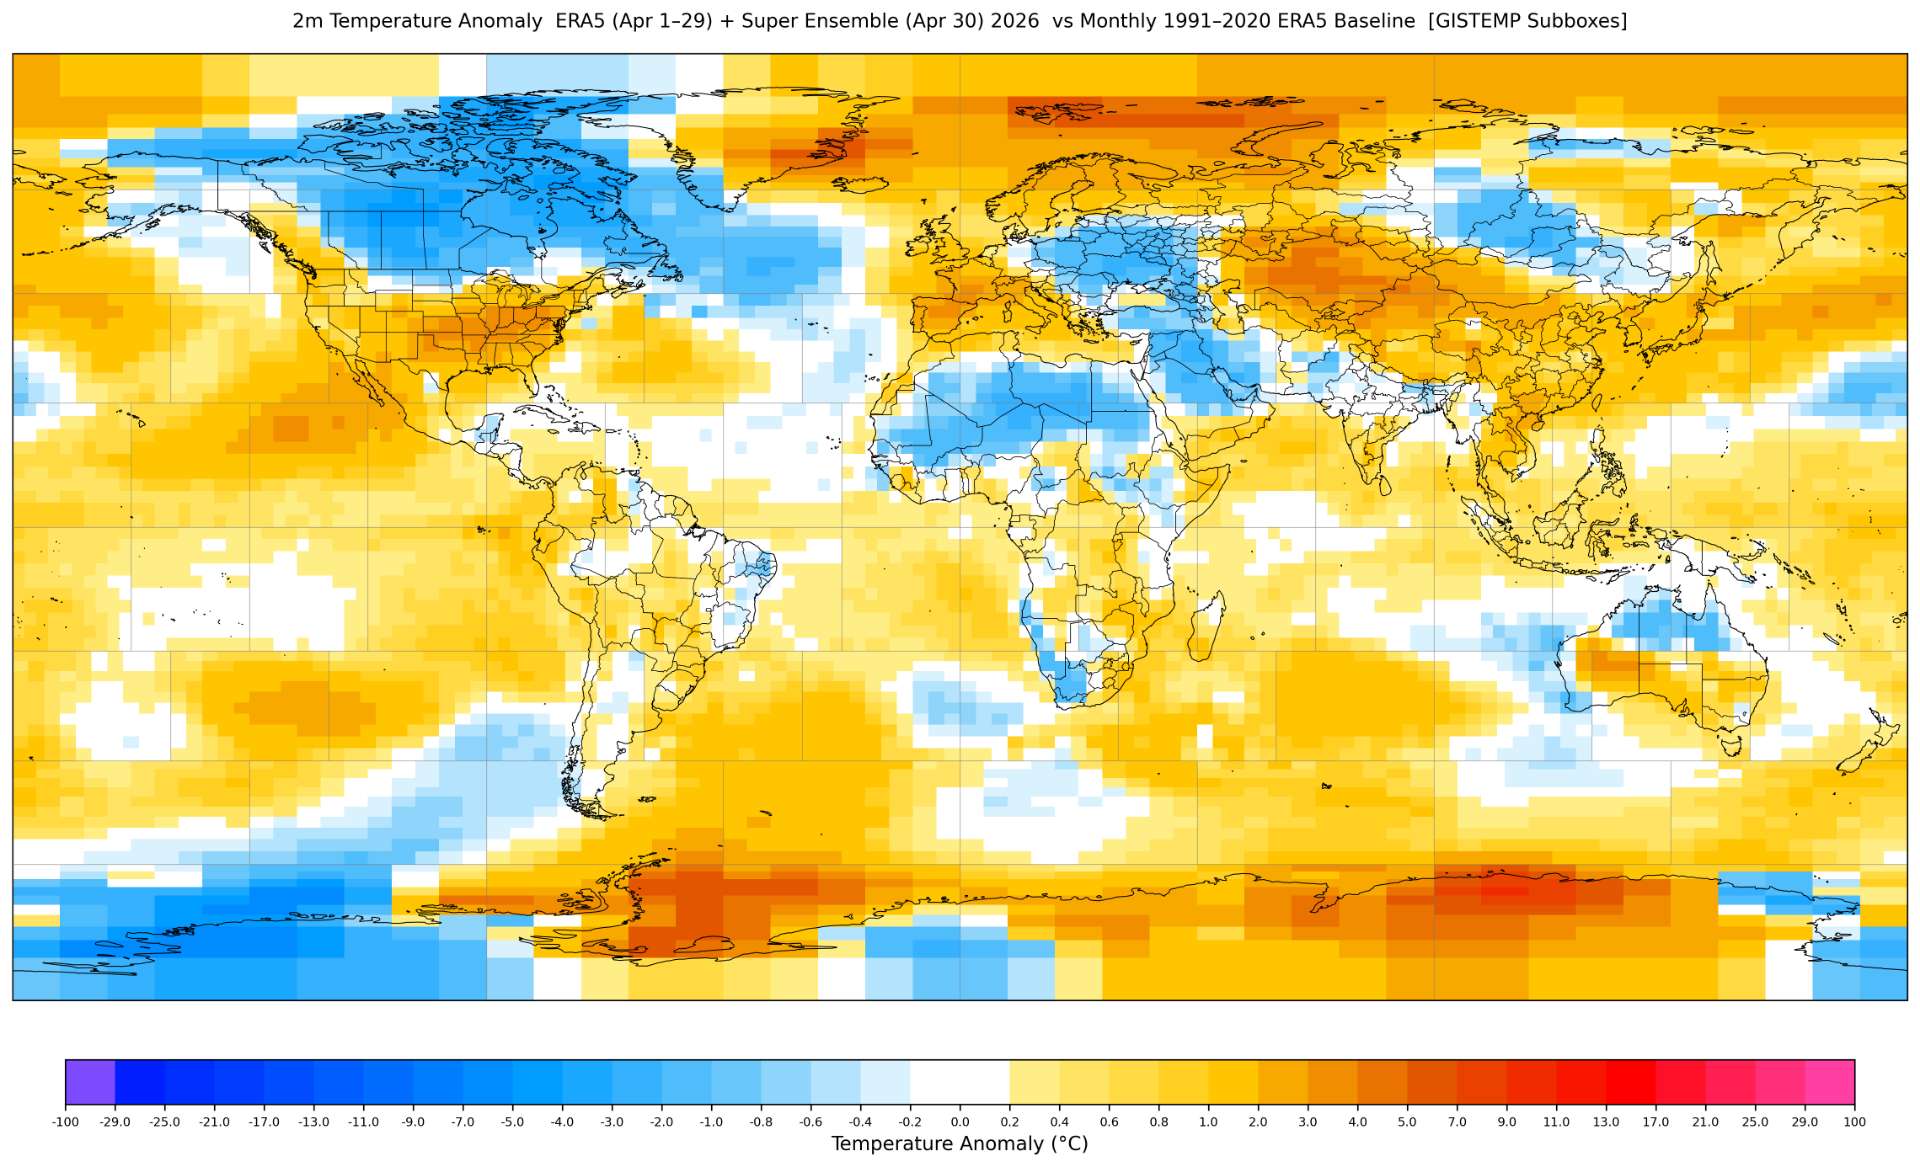
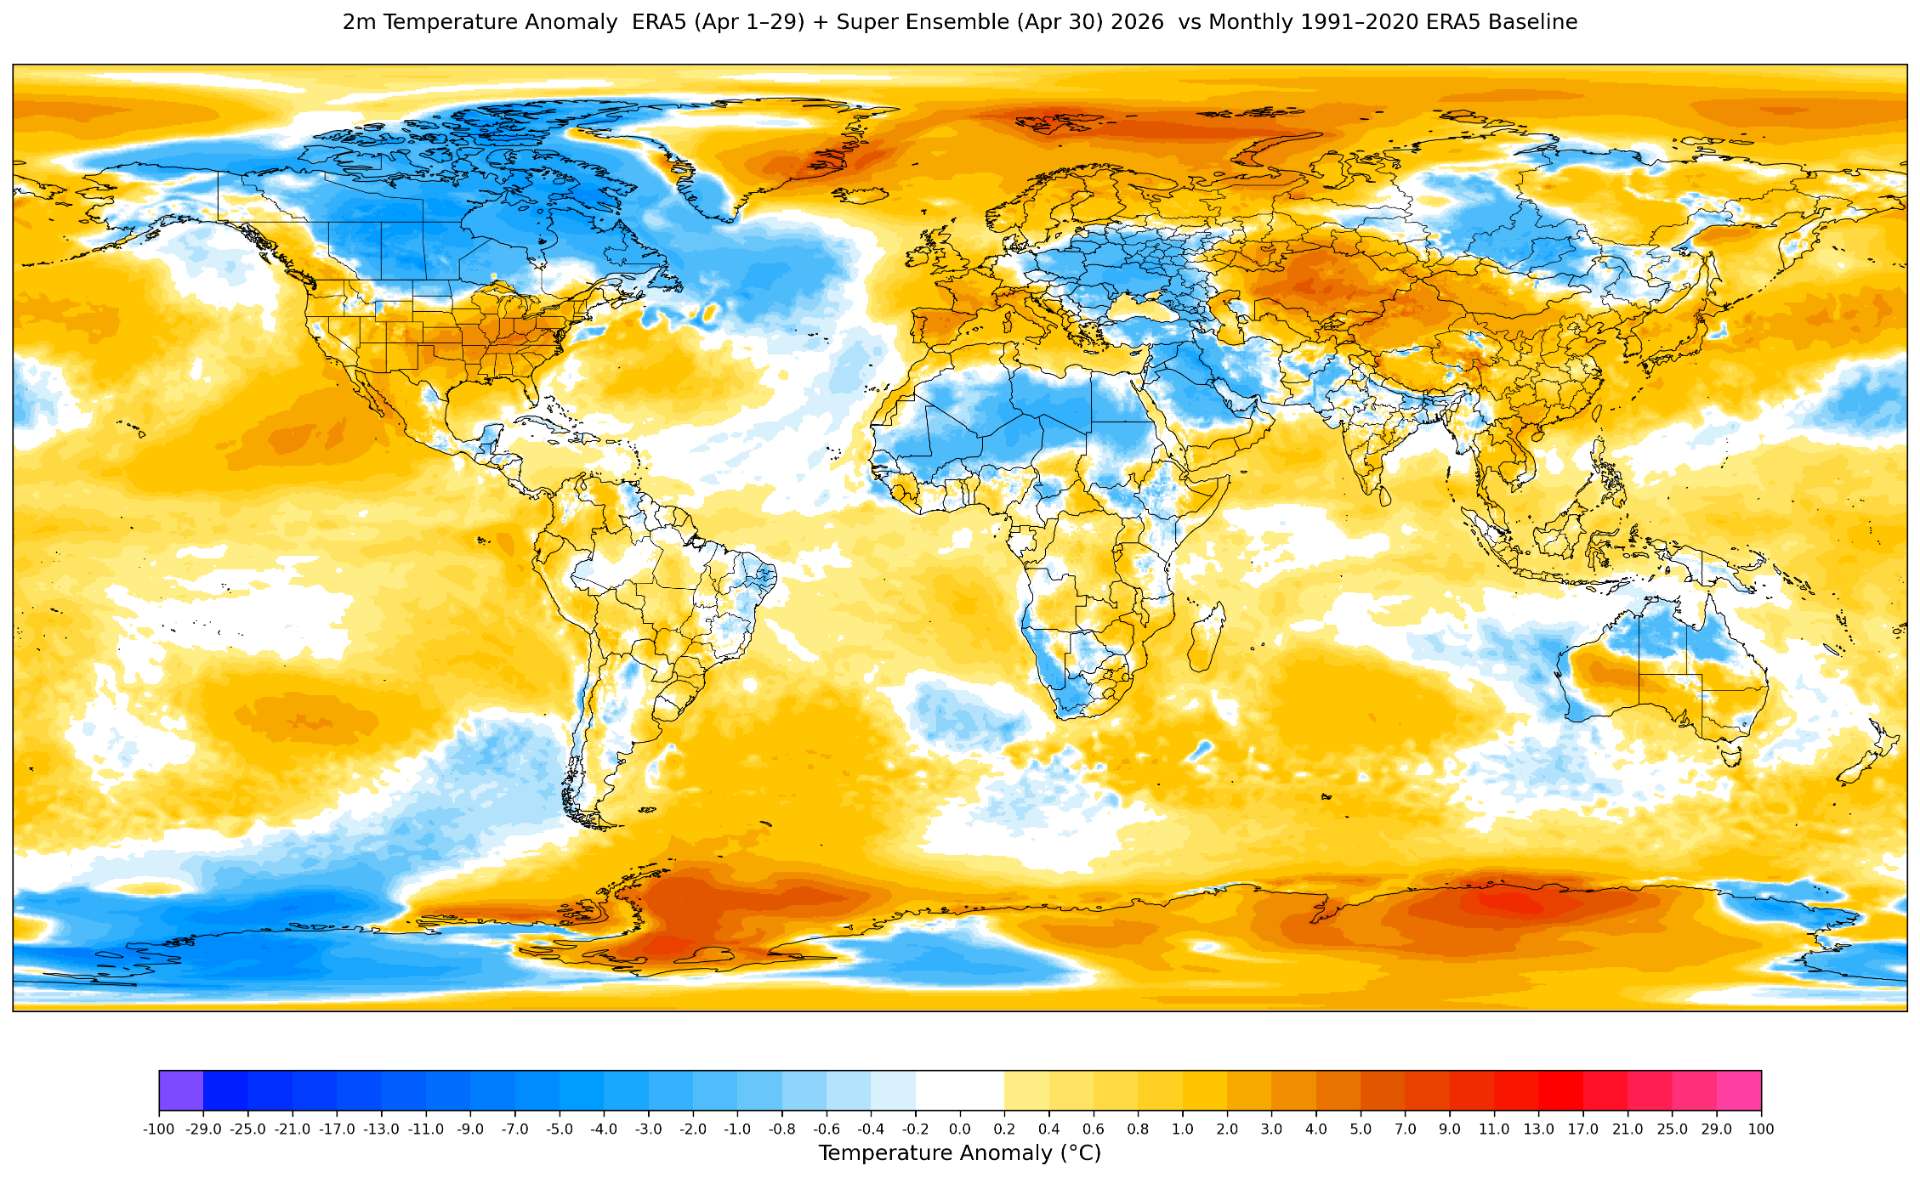
I referenced the above images and the past images from the station plotter I use (especially last month) for the below analysis:
~
Now that most of Canada came in (not expecting additional stations to change it much) the deltas from those three boxes are reduced to the neighborhood of what was expected yesterday (about 57% of the deltas from yesterday); the Greenland box also flipped (infilled from Canada) but is now likely biased cool absent its data.
Given the release date is on a Monday (the 11th) they will probably do the run&analysis at the earliest on the Friday before (May 8), meaning they will use the ghcnm run from Thursday night (labeled 20260407) (although there is no reason I'm aware of that they couldn't do it on the weekend, a day later or two). Last month was a bit unexpected that they used the same day of the month for ghcnm (20260307) which didn't feature Greenland or Mexico data and was missing central Africa.
This month we have more preliminary data in advance, but still leaves the combination of Antarctica (Elizabeth, which per ERA5 is expected to be in the -3 to -4 C anomaly range based in 1991-2020) and Greenland (which is slightly biased cold actually now) as the largest variables. The bottom left Antarctica box we don't have station data for yet but it will cool (although not as much as ERA5 suggests) once we get Elizabeth (which we got last month and a few more). The other three Antarctica boxes have fairly decent coverage now (some stations missing that we should expect) but I do not anticipate a significant change.
These are the boxes that I think are liable to change. I have included the box for Egypt but not for Rwanda/Uganda because regardless of whether we get Rwanda/Uganda the box looks fairly appropriately filled in based on ERA5 (the difference is small anyway), but Egypt looks cooler than Saudia Arabia in ERA5 so it will have an outsized effect on the subboxes further away in central Africa absent Rwanda/Uganda data.
We have also a smattering of Australia stations (Northern Australia in particular looks like it is biased warm at the moment with the lack of stations there so I've included preferentially those boxes).
Given the drop to 1.1654 (1.1912 - 1.1654 = 0.0258) with the below boxes, I have been accustomed to expect quite a bit less than the ERA5 implied deltas, so taking half of that 1.1912 - (0.5 * 0.0258) = 1.1783 ~= 1.18 C
Notably, absent Elizabeth or nearby stations this raises to 1.1977C ~= 1.20C
Out of the 6 records (last 6 months) for the same expected day as the run date (8th of the month), in 1 out of the 6 we had no data for that area (similarly for days after it up to the 11th) -- this was for the data for January 2026 in the ghcnm versions for February.
So alone, this gives me up to a 16% chance of it ending up in a higher bin temporarily if we don't get Elizabeth -- I say up to since without Elizabeth it goes to 1.1977, which is close to the bin edge and there is enough error in my analysis and variability in the data that it then becomes nearly 50/50 conditioned on this happening -- so that 16% should be treated more like 8-10% perhaps for the 1.20-1.25 bin (especially on the lower side if we don't get Greenland).
Subjectively, then, based on the box deltas, I'd now then put the lower 1.10-1.15 bin based on this at <5%. That leaves about 80-85% for the main bin (1.15 - 1.20). I'm increasing my YES in it based on this calculation, and increasing also my YES in the higher bin (1.20-1.25) based on the small chance we don't get Elizabeth or nearby stations.
Edit: Forgot to paste the gistemp value and usual reference images/data..
ghcnm.v4.0.1.20260505
119.249

plots of gistemp related data:
ERA5 (now complete),

interpolated to GISTEMP subboxes/boxes
Got Egypt and Greenland now. More Australia and Canada stations (Australia looks good enough now).
Still no Elizabeth; Of the last 6 records, 4 already had it by now, and 2 did not, with 1 of the 2 being available for the 8th (the expected run date), so at worst that leaves a chance of 50% of it not coming in (splitting the difference between the two different ways of sampling leaves a 33% chance of not getting Elizabeth by May 8th).
This leaves me to contemplate the lower probability scenarios where we remain close to the bin edge...
Previously I considered the other 3 Antarctica boxes as mostly well filled in but it's possible it's significant enough in the scenario where Elizabeth doesn't come in. So below I consider rather than a 50% change in the delta, perhaps up to a 20% change in the delta for those 3 boxes as a whole given how much data there already is. It's harder to say the chances of getting the data though since it will be more irregular on a case by case basis (but I'd say a chance of up to 50% we get more stations to have a small change is reasonable; still just very roughly guessing based on cycling through these few records).
Re-evaluating what's left aside from Antarctica though is almost all cooling boxes. I've added one of the Argentina boxes (we don't have Chile either), which I neglected previously; looking at the sampling I do think it could cool a tiny bit (not even the 50% of the delta though); for this analysis I'd guess less given the number of stations and the ocean box overlap, so, again maybe 20% of the delta (mostly just subjectively guessing). I do expect to get more Argentina stations and possibly Chile as well since in the last 6 months we've always gotten them for the run on the 8th (so >90%).
So that leaves the following as the reference case: (1.1924)
Chile, Antarctica left most box, and other 3 Antarctica 3 boxes (highlighted below):
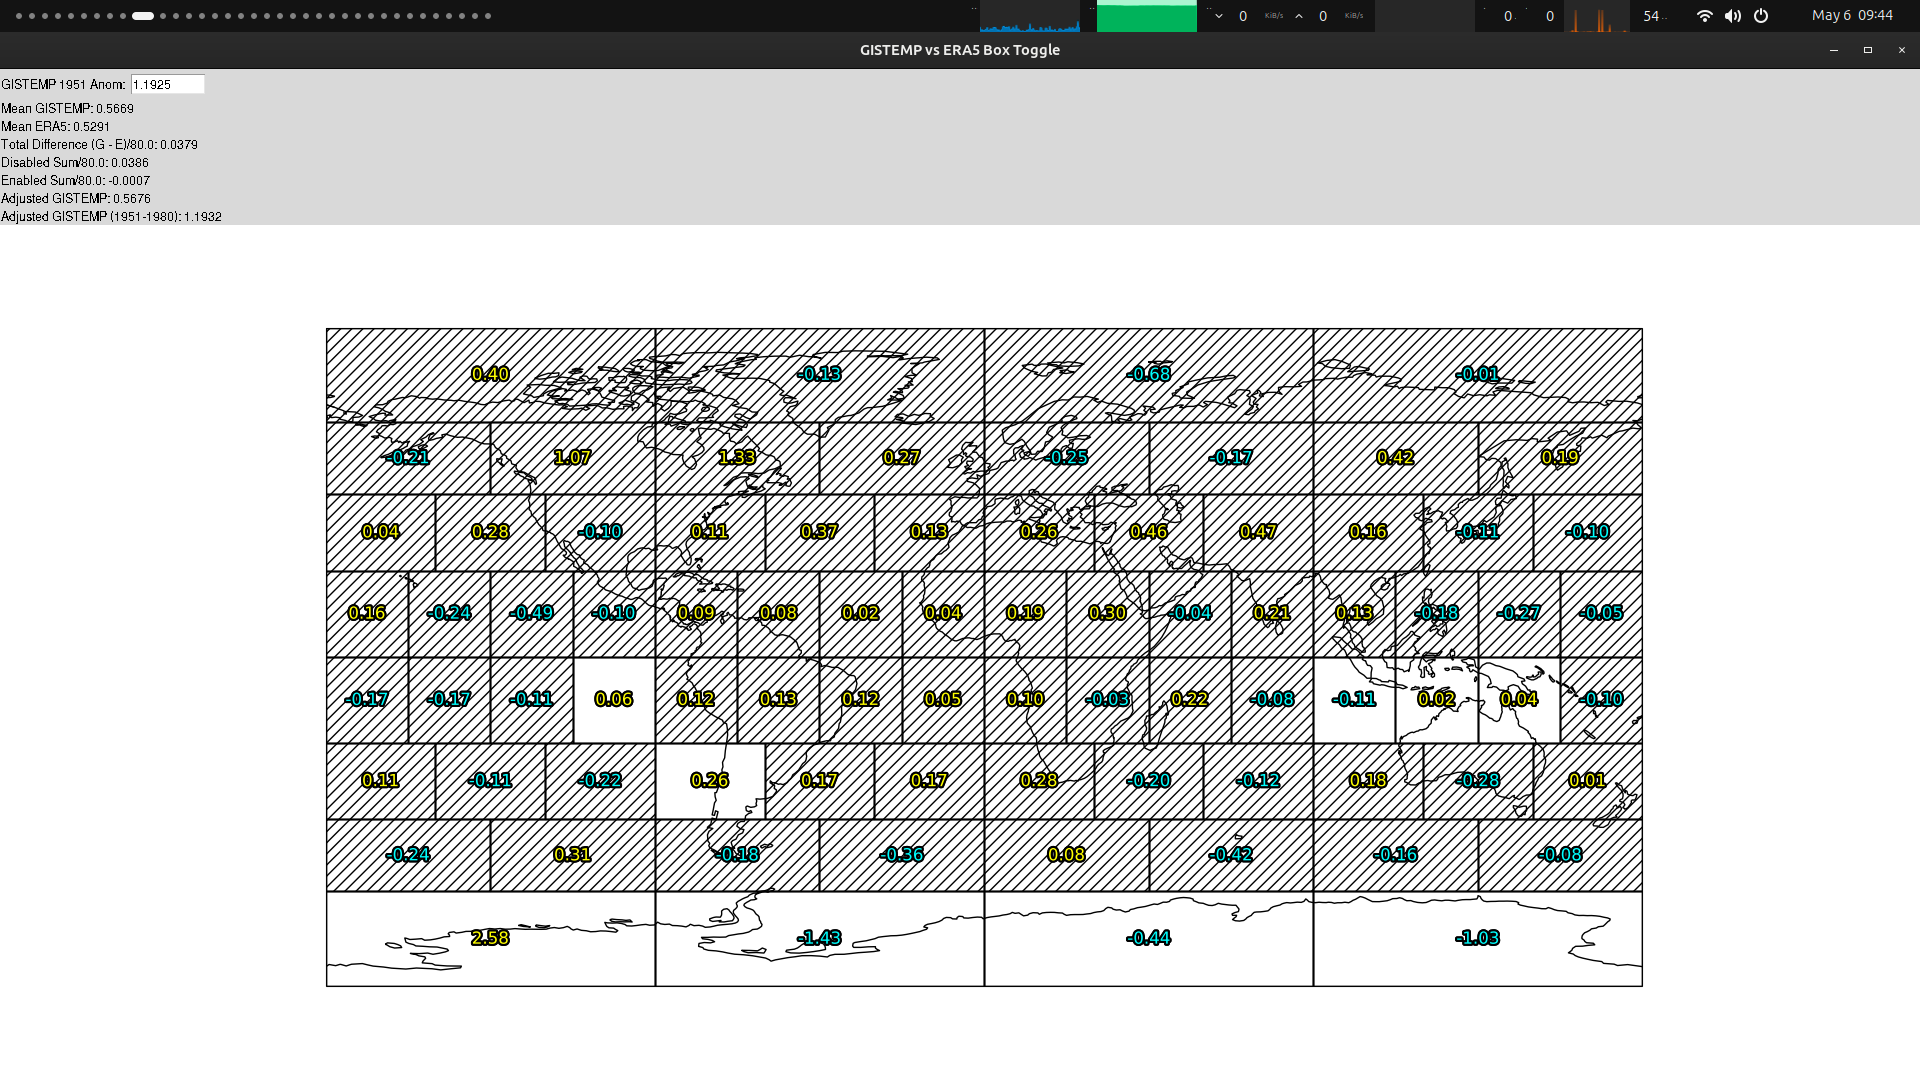
expected value of each of the scenarios separately ( (Chance we get the data * Expected % change of the ERA5 delta * the delta * box contribution)):
cooling (Argentina): 0.9 * ( 0.2 * -0.26 * 1/80 ) ~= -0.001
cooling (Antarctica left box): 0.33 * ( 0.5 * -2.58 * 1/80 ) ~= -0.005
warming (Antarctica, other 3 boxes) : 0.5 * (0.2 * (1.43 + 0.44 + 1.03) * 1/80) ~= +0.004
Considering only the Antarctica warming scenario, alone, we are again near the bin edge, and just past it (1.1964), so I consider this roughly a chance of 50/50 of us getting either bin conditional on we ending up in this scenario(slightly more chance for a higher bin). Considering if we get the warming + Argentina scenario, again we get ~1.1954 so again 50/50 conditioning on this scenario.
With all three happening, I think we are far enough from the bin edge then that it's >90% we end up in the 1.15-1.20 bin, and in the other scenarios without significant warming that leaves >95%.
That leaves 2/8 possible combinations as roughly 50% for either bin, one as 90% for 1.15-1.20, and the rest as least 95% for the 1.15-1.20.
0.5 * 2/8 + 0.1 * 1/8 + 0.05 * 1/8 ~= 14% for the 1.20-1.25 bin.
Taking the three as independent,
Suggesting 1.1924 - 0.002 = 1.1904 C
ghcnm.v4.0.1.20260506:
117.9077
Got Elizabeth so the left most Antarctica box is now better represented, and we also got more stations from the other 3 Antarctica boxes. So the largest variables are now gone and I don't predict any new updates until the release date that will significantly shift it into another bin.
It looks like it will end up being 1.18C and this is very close to what has been expected for most of the last 4 days.
We are still missing coverage in several places we usually get but they are mostly appropriately infilled at the moment (i.e.Mexico) while Australia we have a good enough sampling but less stations than last month. Still no Rwanda/Uganda but don't know if we will get it this month in time. None of these will likely shift significantly anyway regardless of their inclusion, per the deltas with ERA5.

ghcnm.v4.0.1.20260507:
117.73

For South America we got more Argentina stations (a couple previous ones were revised downwards), and also Peru.
More Europe stations also (Hungary, Spain, etc).
I do expect this is the version they will use (although its possible they could use a run over the weekend).
No single box sticks out as particularly biased that is at all likely to shift it enough further anyway: the largest ERA5 anomaly deltas are in Canada and Antarctica, and comparing against 2025 data looks like we essentially got all of the same Canada stations (and such a large collective revision downwards is exceedingly unlikely), and similarly with Antarctica we got almost the same number of stations (maybe just a few less) and for similar reasons I doubt it will substantially change either with a couple new stations or revisions.
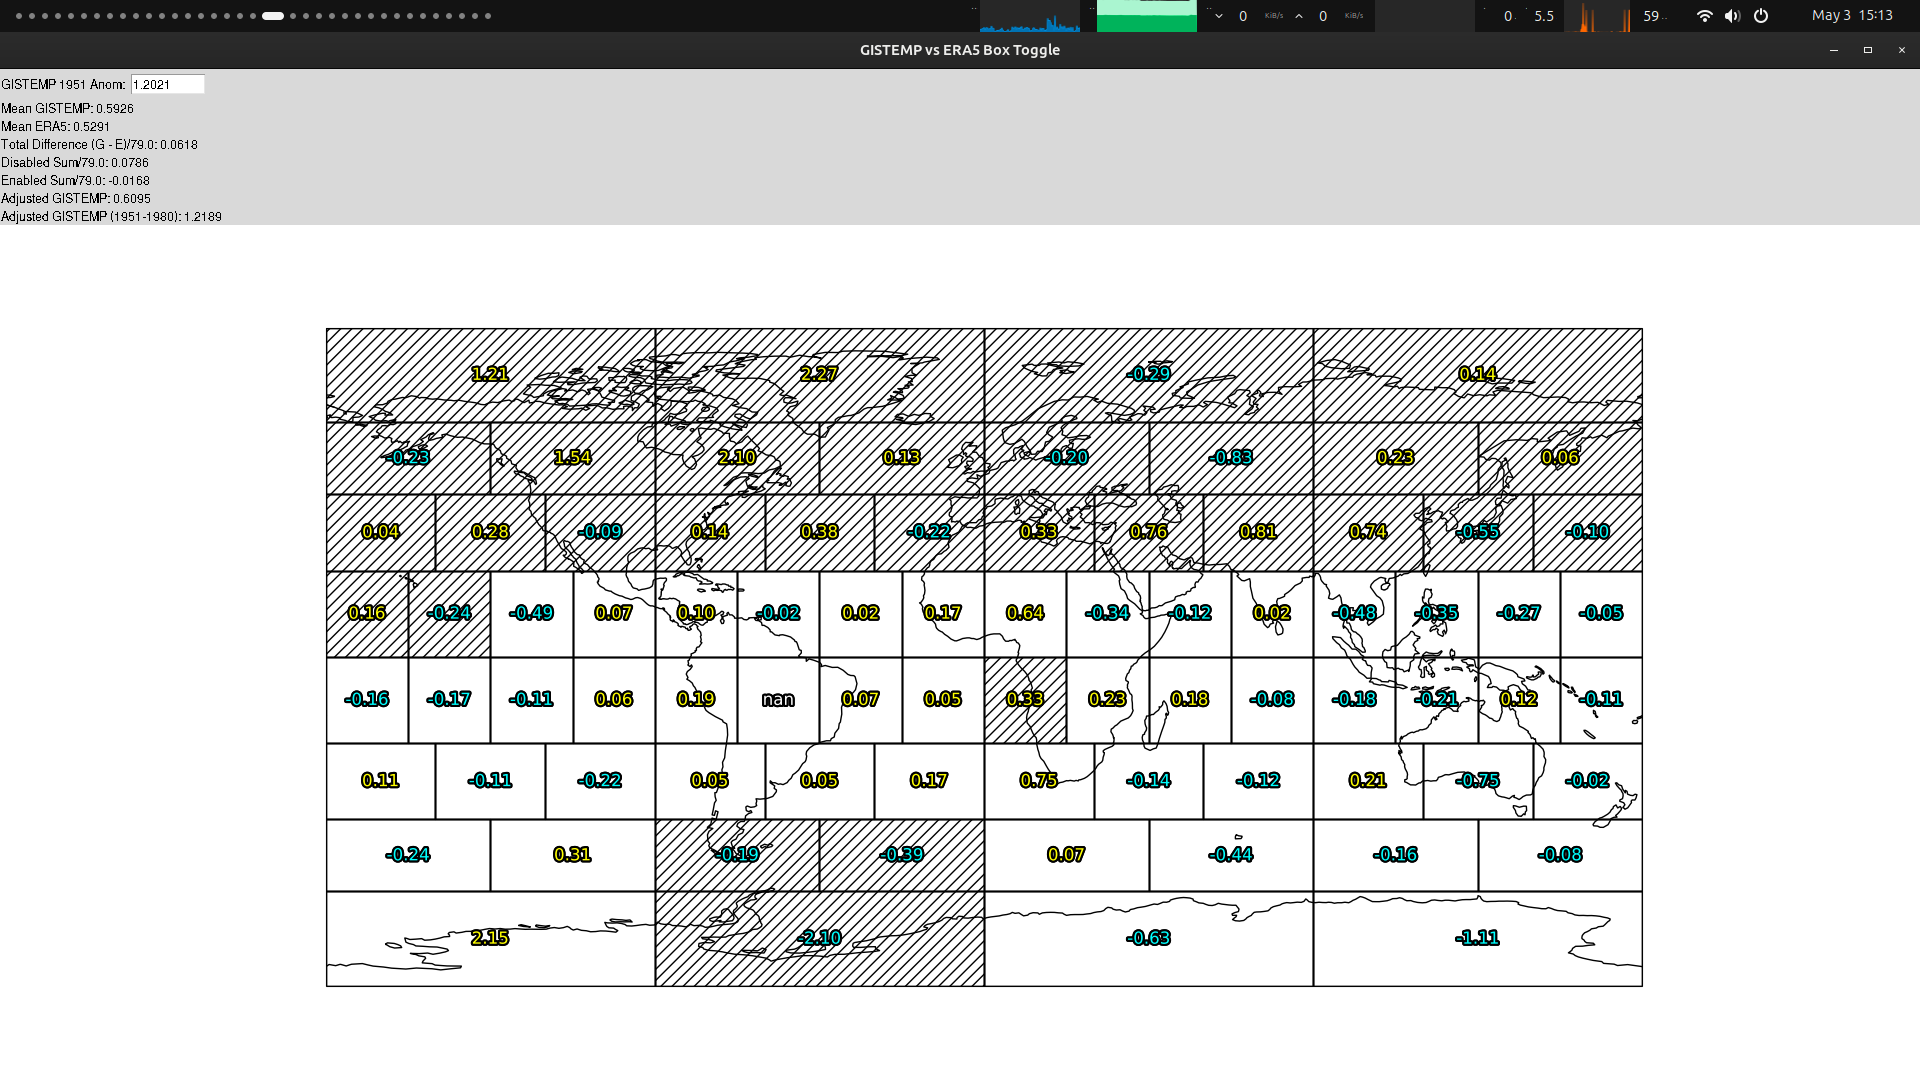
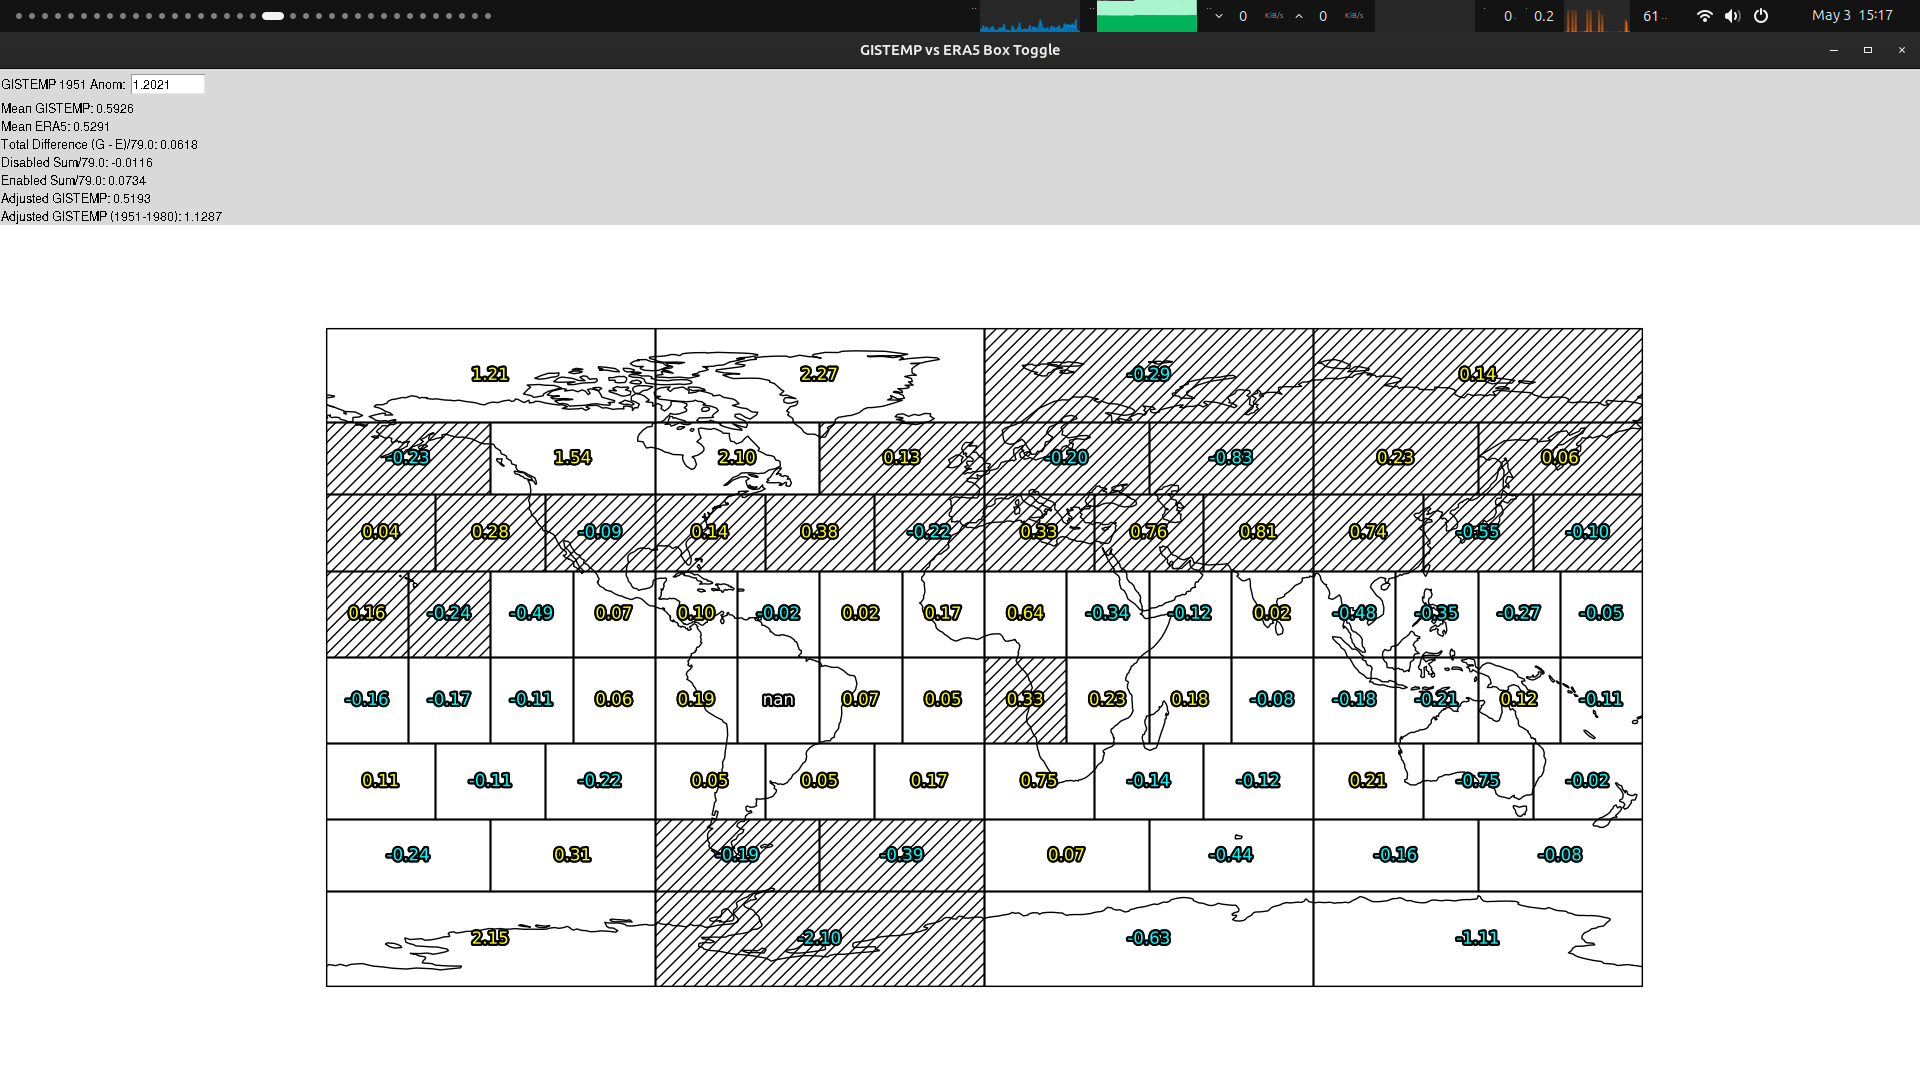
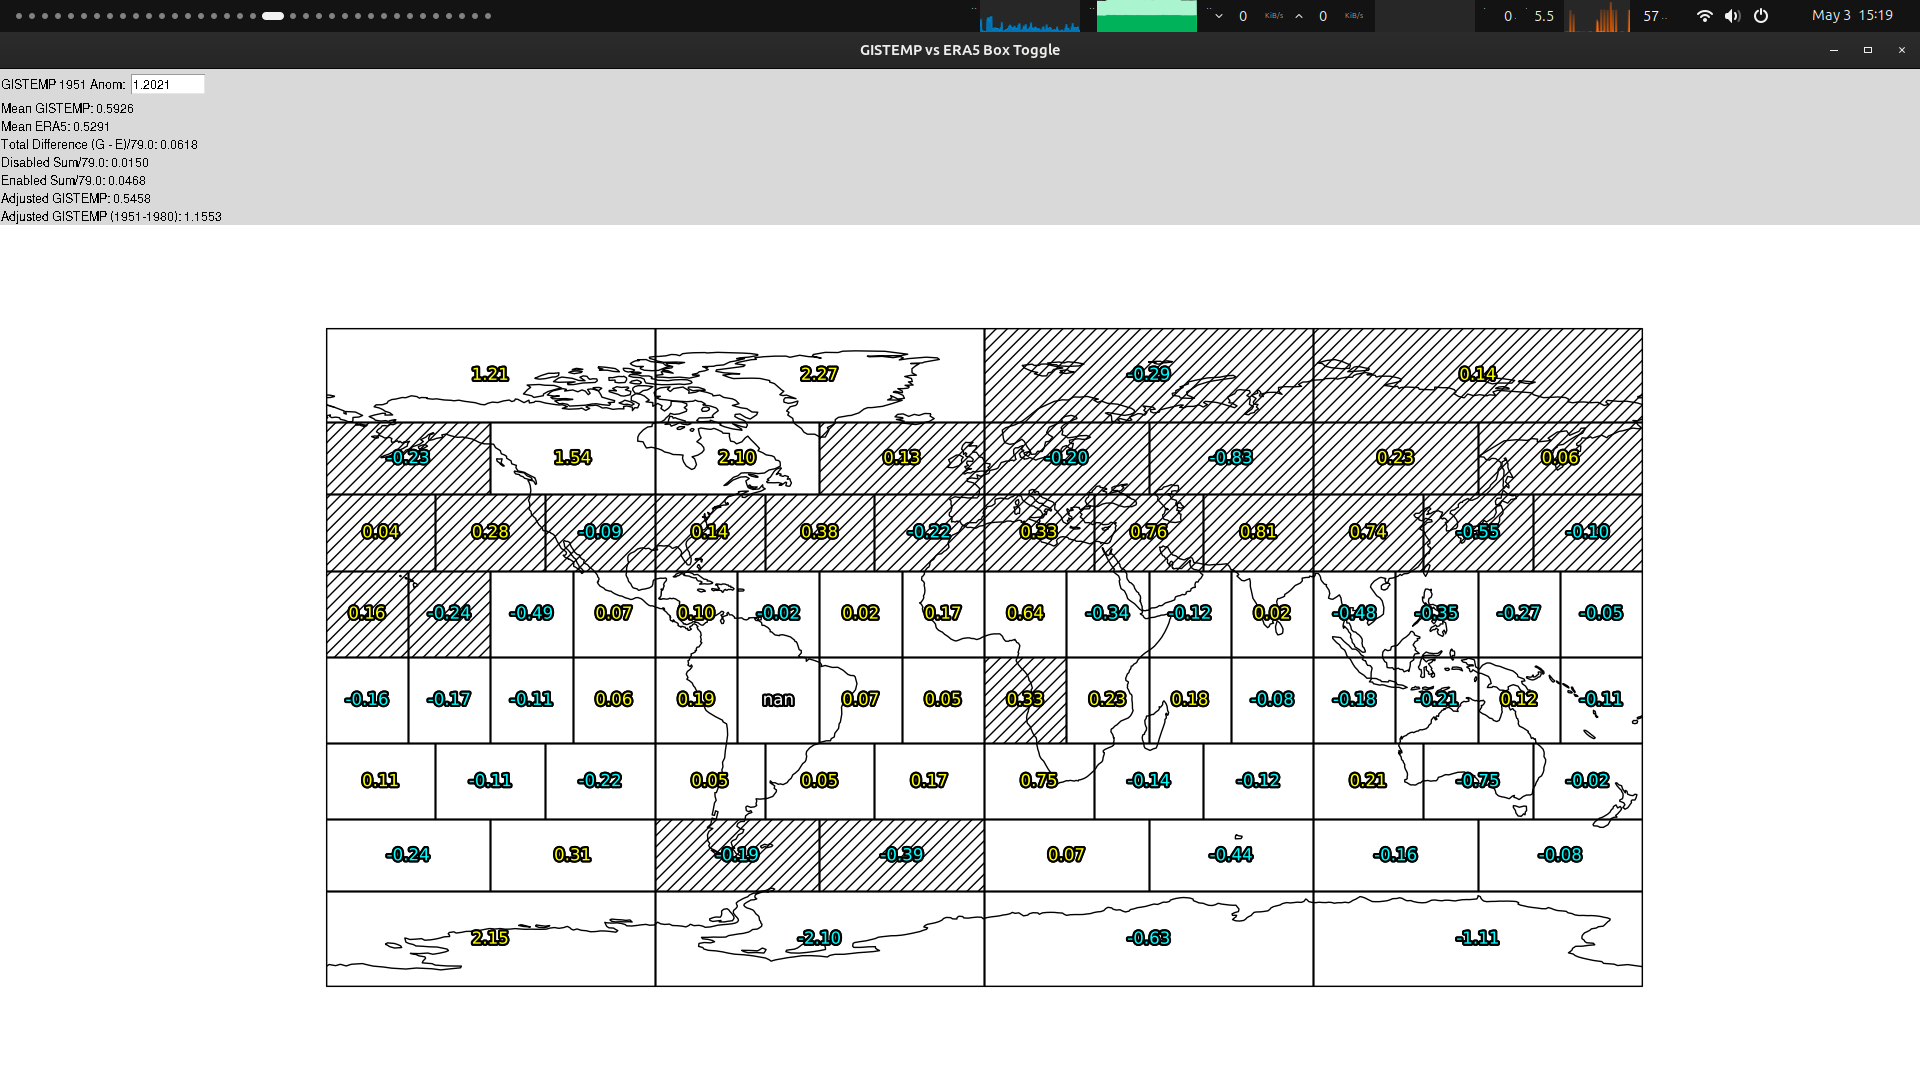
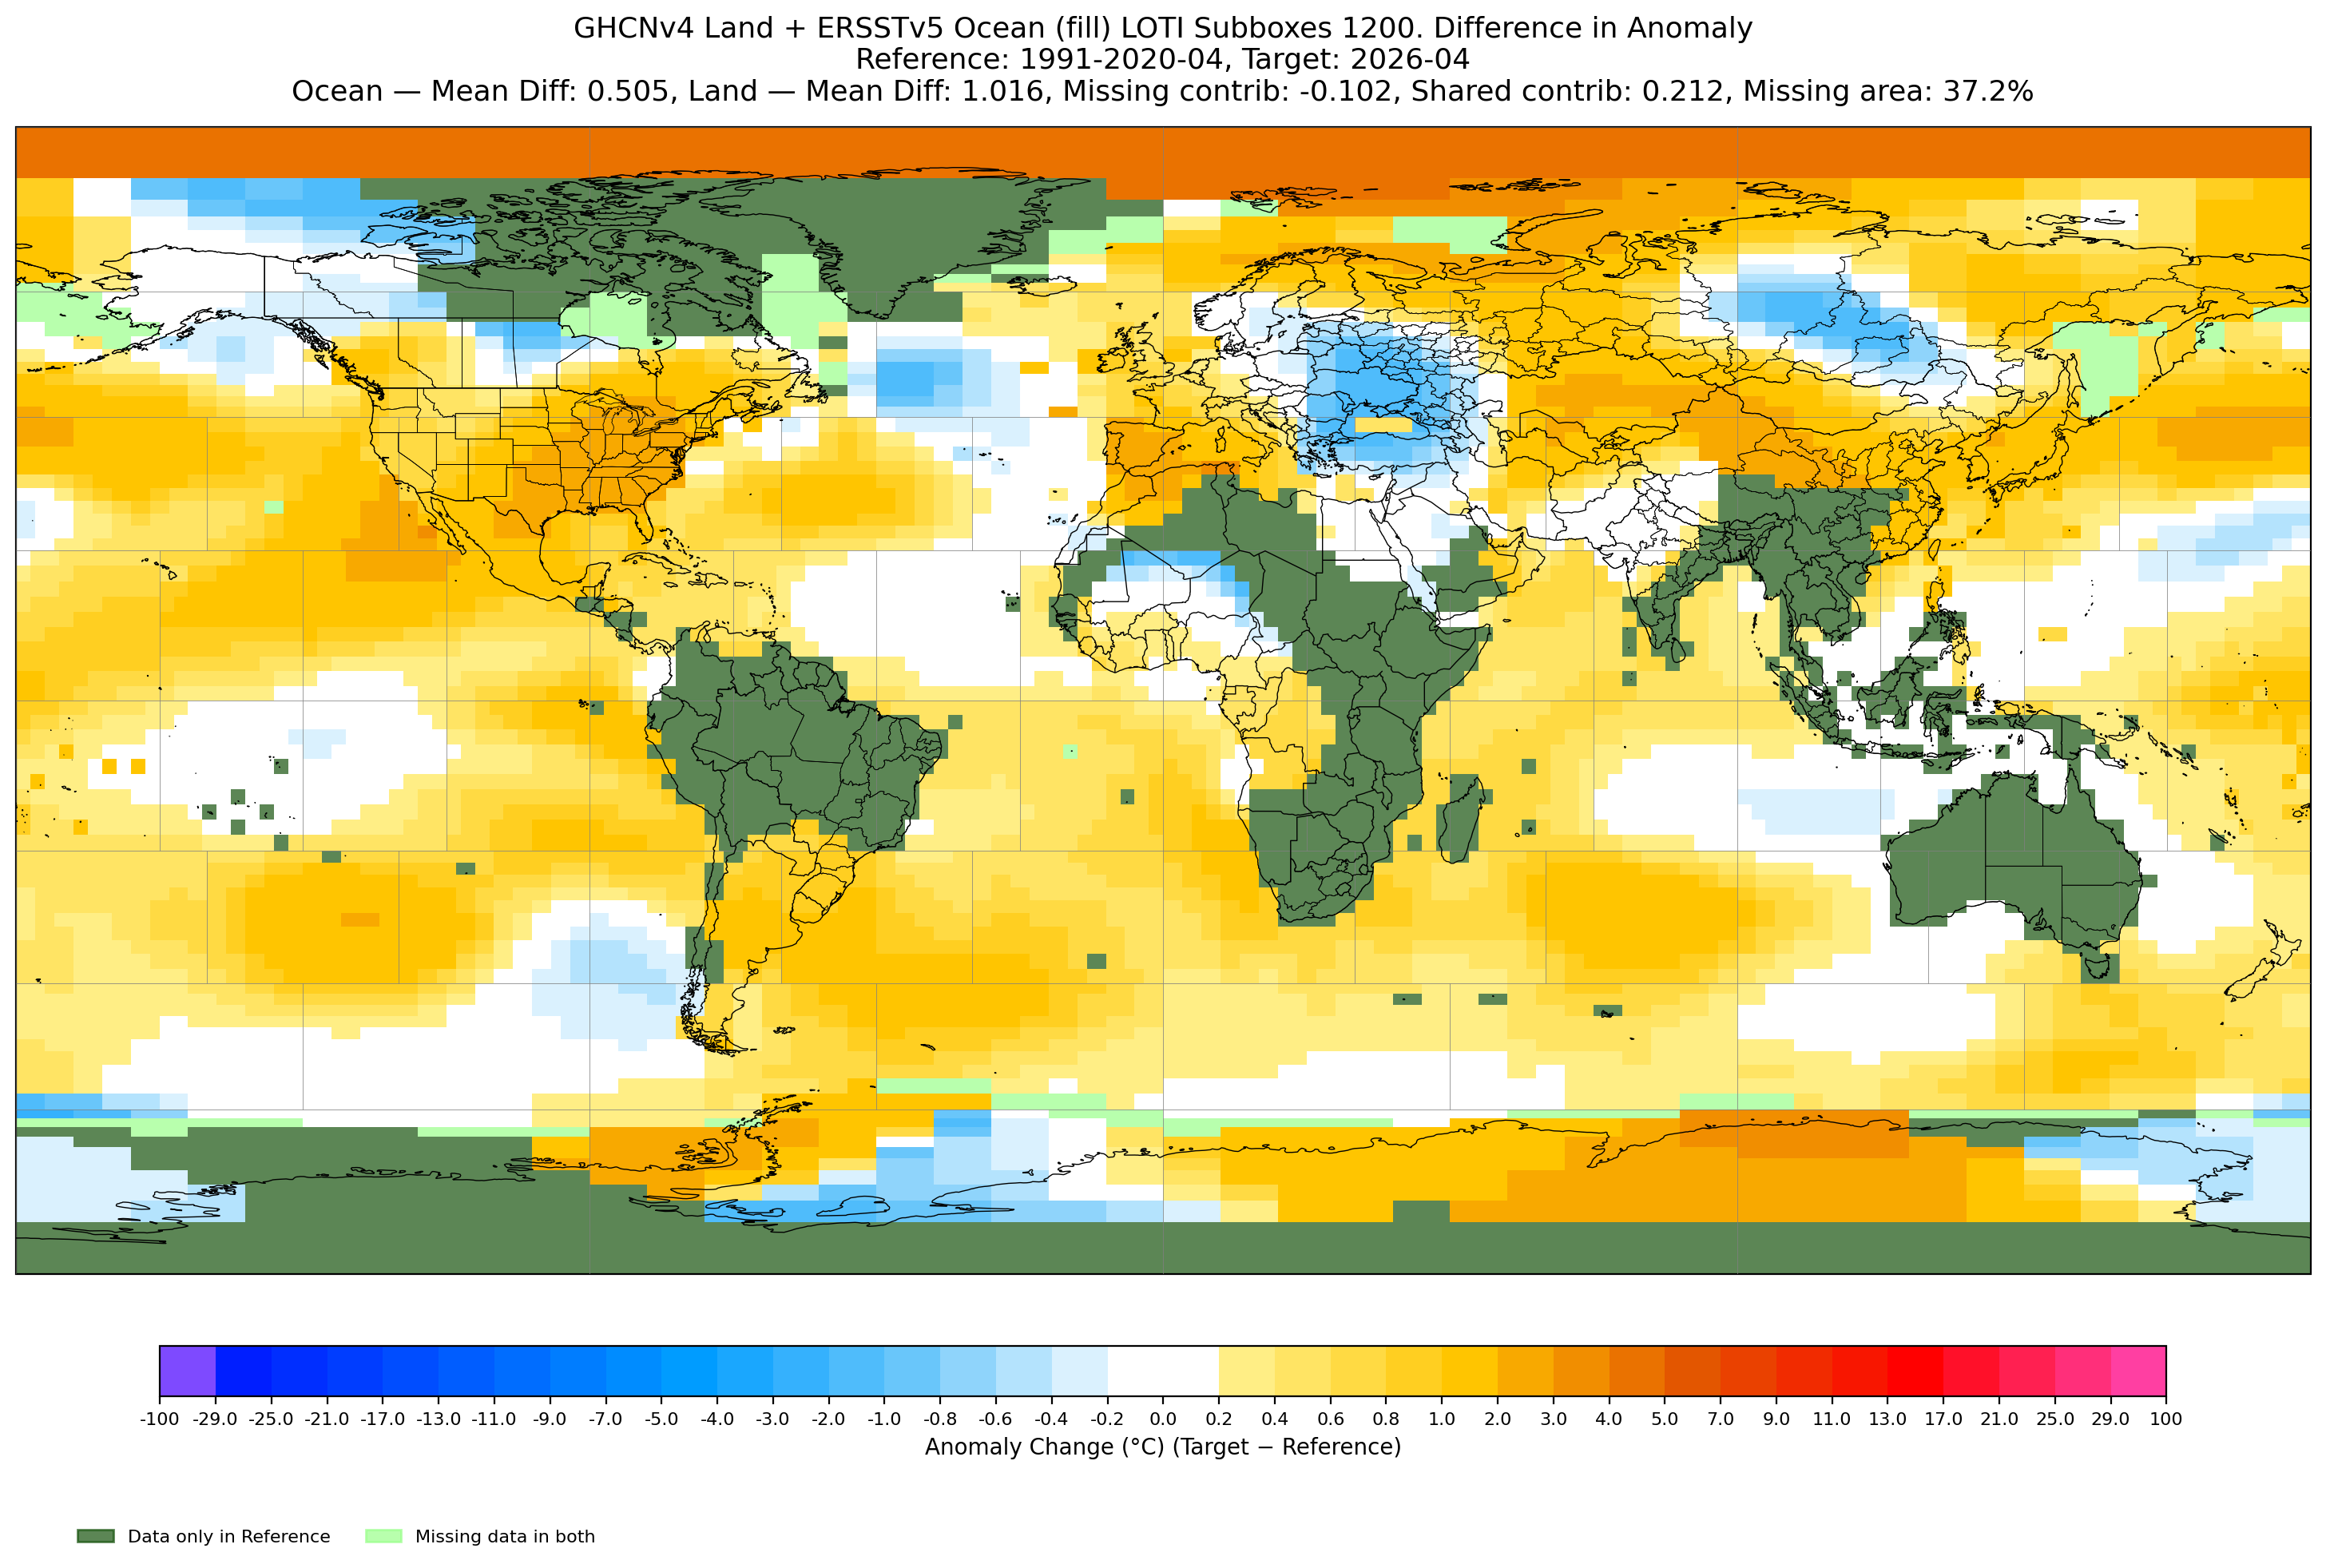
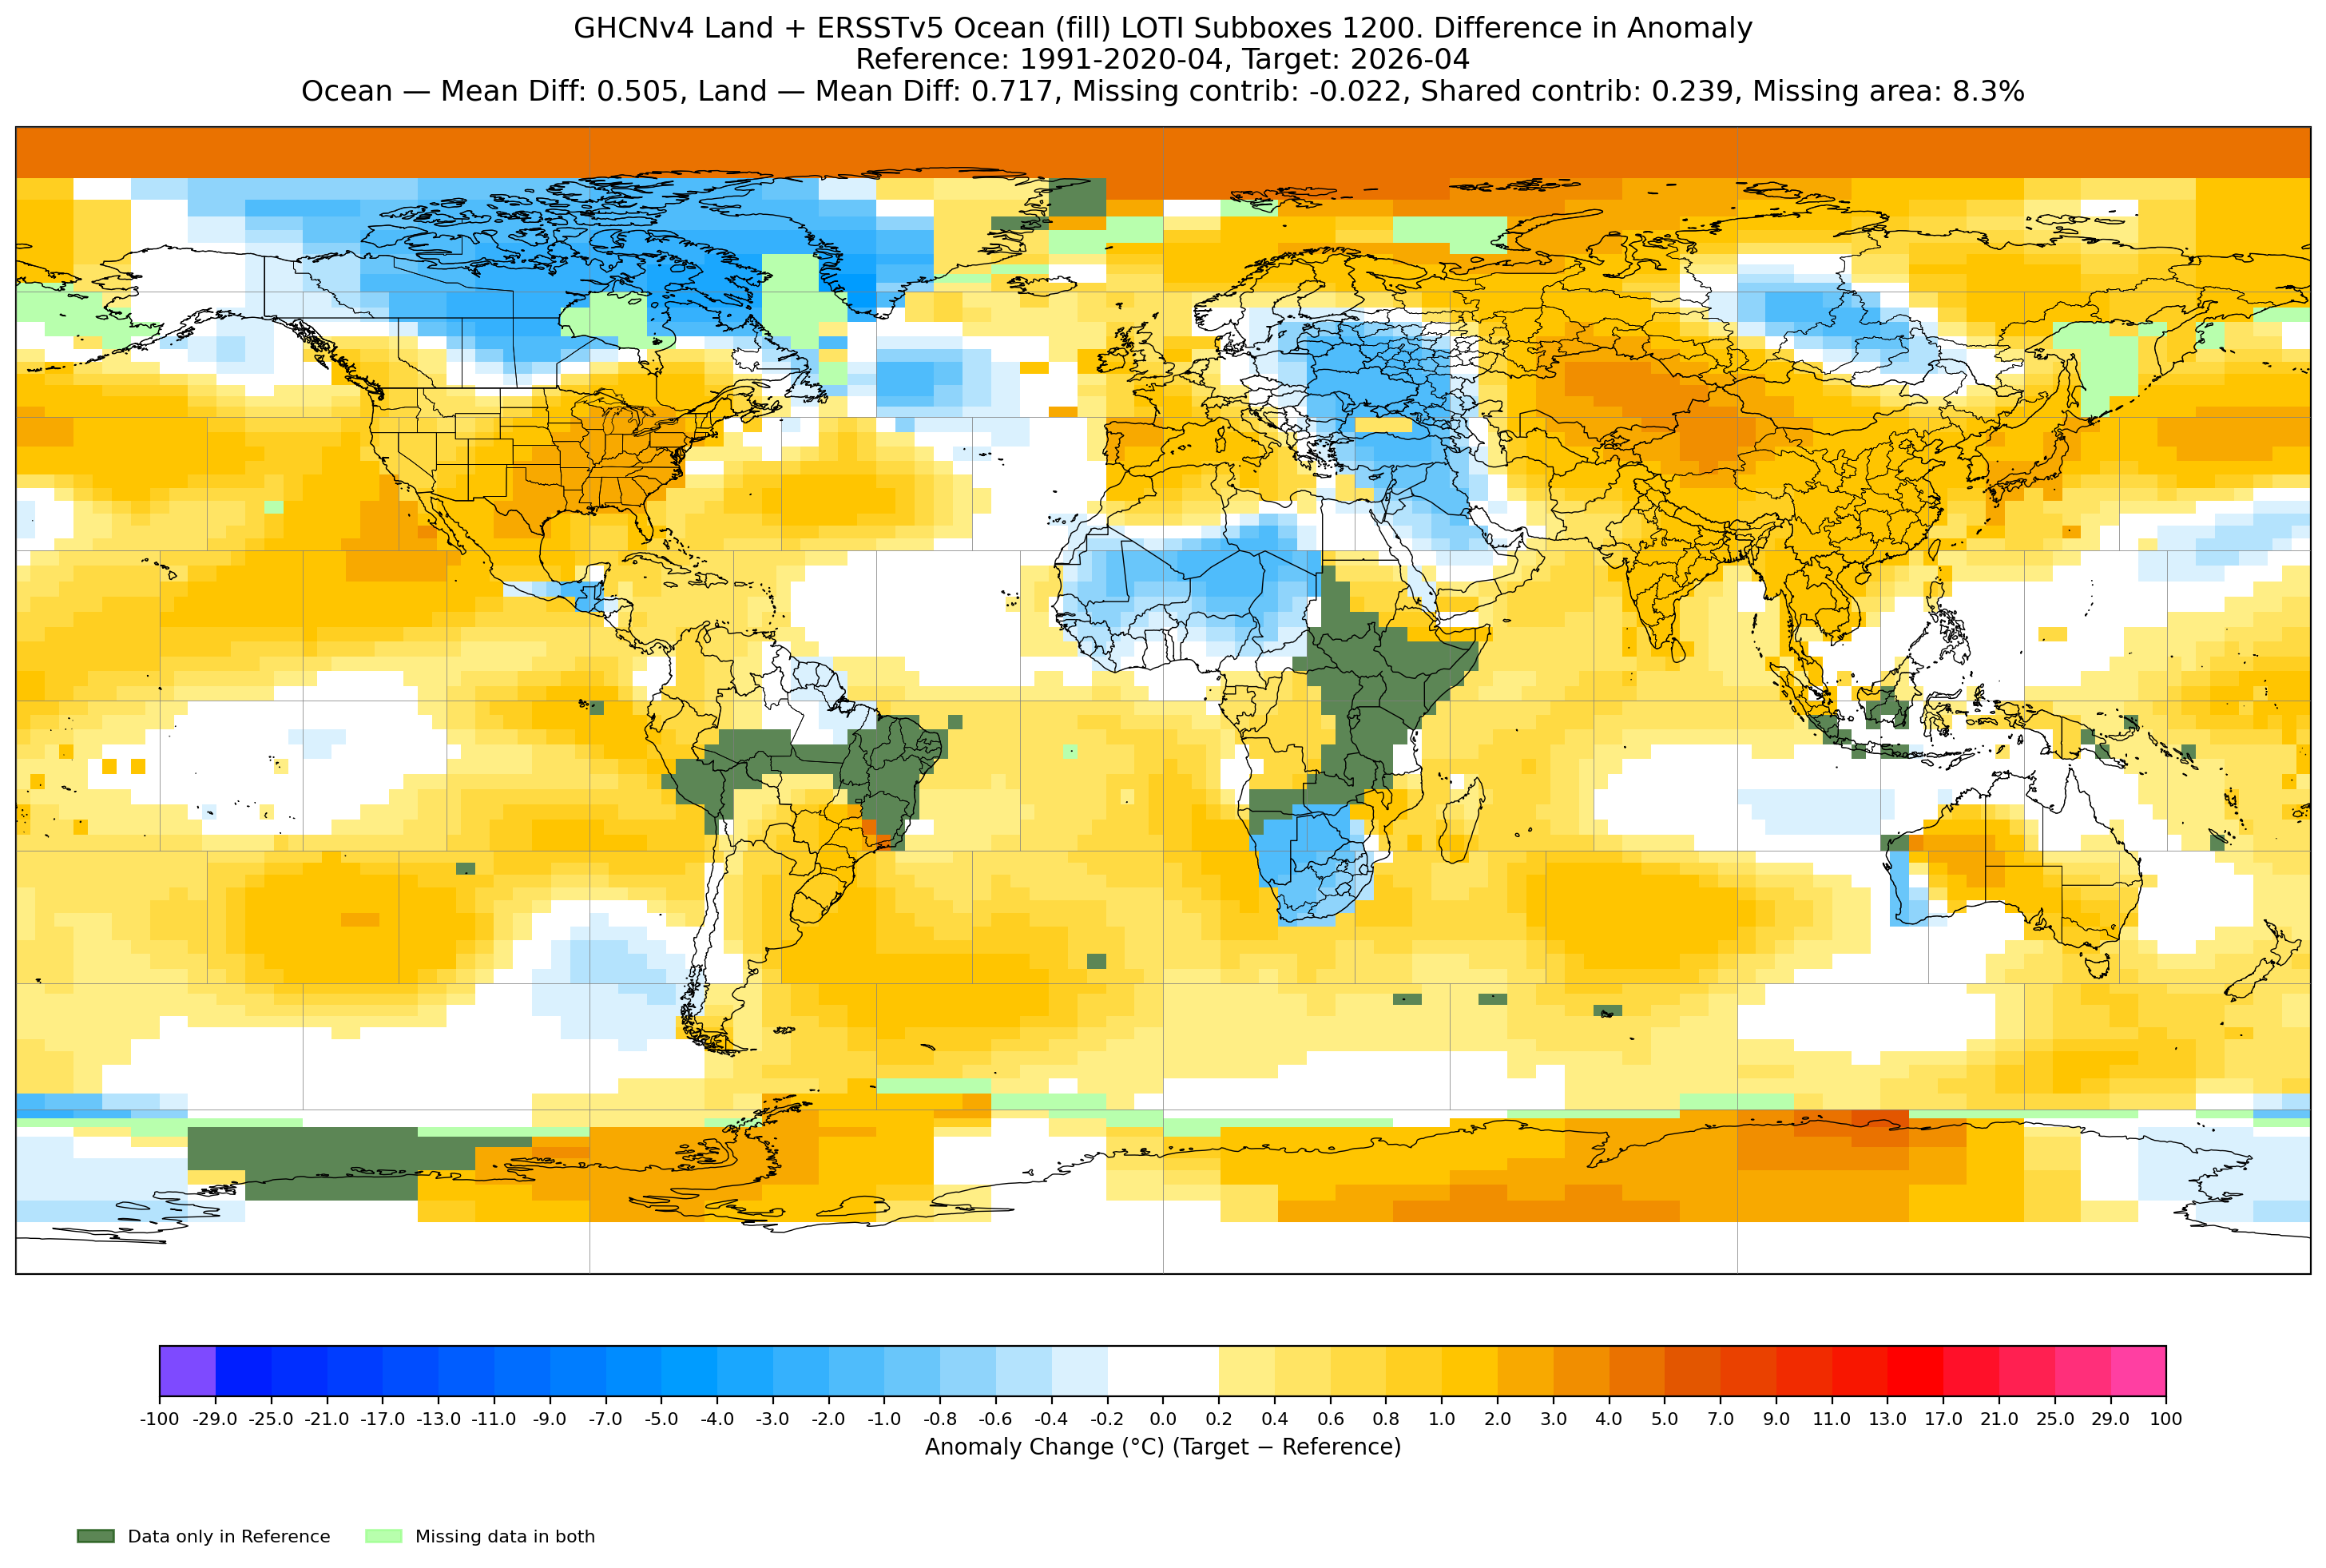
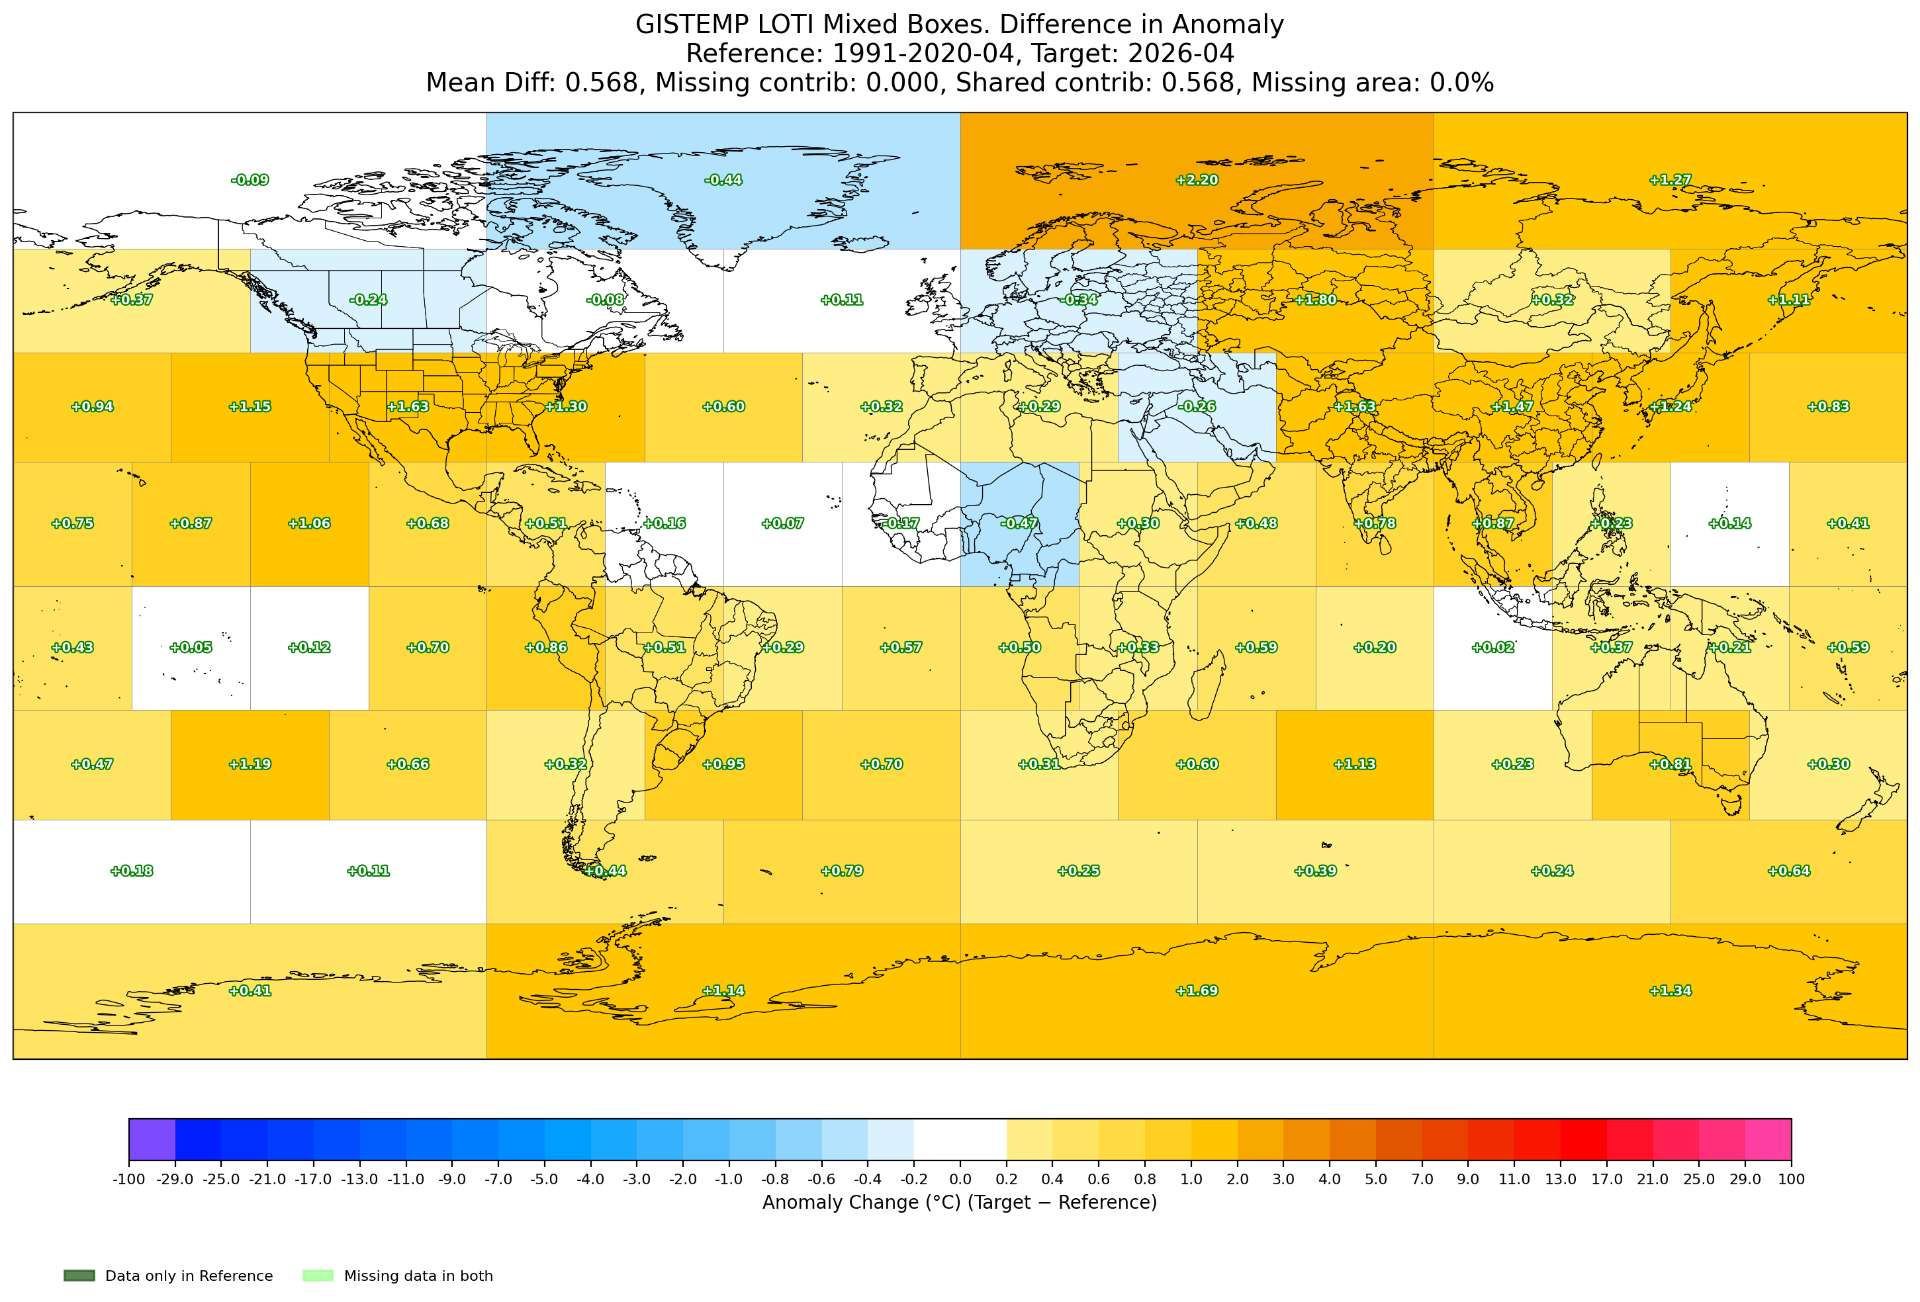
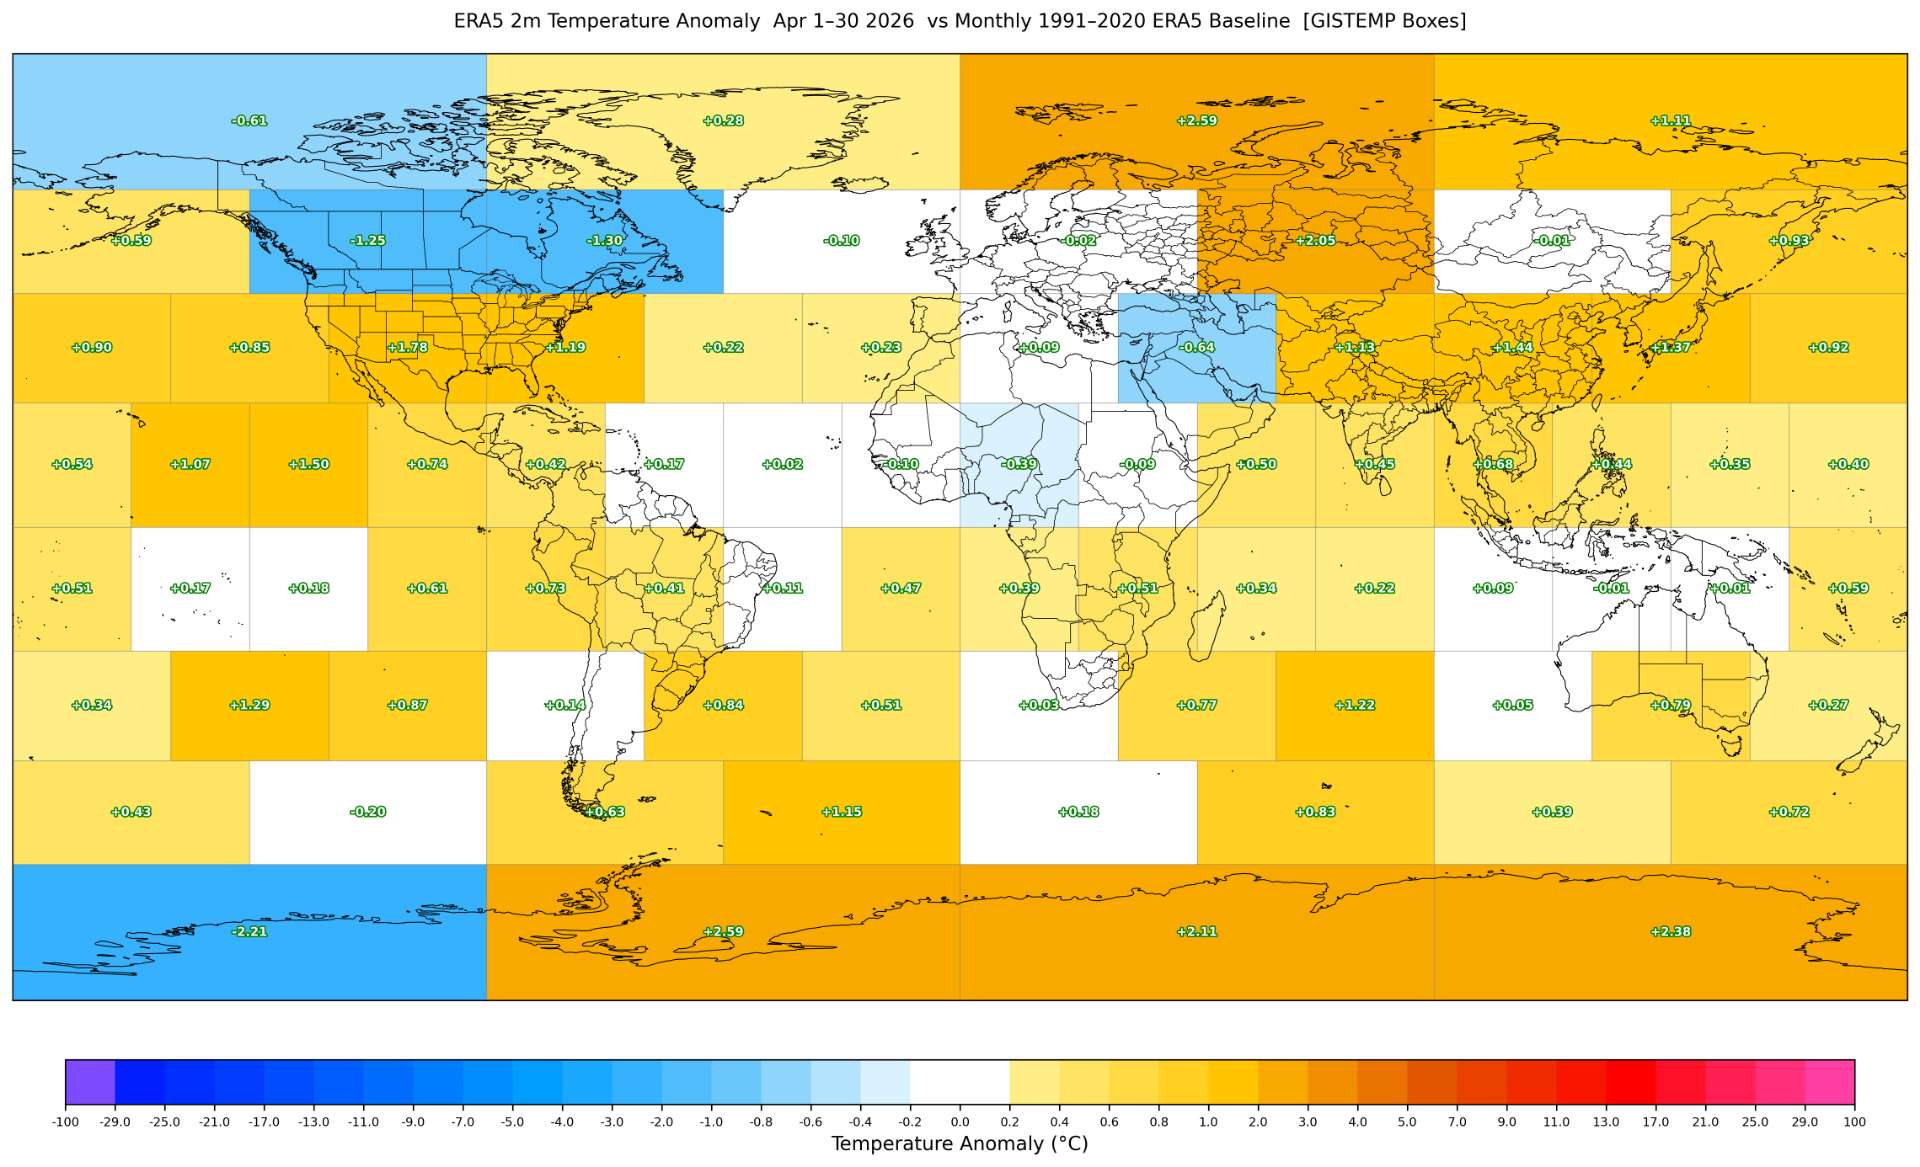
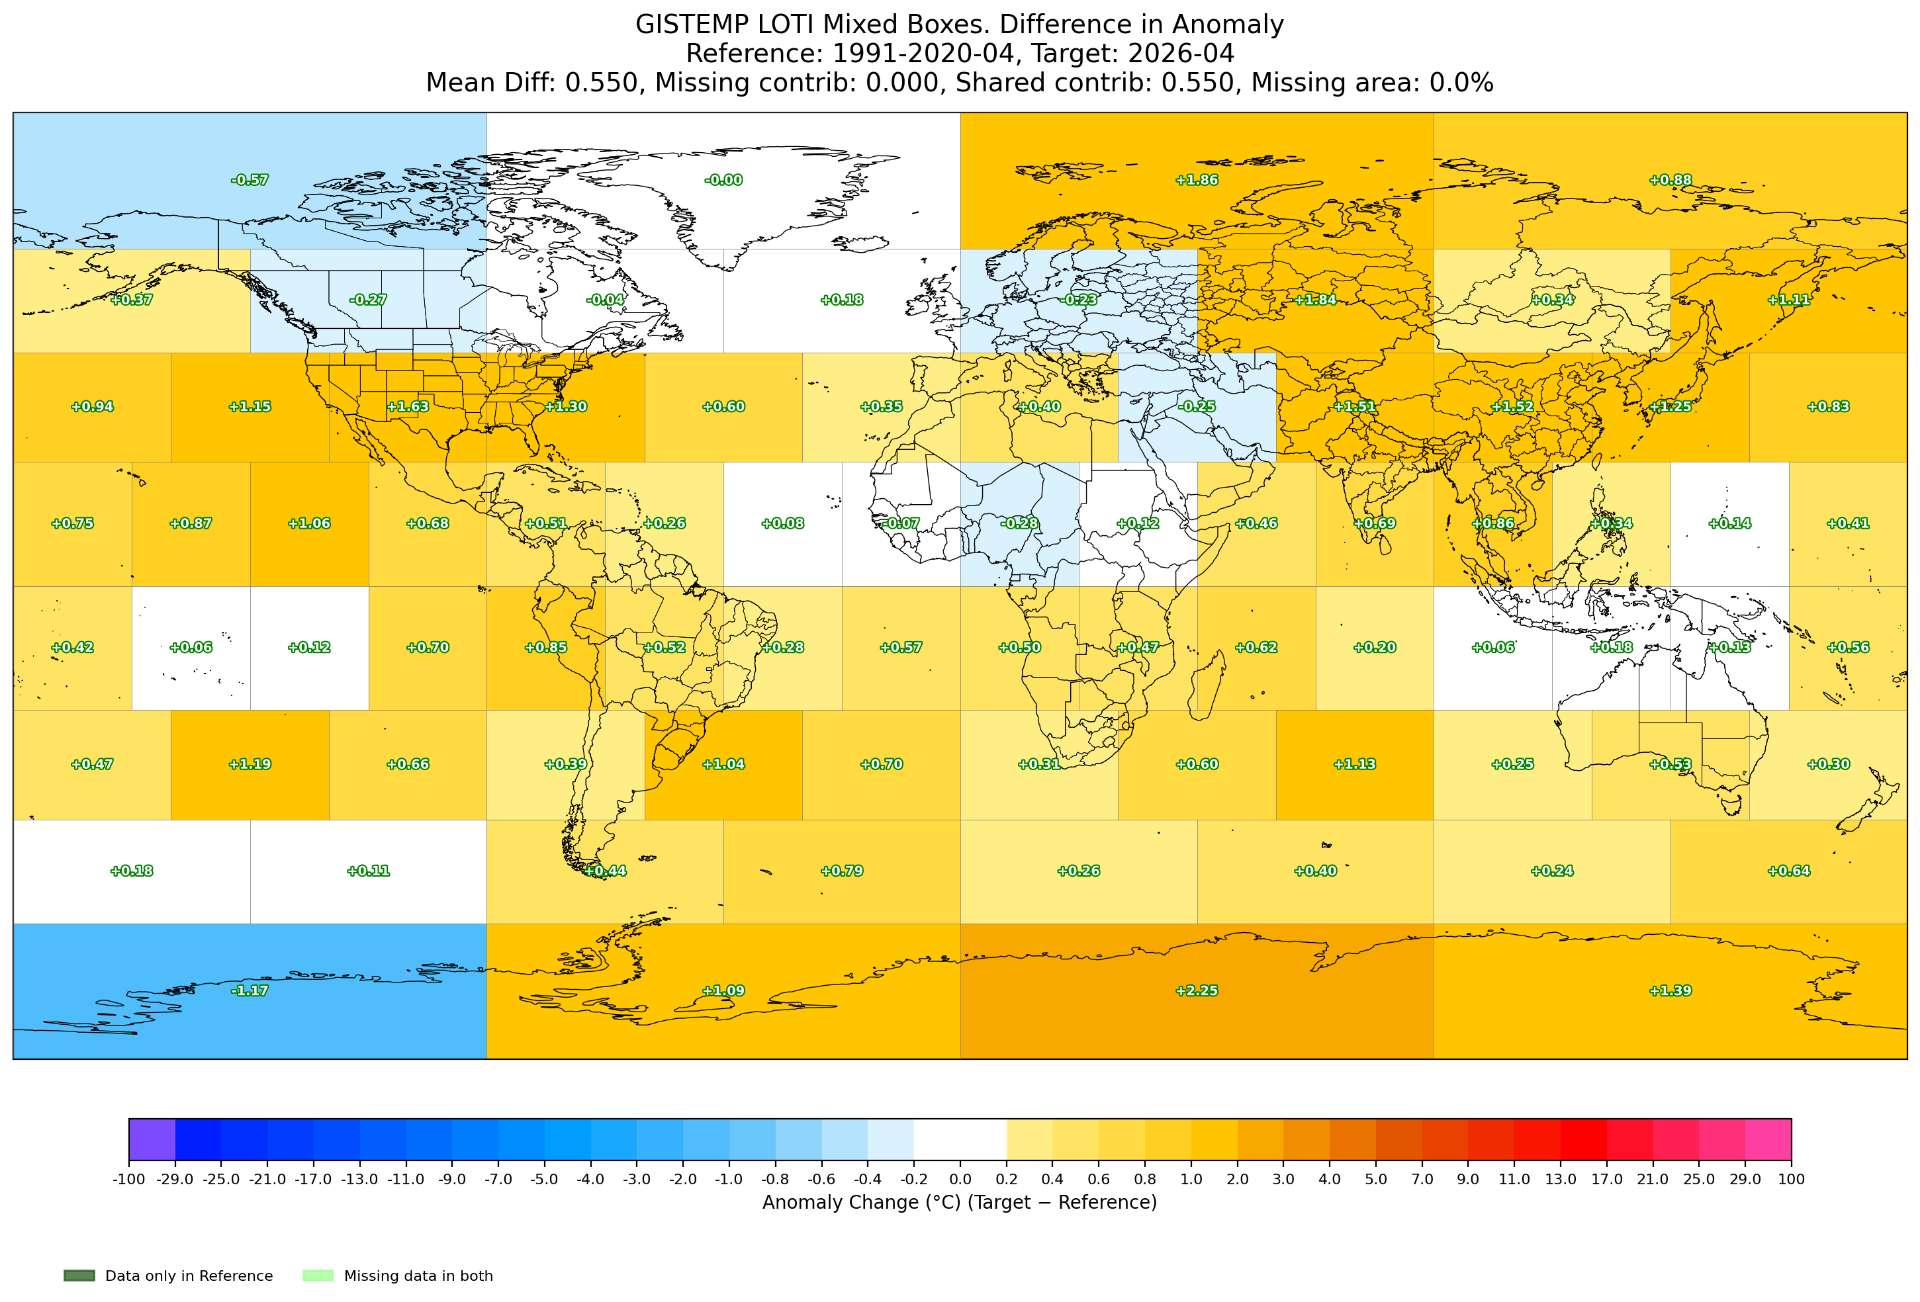
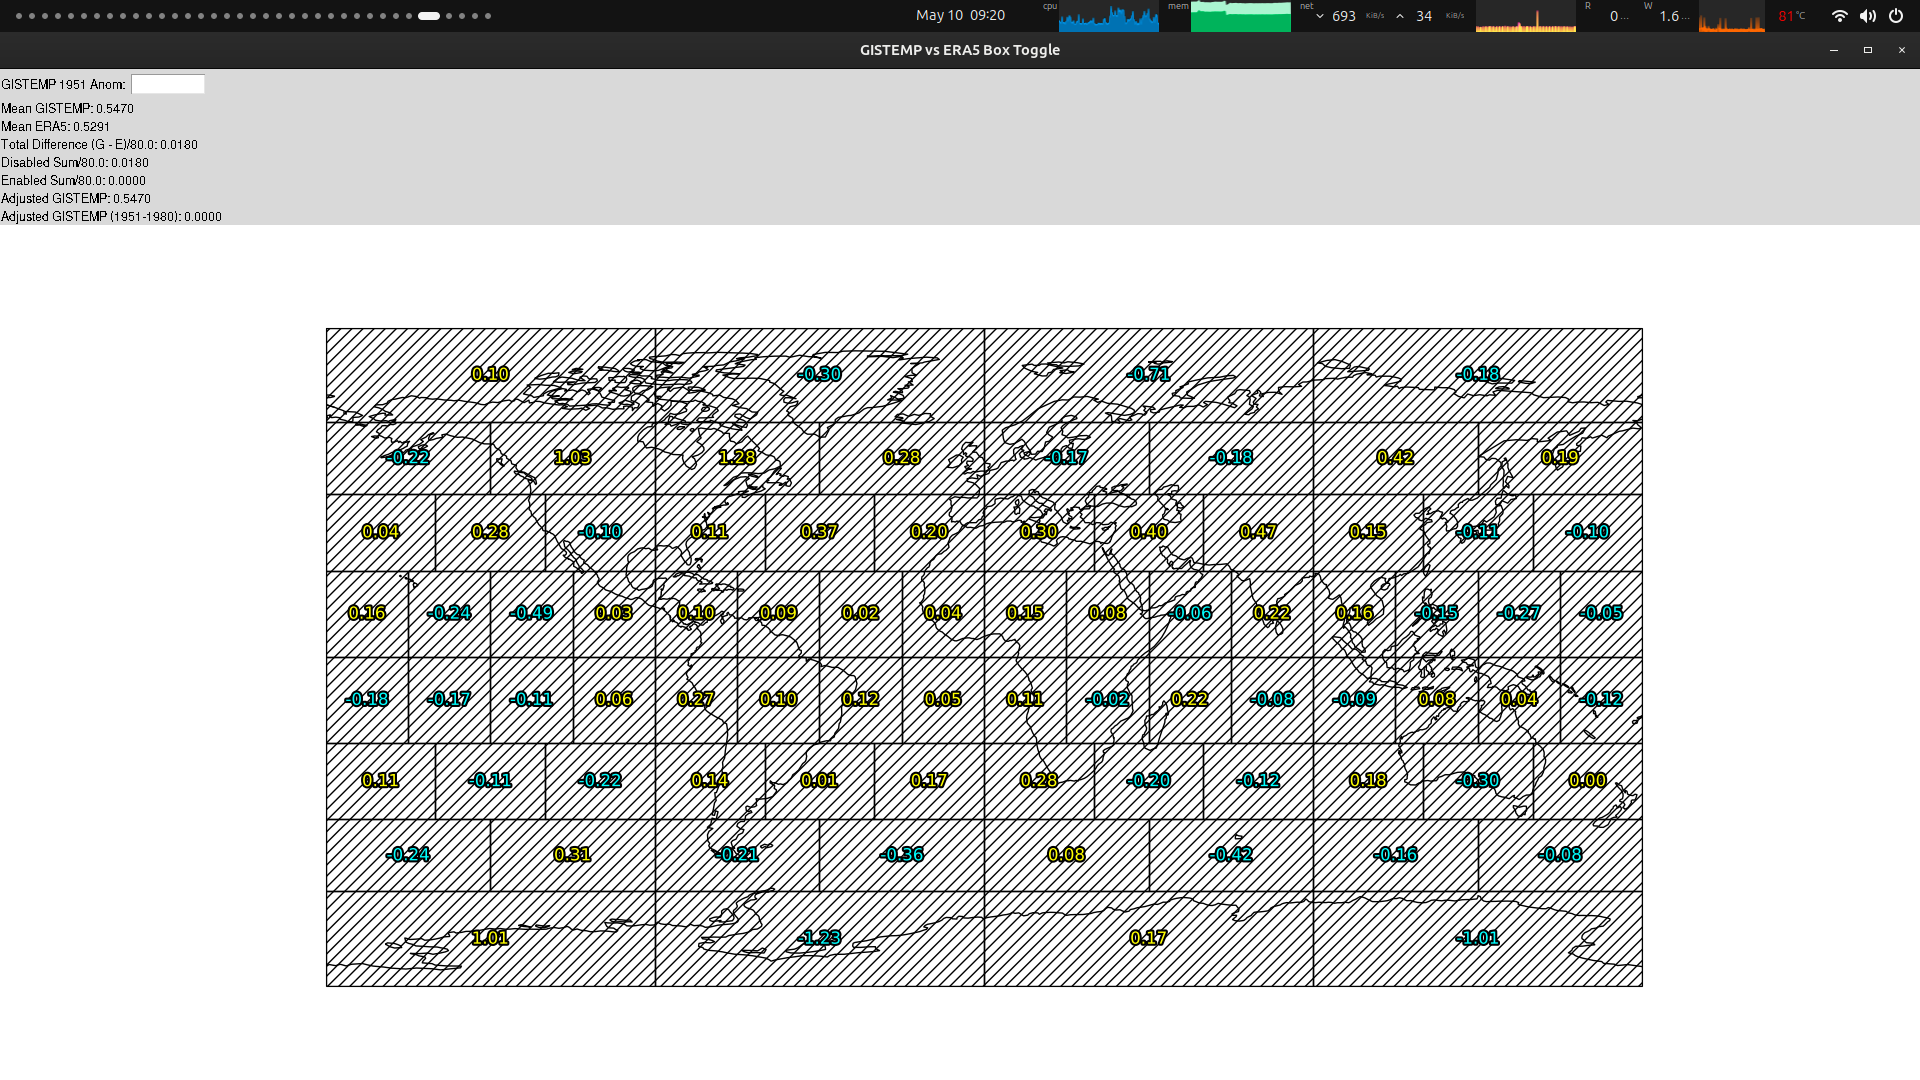
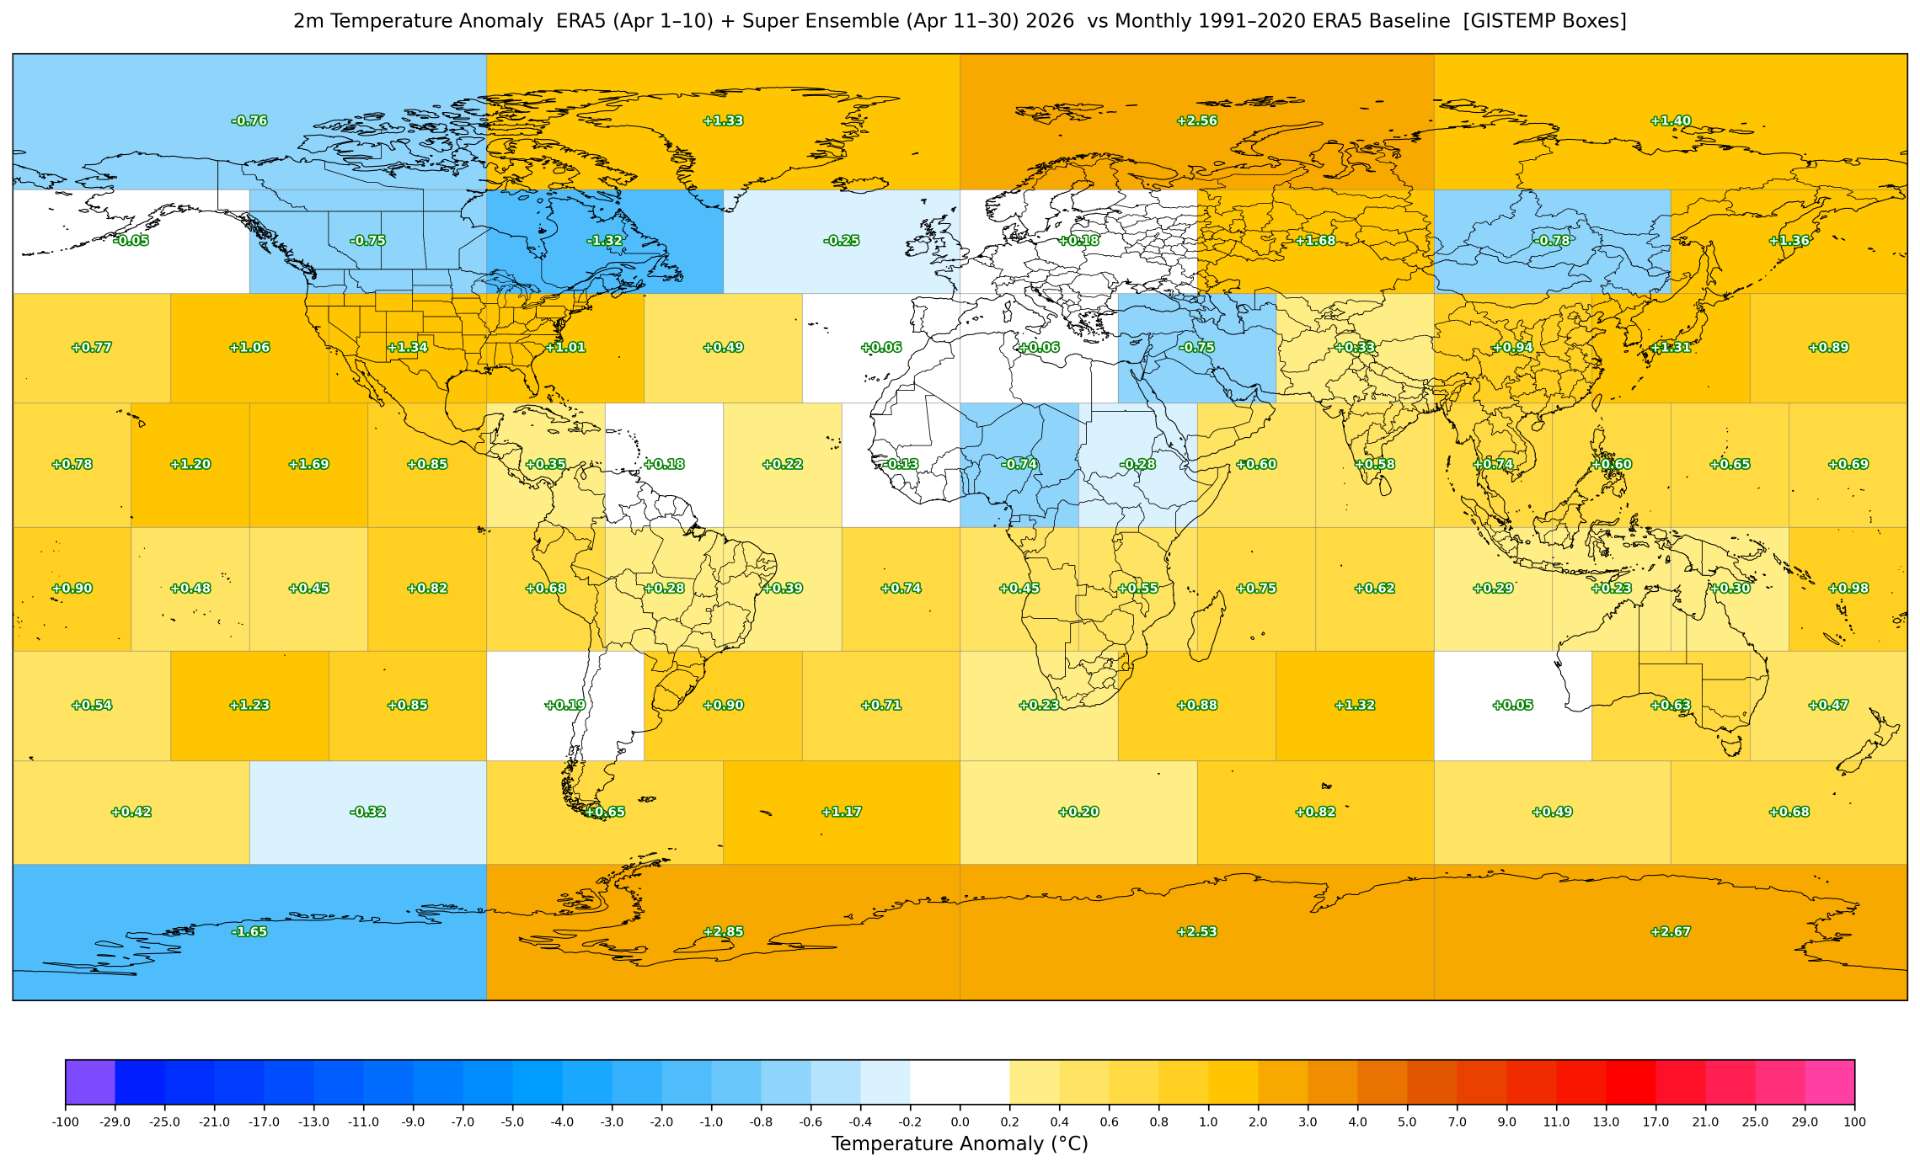
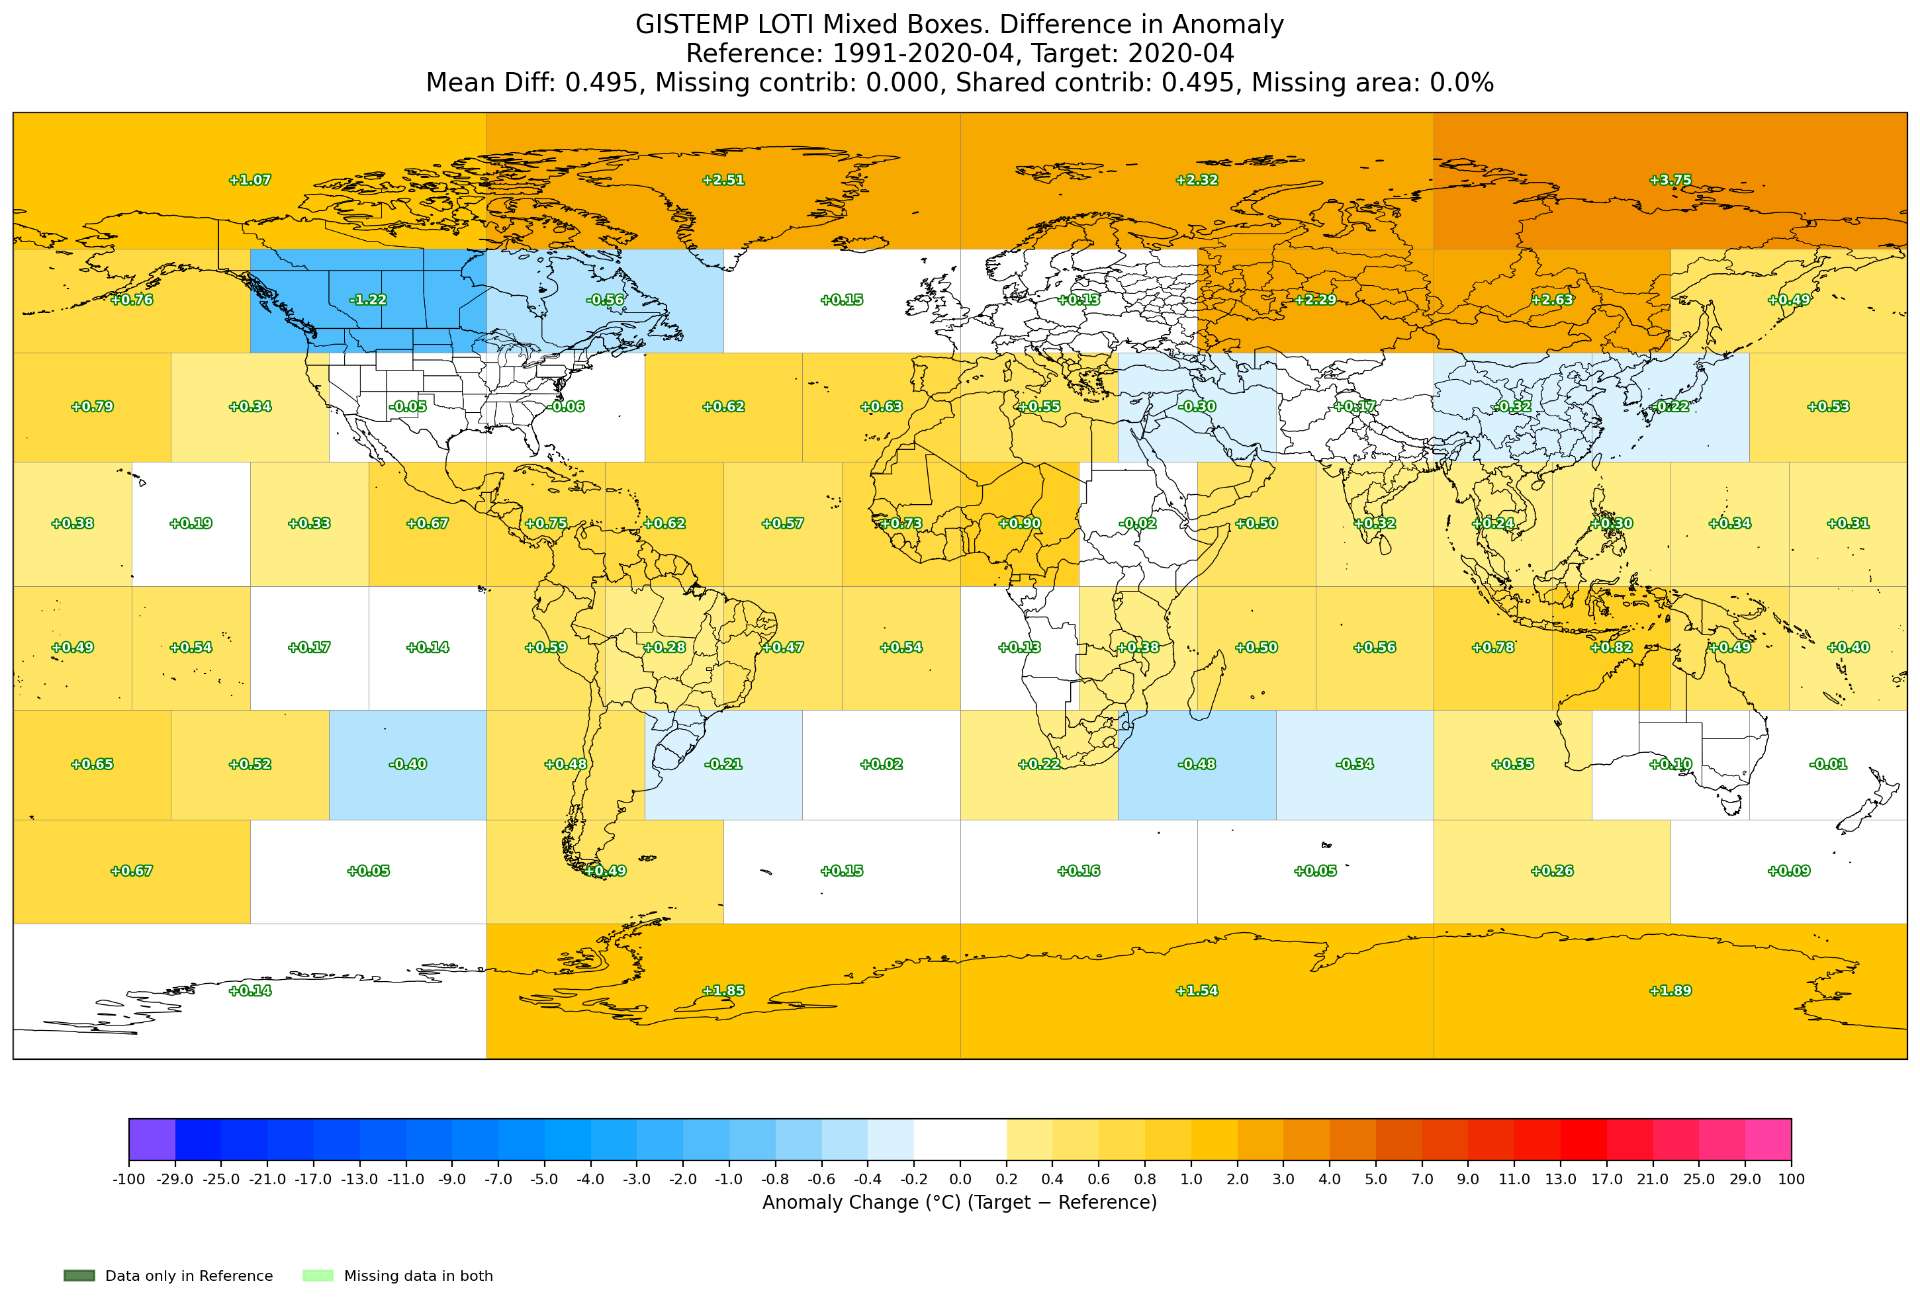
GISTEMP-ERA5 box deltas again:
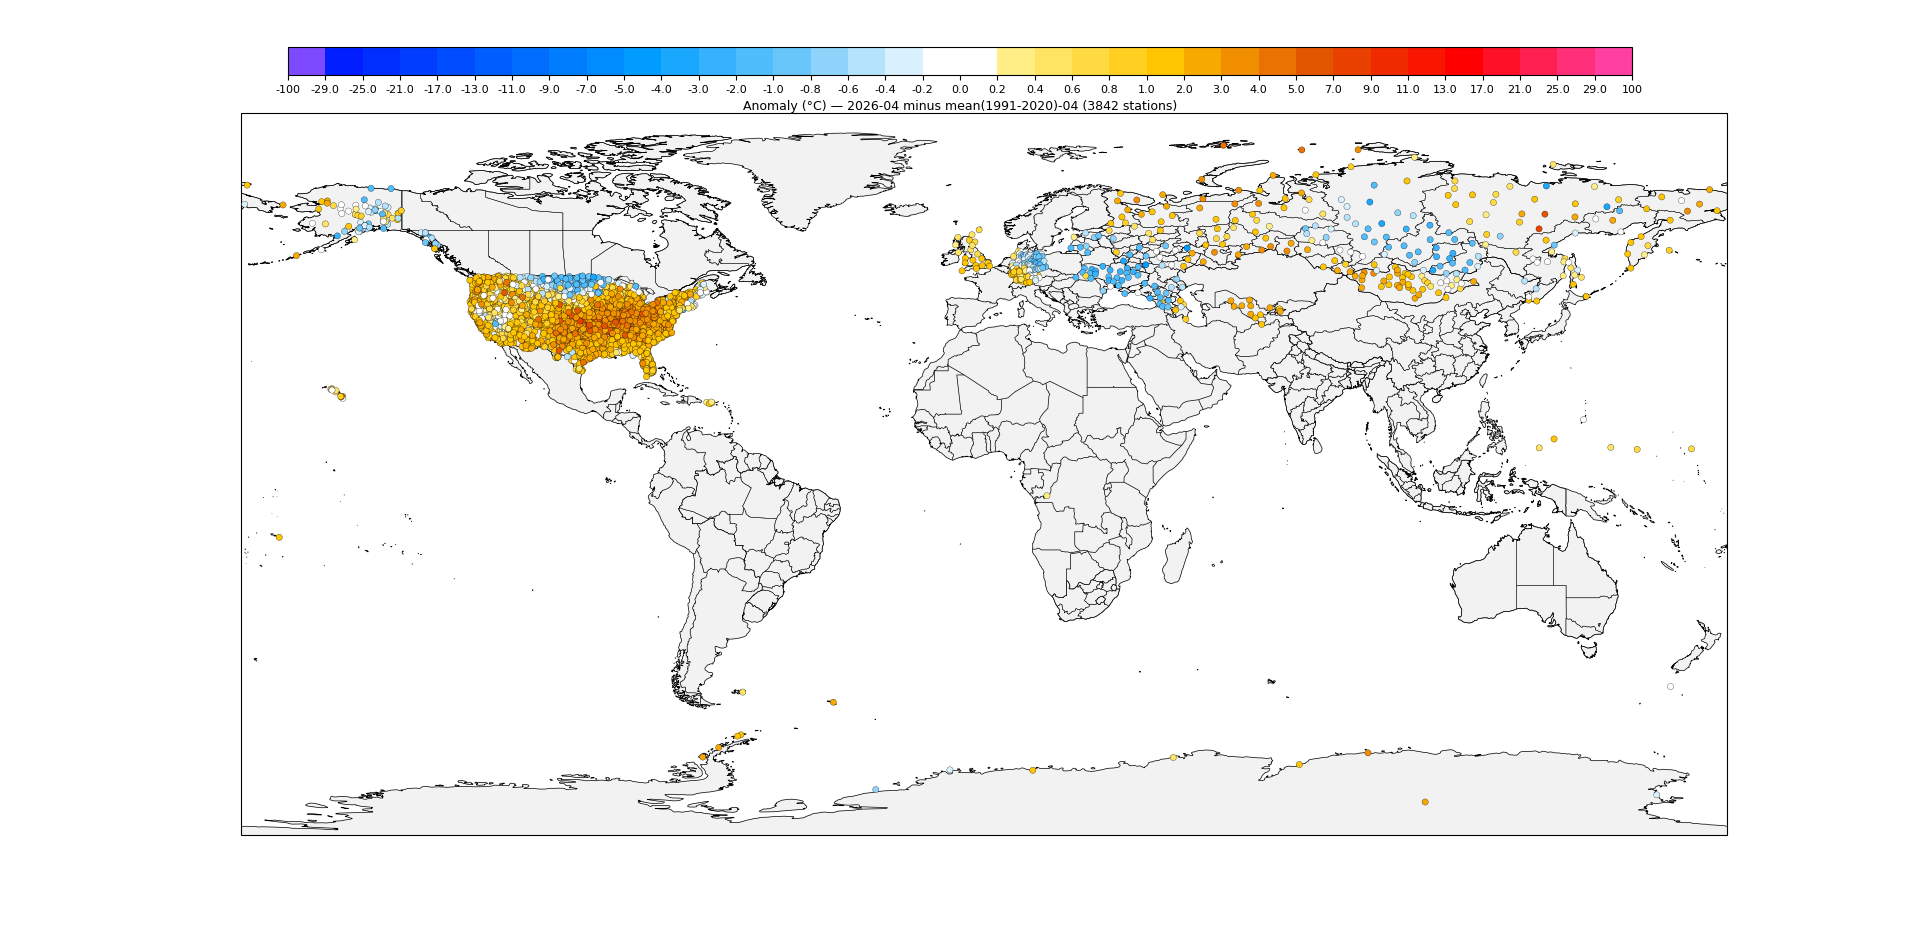
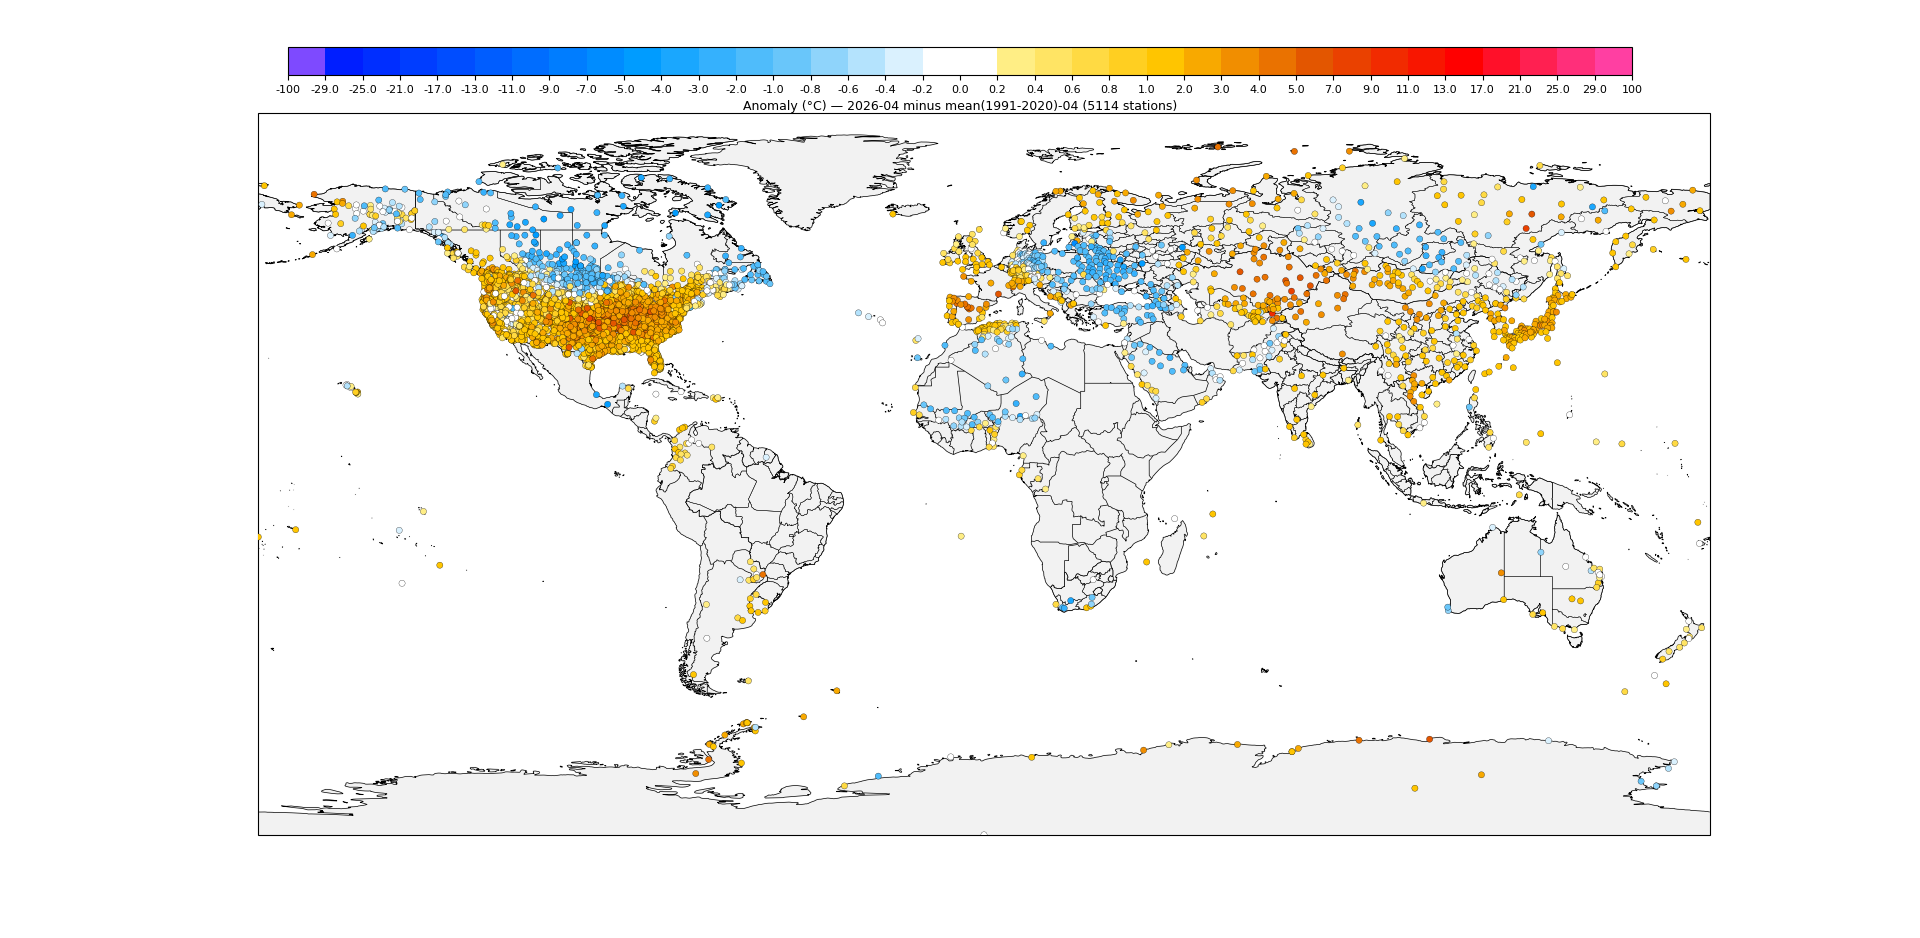
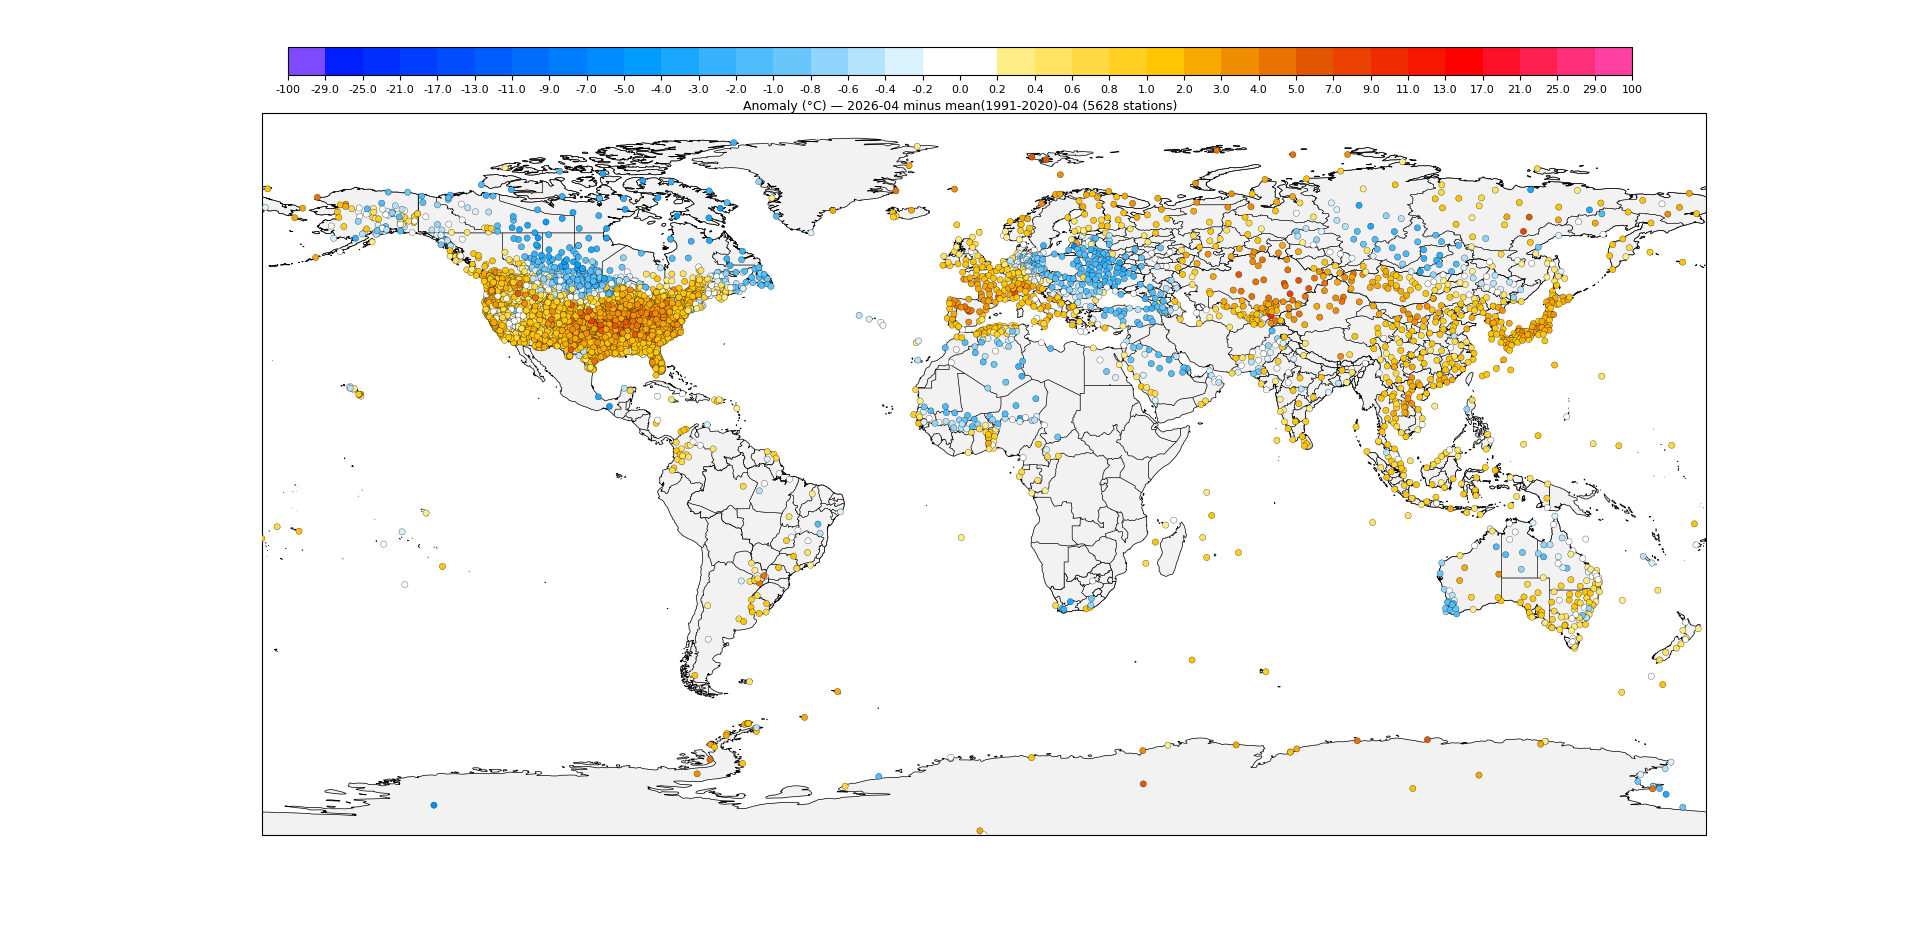
for comparison here is the April 2025 station plot:
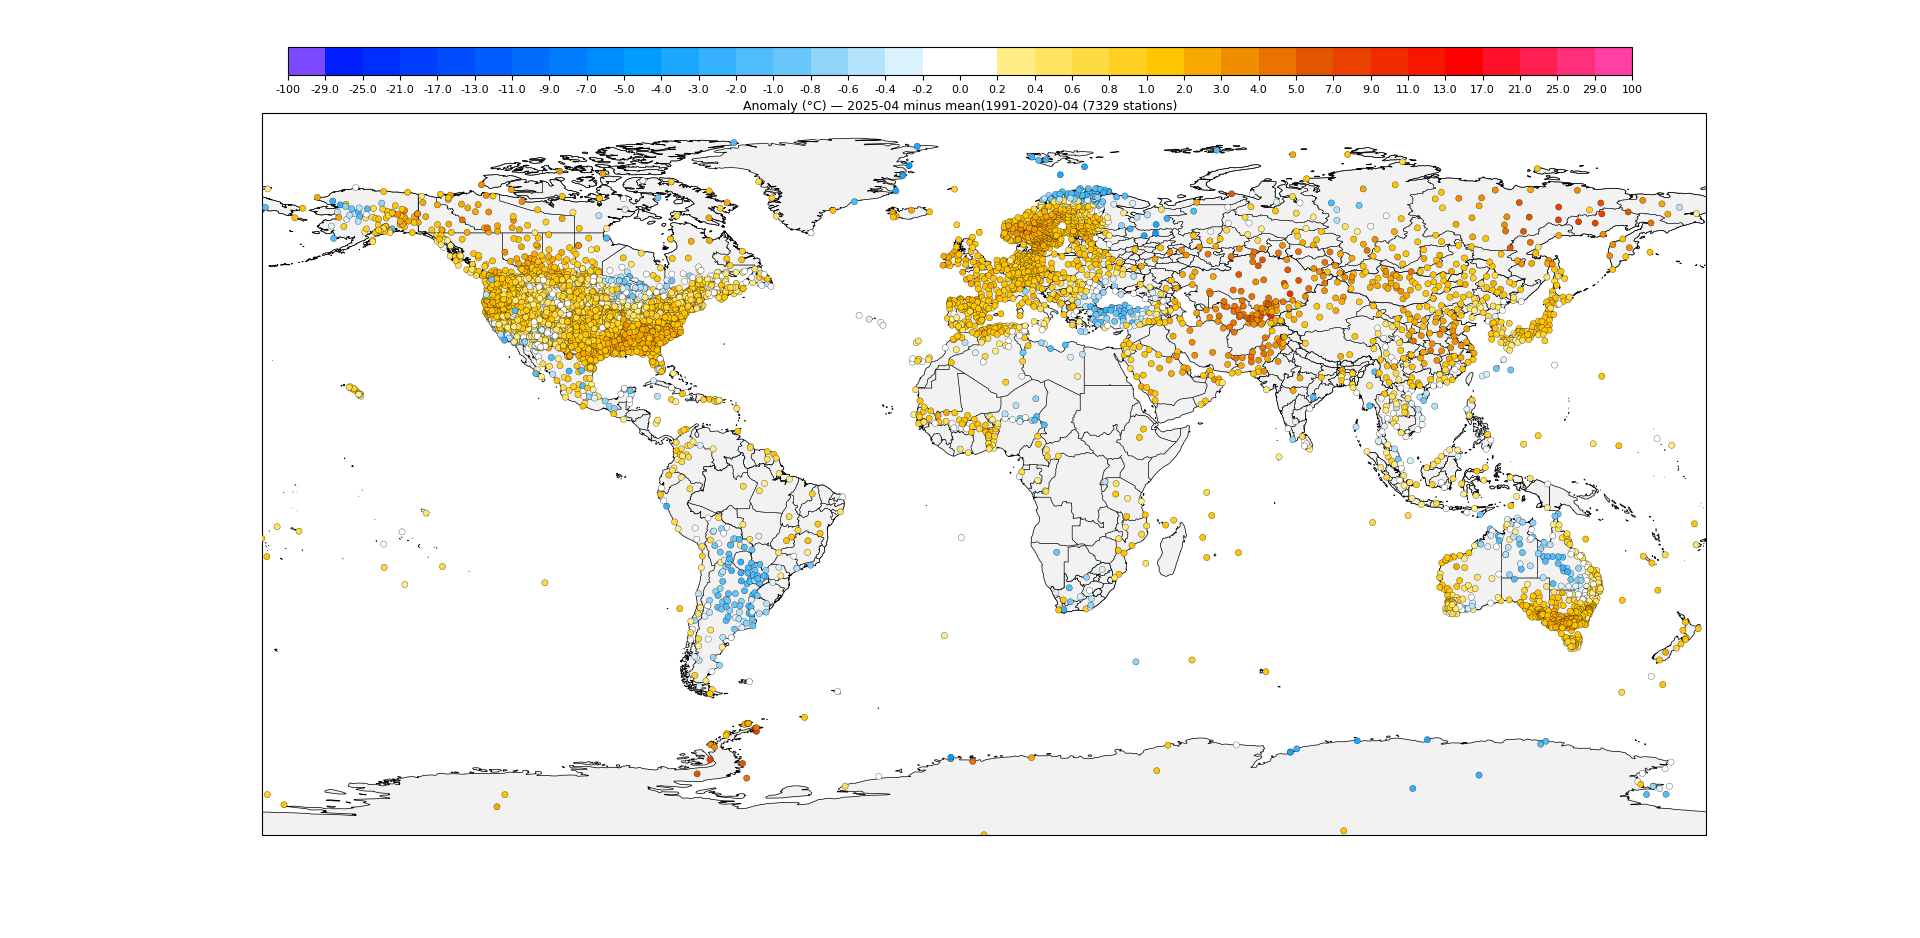
We still are not where we were last year In terms of station counts, as can see we are still missing about 1500 stations (although some more will trickle in later on), including many stations from Australia and the Nordic/Scandinavian Countries, as well as the obvious ones like Mexico and the sparse ones spread across from Africa.
Subboxes from latest run for April 2026:

ghcnm.v4.0.1.20260508:
117.68

Nothing notable to change any predictions (especially as I expect them to have already done the analysis yesterday and will be using prior runs).
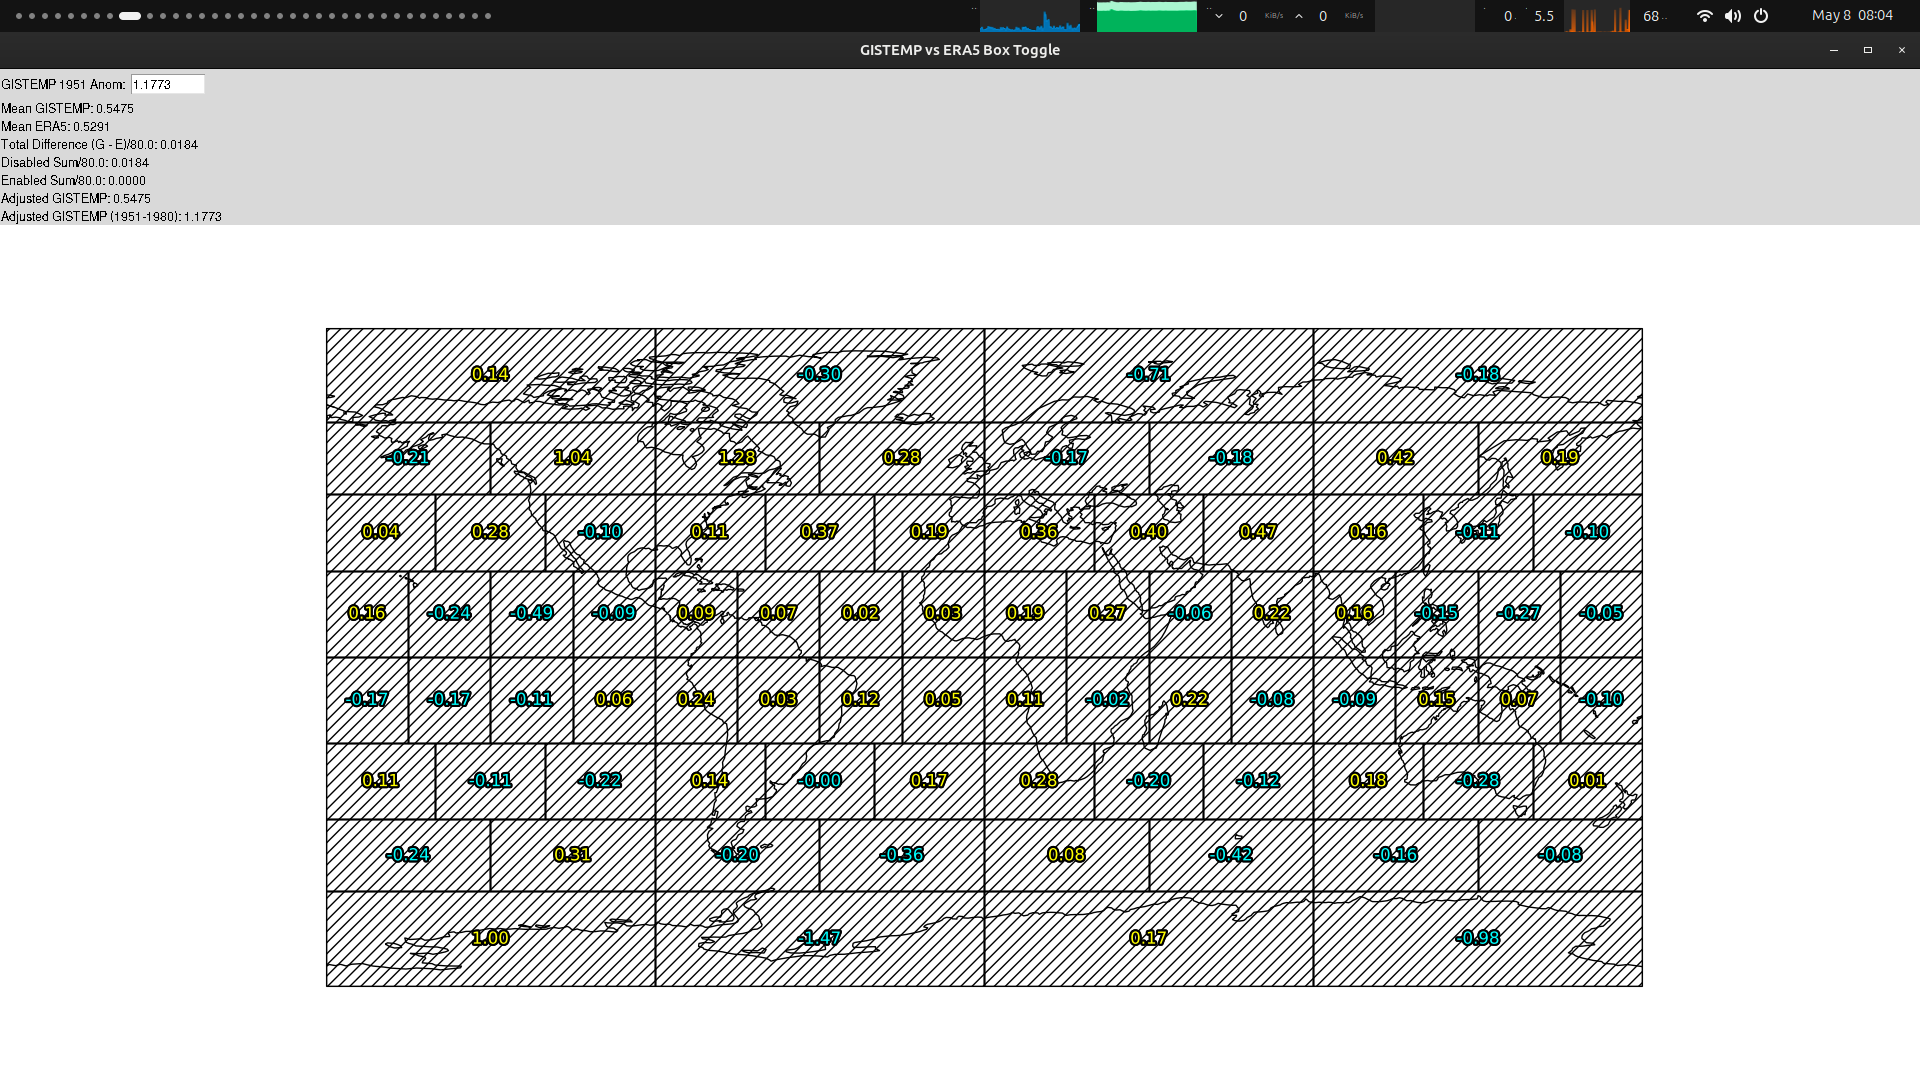
Even though its only about -0.0005 C cooler than yesterday I went through the box deltas compared to yesterday, and since there was some changes visually I wanted to confirm my reasoning for yesterday, as we got 400-500 more usable stations compared to yesterday.
~
Several more stations from Australia (its main 3 boxes along with more marginally ones further East with the addition of Vanuatu contributed to a net drop of about -0.002 C).
Also more from Africa (especially Libya, which effected 3 boxes, but mostly effecting the infilling of the more distant subboxes, taking -0.004 C from the 3 boxes it overlaps, with Tunisia and some other stations also contributing )
South America (including new stations from Chile and Paraguay, net +0.001 C)
And a couple more Antarctica stations (adding +0.003 C) (while one in the far right box being revised downwards that stretches out to negligbly cool the left most box as well).
More negligble: we also got some more stations from Canada and US (also somewhat noticeable is multiple Alaskan ones were revised) -- these in particular had nearly negligible changes compared to yesterday (i.e. a bit less than -0.001 C by examination of the box deltas compared to yesterday). A smattering of Mexico stations didn't change its box much either (~ +0.0005 C).
It was worth breaking this down to confirm reasoning from yesterday for future tail scenarios, since all the significant boxes that got cooler amounted to only ~ -0.007 C, with all the boxes that warmed contributed to only +0.004C. The difference between these combined are some other negligible boxes and rounding errors in comparison to the ~ -0.0005 C change in the actual value.
I believe this mostly confirmed my analysis from the last 4-5 days.
This shows this analysis would have actually mattered more in a closer month (like last February) if we hadn't got Elizabeth (from Antarctica) a couple days ago. (Probably can simply verify this by rerunning 20260507 it with a ghcnm modified without Elizabeth from last month).

ghcnm.v4.0.1.20260509:
117.78262
~
38 more stations from Mexico.

Since its scheduled for release on Monday and we have adequate coverage I see the chances of it not ending up in the 1.15-1.20 bin as nil now. And at least this time there doesn't appear to be any erroneous stations by various checks so I have high confidence in that.
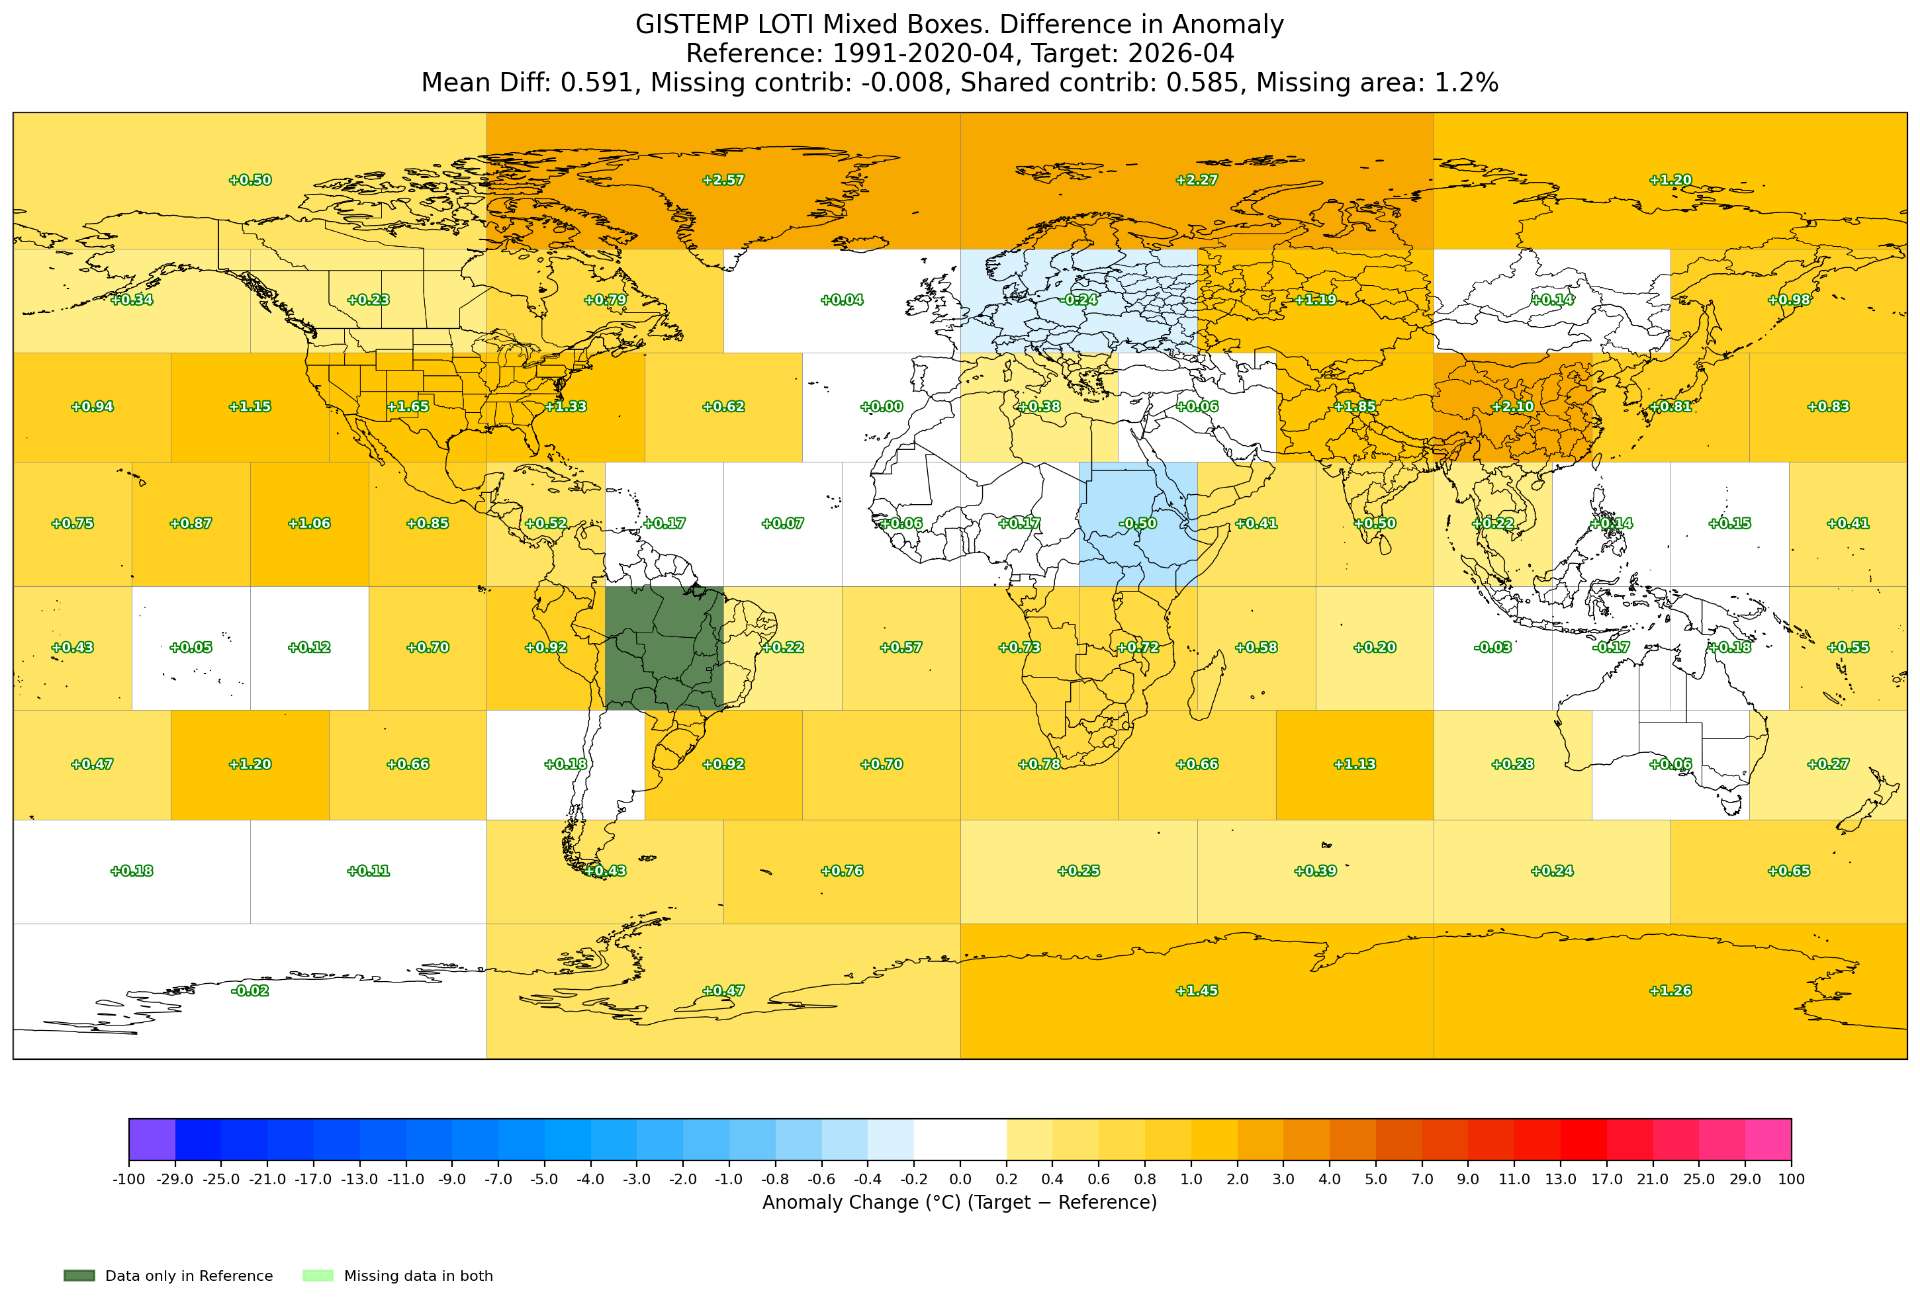
Subbox anomalies (1991-2020):
Box anomalies (1991-2020)
Gistemp - interpolated ERA5 box anomalies deltas (1991-2020):
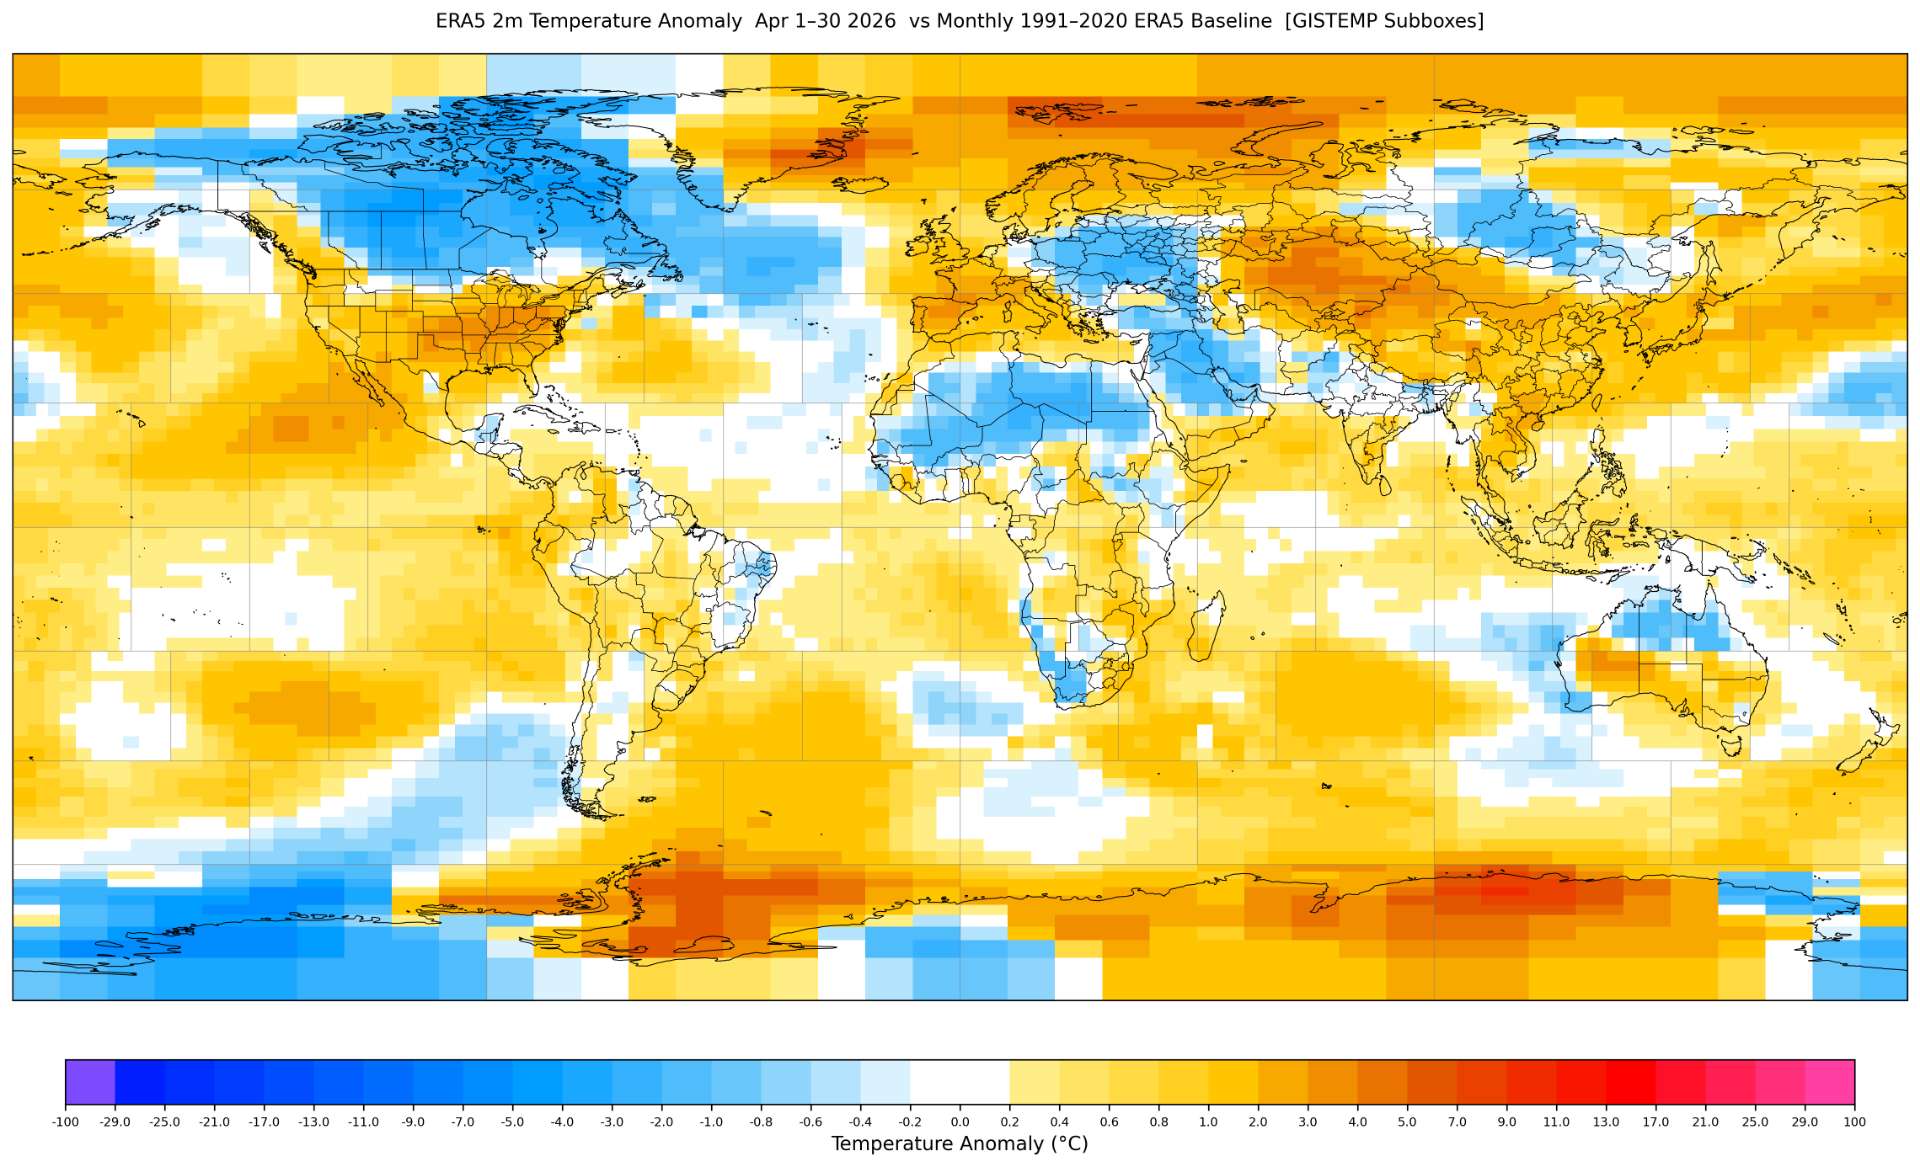
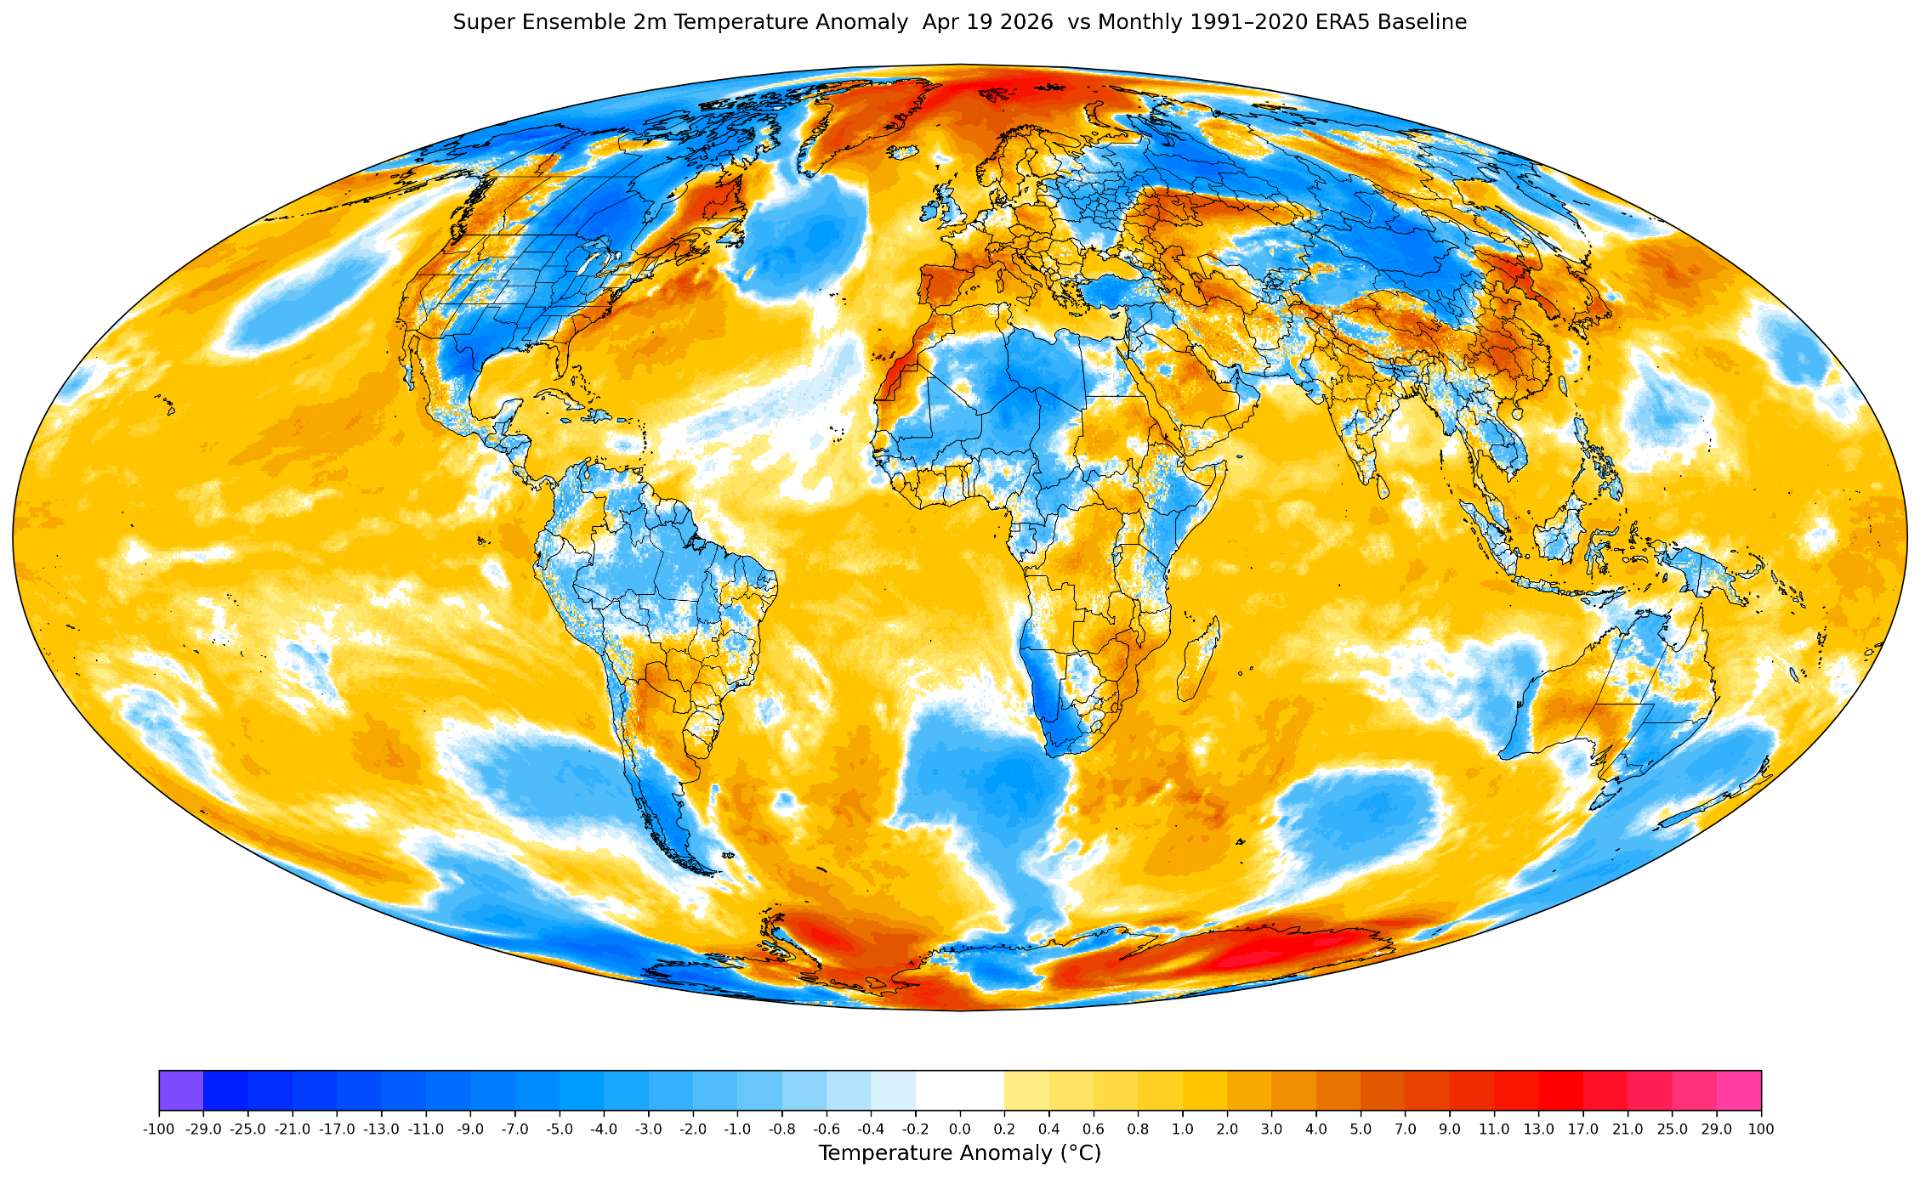
@zenarxy April anomaly has been cooler than March anomaly in last couple decades but this month looks like a repeat of last month at least spatially ... last 5 days missing so it will be warmer than shown, but the spatially warm/cold anomalies look somewhat similar.
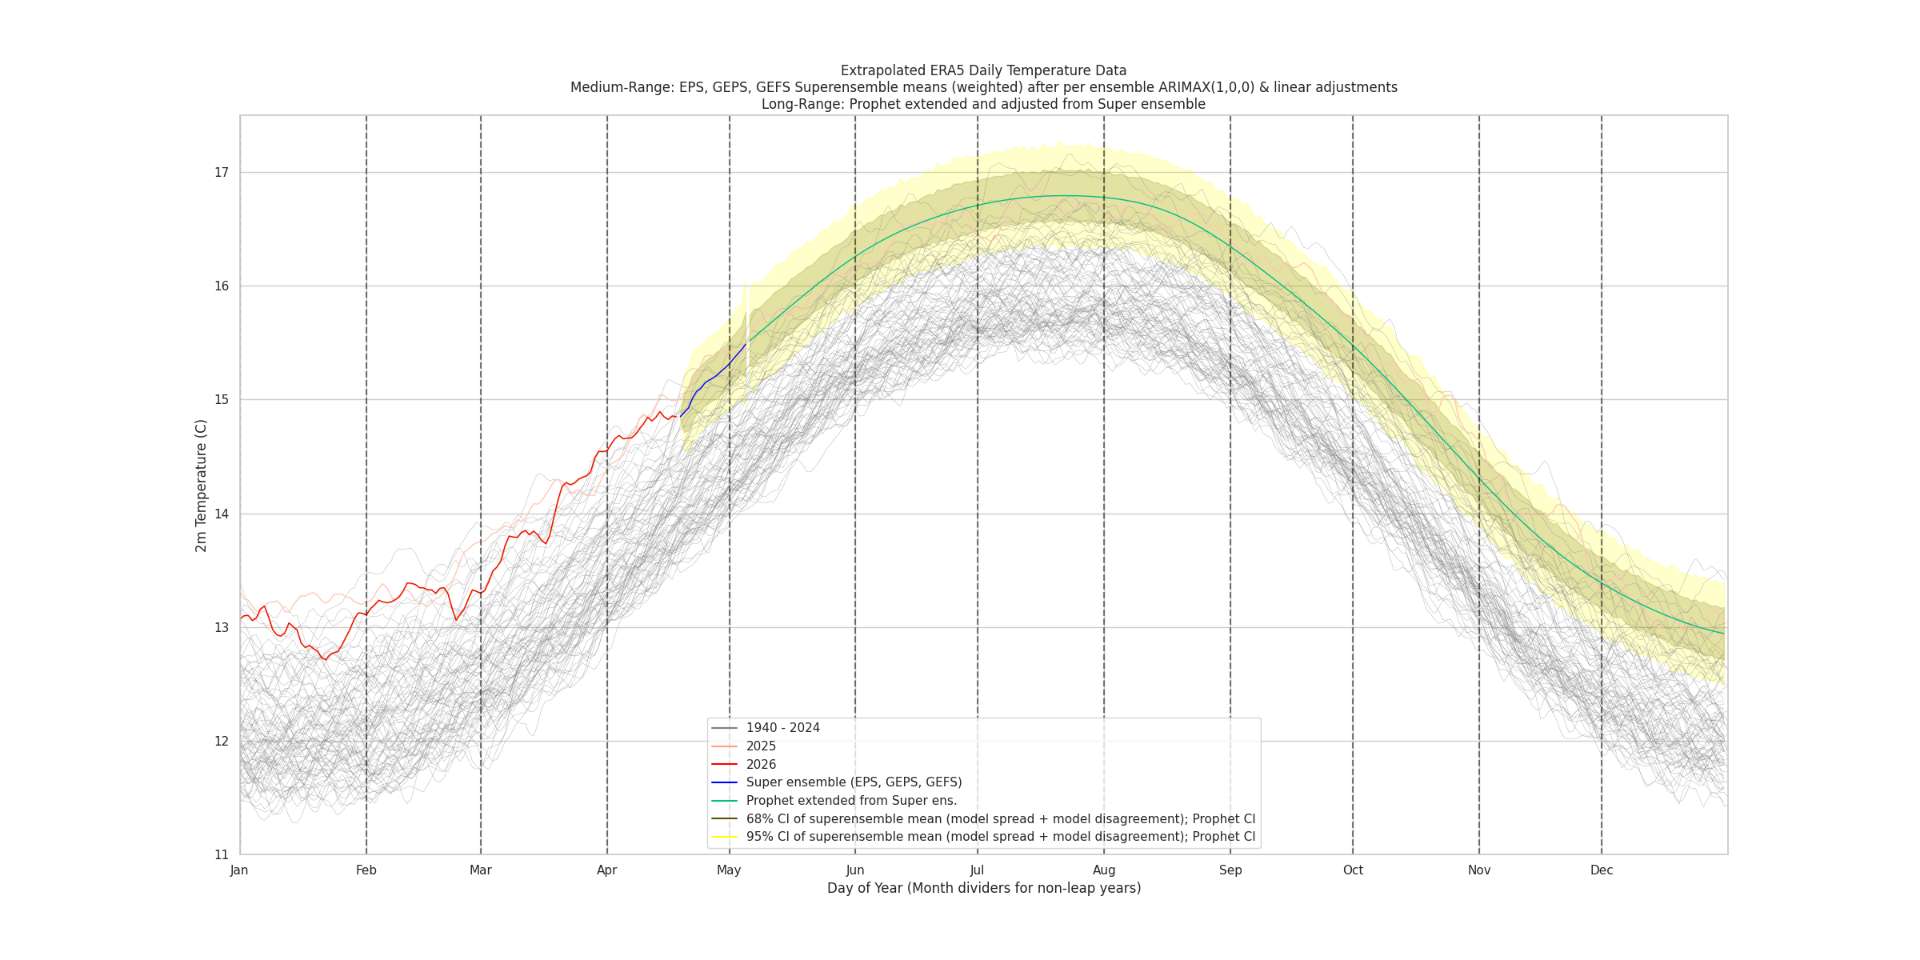
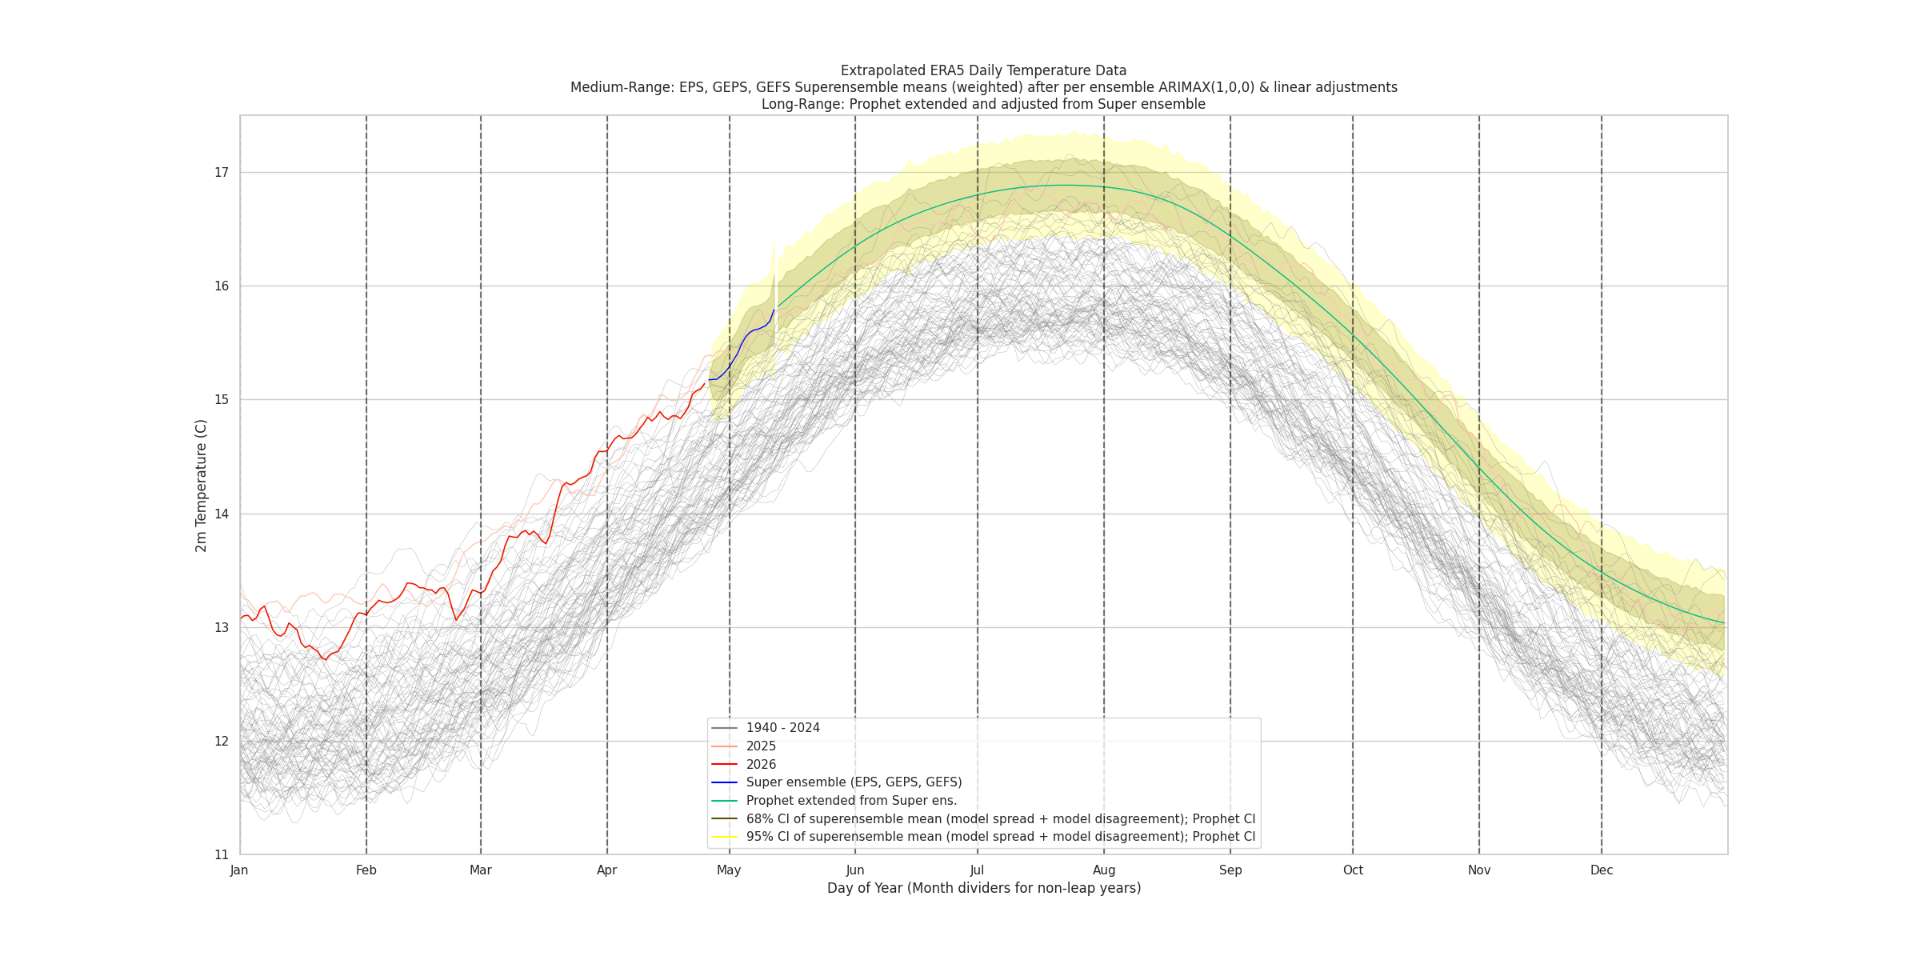
The medium range ensembles generally following the very basic climatological rise you'd get from a statistical model...

I've been on the cool side repeatedly for last several months, so I've updated my error adjustment likewise to include all my own past forecast errors now, rather than excluding a couple tails (this raises the adjustment to +0.02 whatever the adjusted superensemble gives rather than a further +0.01)...
I don't think I will make any improvements in the ERA5->GISTEMP model as it stands for a long while -- until I can do a MCS type simulation essentially over station availability to calculate subbox/box biases/variances -- this means getting the weights for each station for each subbox & box for each year and then figuring out how to map ERA5/ECM onto those weights, in order to produce some spatial model that outputs bias, variances for the gridded data and incorporating that into my already complicated super ensemble pipeline sounds like a nightmare).
edit: Compared to forecast 4 days ago, notably more modest warm anomaly across central/eastern US and also generally elsewhere in the western hemisphere, but more anomalously warm poles (Greenland and Antarctica); However, looks like generally, northern Africa and Asia has warmed up a bit.
@zenarxy your bias numbers you have been putting out are relative to some objective ERA5 t2m ->GISTEMP model?
Based on my superensemble, the ERA5 t2m should be around 14.92 C for April 2026 (there is a slight adjustment upward based on each forecast day's long term super ensemble bias (relative to what validates in ERA5) that moves it up +0.02C from 14.90) in the current run).
For comparison (two closest years for ERA5 t2m for April are 2025 and 2020)...
April 2025: ERA5 t2m was 14.96 C
GISTEMP LOTI was 1.24C
April 2020: ERA5 t2m was 14.88 C
GISTEMP LOTI was 1.12 C
Currently the forecast puts it right in the middle of these in terms of ERA5 t2m, imlying a value around ~ 1.18 C just using these closest two data points.
~ This seems the simplest analysis one could do... ~
~~~~~~~~~~~~~~~~~~~~~~~
rant...
However in the usual ERA5->GISTEMP model I do use I adjust for ERA5 temp tries to detrend based on the absolute value of the ERA5 temp over time when applicable. I did a sensitivity type analysis and re-enabling the scorer picker (rather than just choosing the monthly model, let it choose the yearly one, which I disabled sometime last year, based on p-values) over ERA5 cutoffs starting from 1940,1951,1961,1971,1991 (1981 yielded no valid model), yielded center points (not finally adjusted by own forecast errors) of: 1.138, 1.177, 1.176, 1.146, 1.151 (the ~1.177 pair use the yearly model which has almost no downward adjustment); the mean is then 1.1576 (this is not far from the 1.163 I get after adjusting the 1.138 upwards by own forecast errors).
~
The motivation for this was that I did discover an error today in the same ERA5->GISTEMP model in the usual notebook I've been using for a long time that would have been biasing it slightly high actually for forecasts prior to the final ERA5 data (not actually effecting the final predictions at the end of the month, only further out, that would tend to make the forecast slightly high, i.e. 1.148 instead of 1.138 C; it was a weird bit of interpolation code that did not calculate the weights properly for the penultimate adjustment from the super ensemble bias on the forecast data only); fortunately I keep all of this separate from the actual ERA5 forecast data so none of the data I collected is effected.
That said, given the normal monthly model I've been using looks fine now, for the moment I will reference 1.163 C (the value after adjusting for past forecast errors using the usual 1940 cutoff).
~
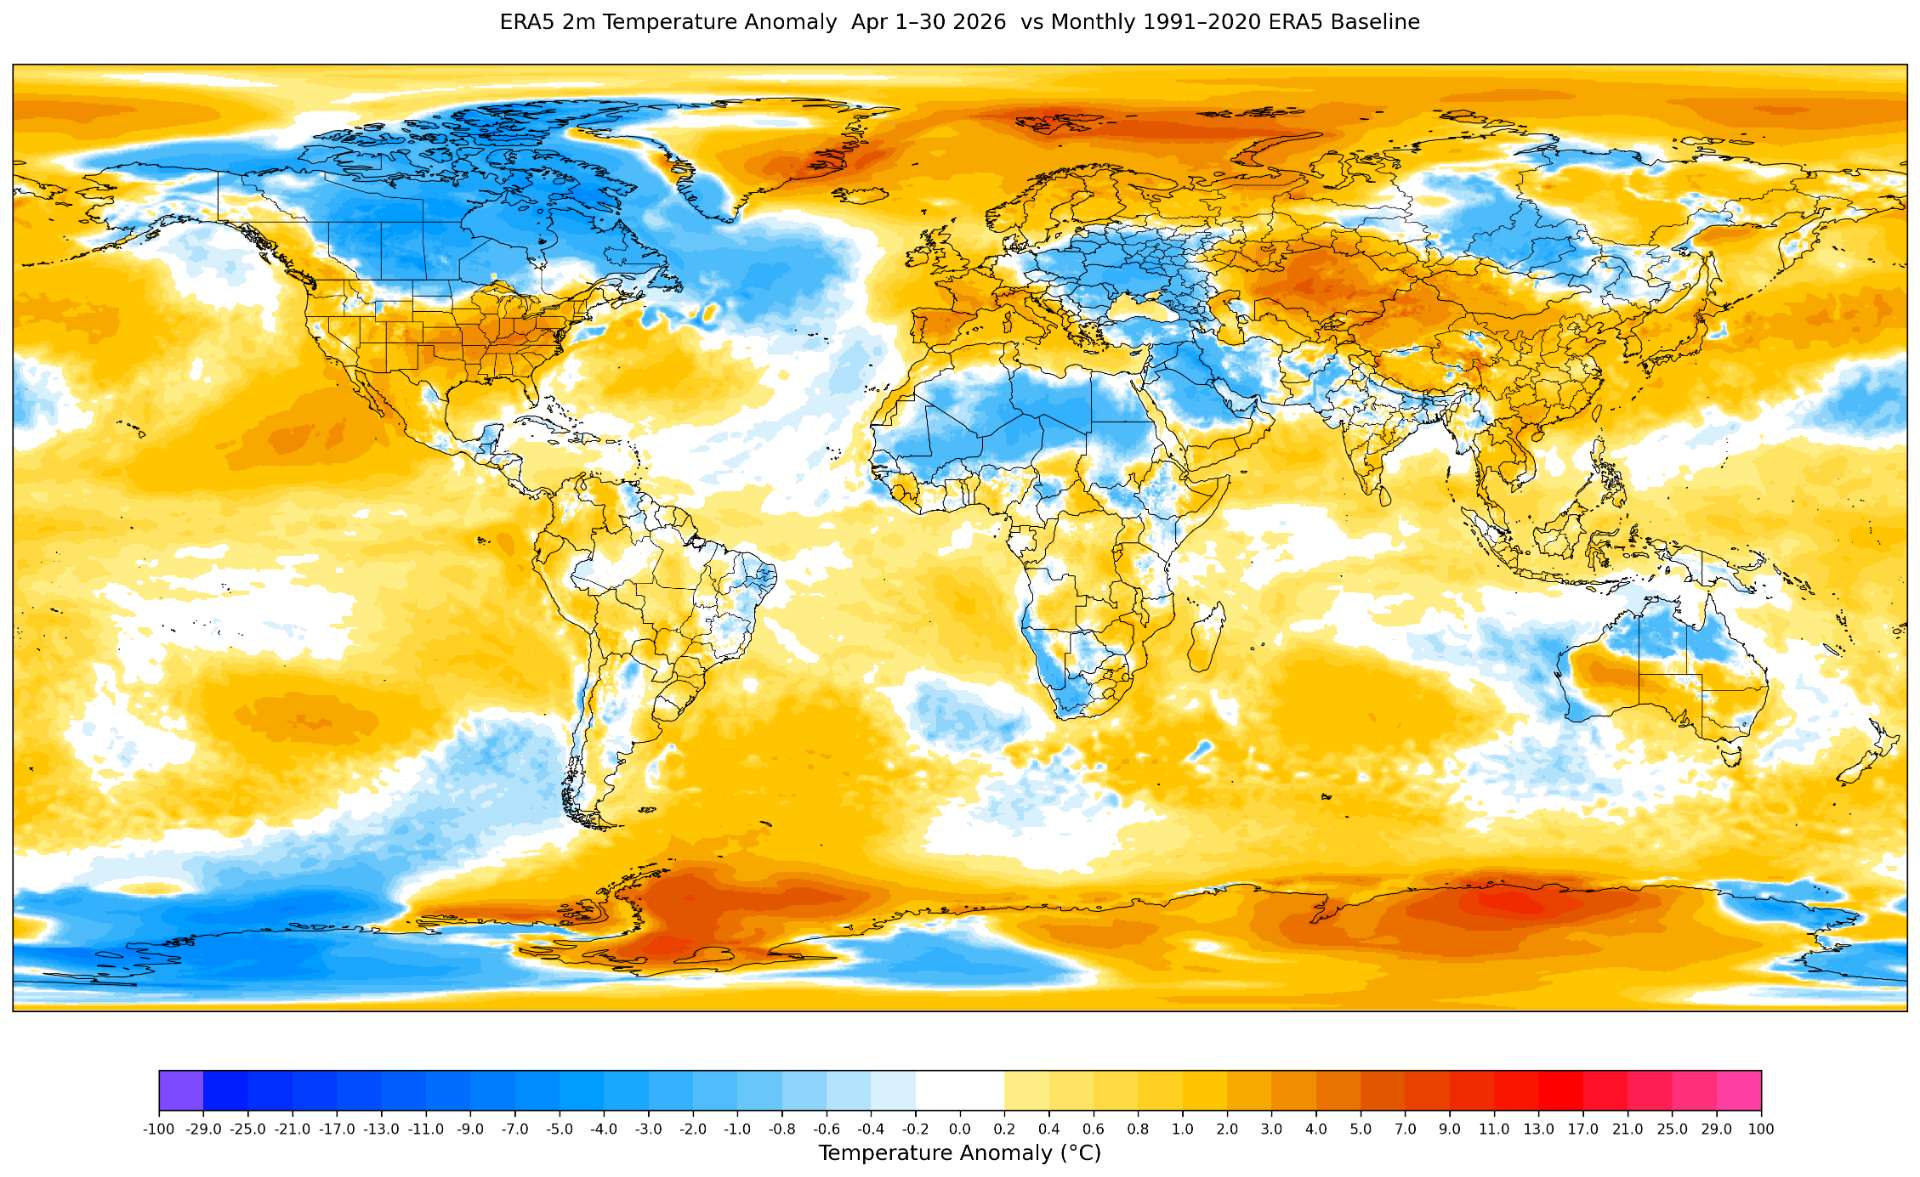
Looking at the spatial data (below)....
Assuming a prior of a positive bias seems warranted given the last few months as I have been forecasting under, although this is from the extreme warm anomalies this winter in the NH, however the ERA5 t2m picture paints a modest warm anomaly in the 1991-2020 baseline compared to the last few months.
Breaking it down by usual suspects: I do expect the two boxes for Canada overlapping the continental US to be warmer than ERA5 shown below. The top left Alaska-Canada Arctic box is hard to tell since the subboxes from Russia near the pole will be very anomalously warm and influence it good amount. So, net warmer for these couple boxes.
For the Antarctica cold box its hard to tell (the single station should return a cold anomaly and make the box cold, but is not in the location of the most severe cold anomaly for the region, however it will infill alot of what ERA5 sees as warm anomalies as cool) so eyeballing that particular box from ERAE5 t2m and the station temp, net it looks close enough not to be a factor relative to the t2m. However, the other 3 Antarctica boxes look like they generally will be cooler in GISTEMP than what's suggested by ERA5's t2m based on what stations I expect to be available. So net cooler for Antarctica than suggested by ERA5.
For Namibia, it looks like it will be infilled on the warm side from the two South Africa stations we got last time (even though the t2m box anomaly is warm below from the ocean temps, it should become slightly warmer, but can't say how much). So net slightly warmer for boxes overlapping SW Africa.
Similarly, I recall ocean ssts was biased on the warm side compared to t2m last month. It seems like this should continue this month also. This should be the greatest net warmer contributor.
Subjectively, the usual suspects together point towards a moderate cool bias over land, and a warm bias for the ocean over ERA5 t2m relative to the combined subboxes.
~
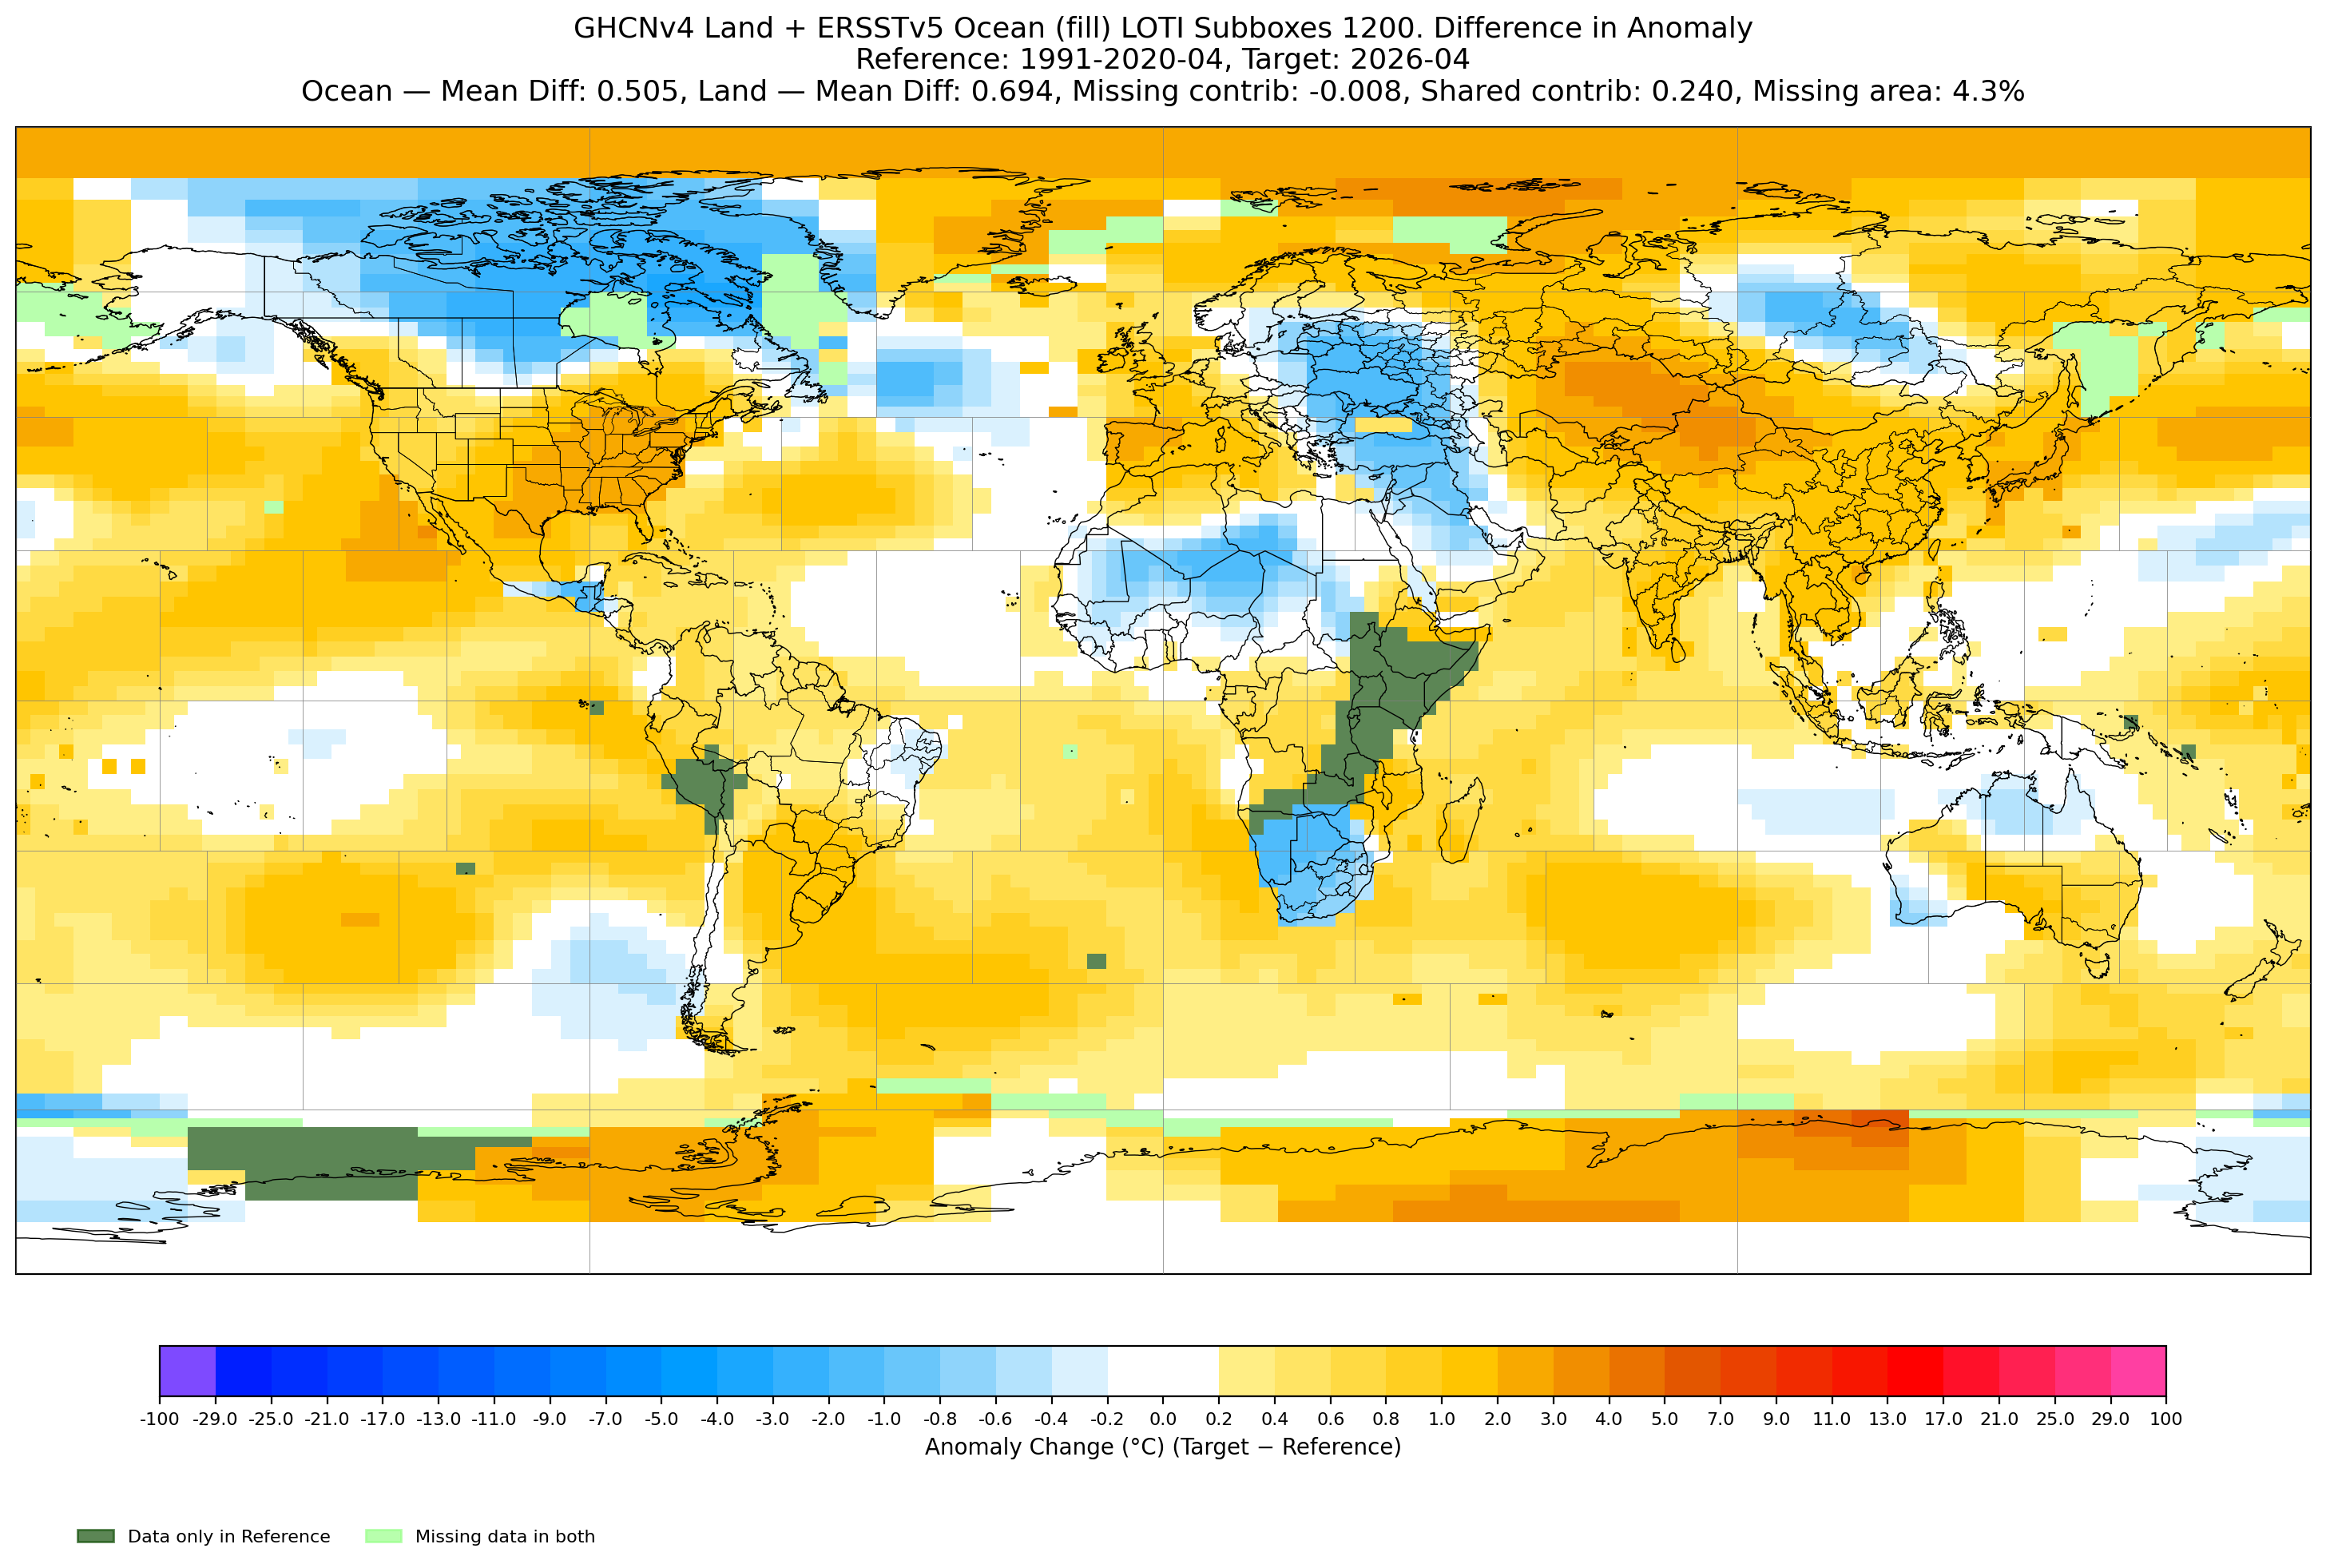
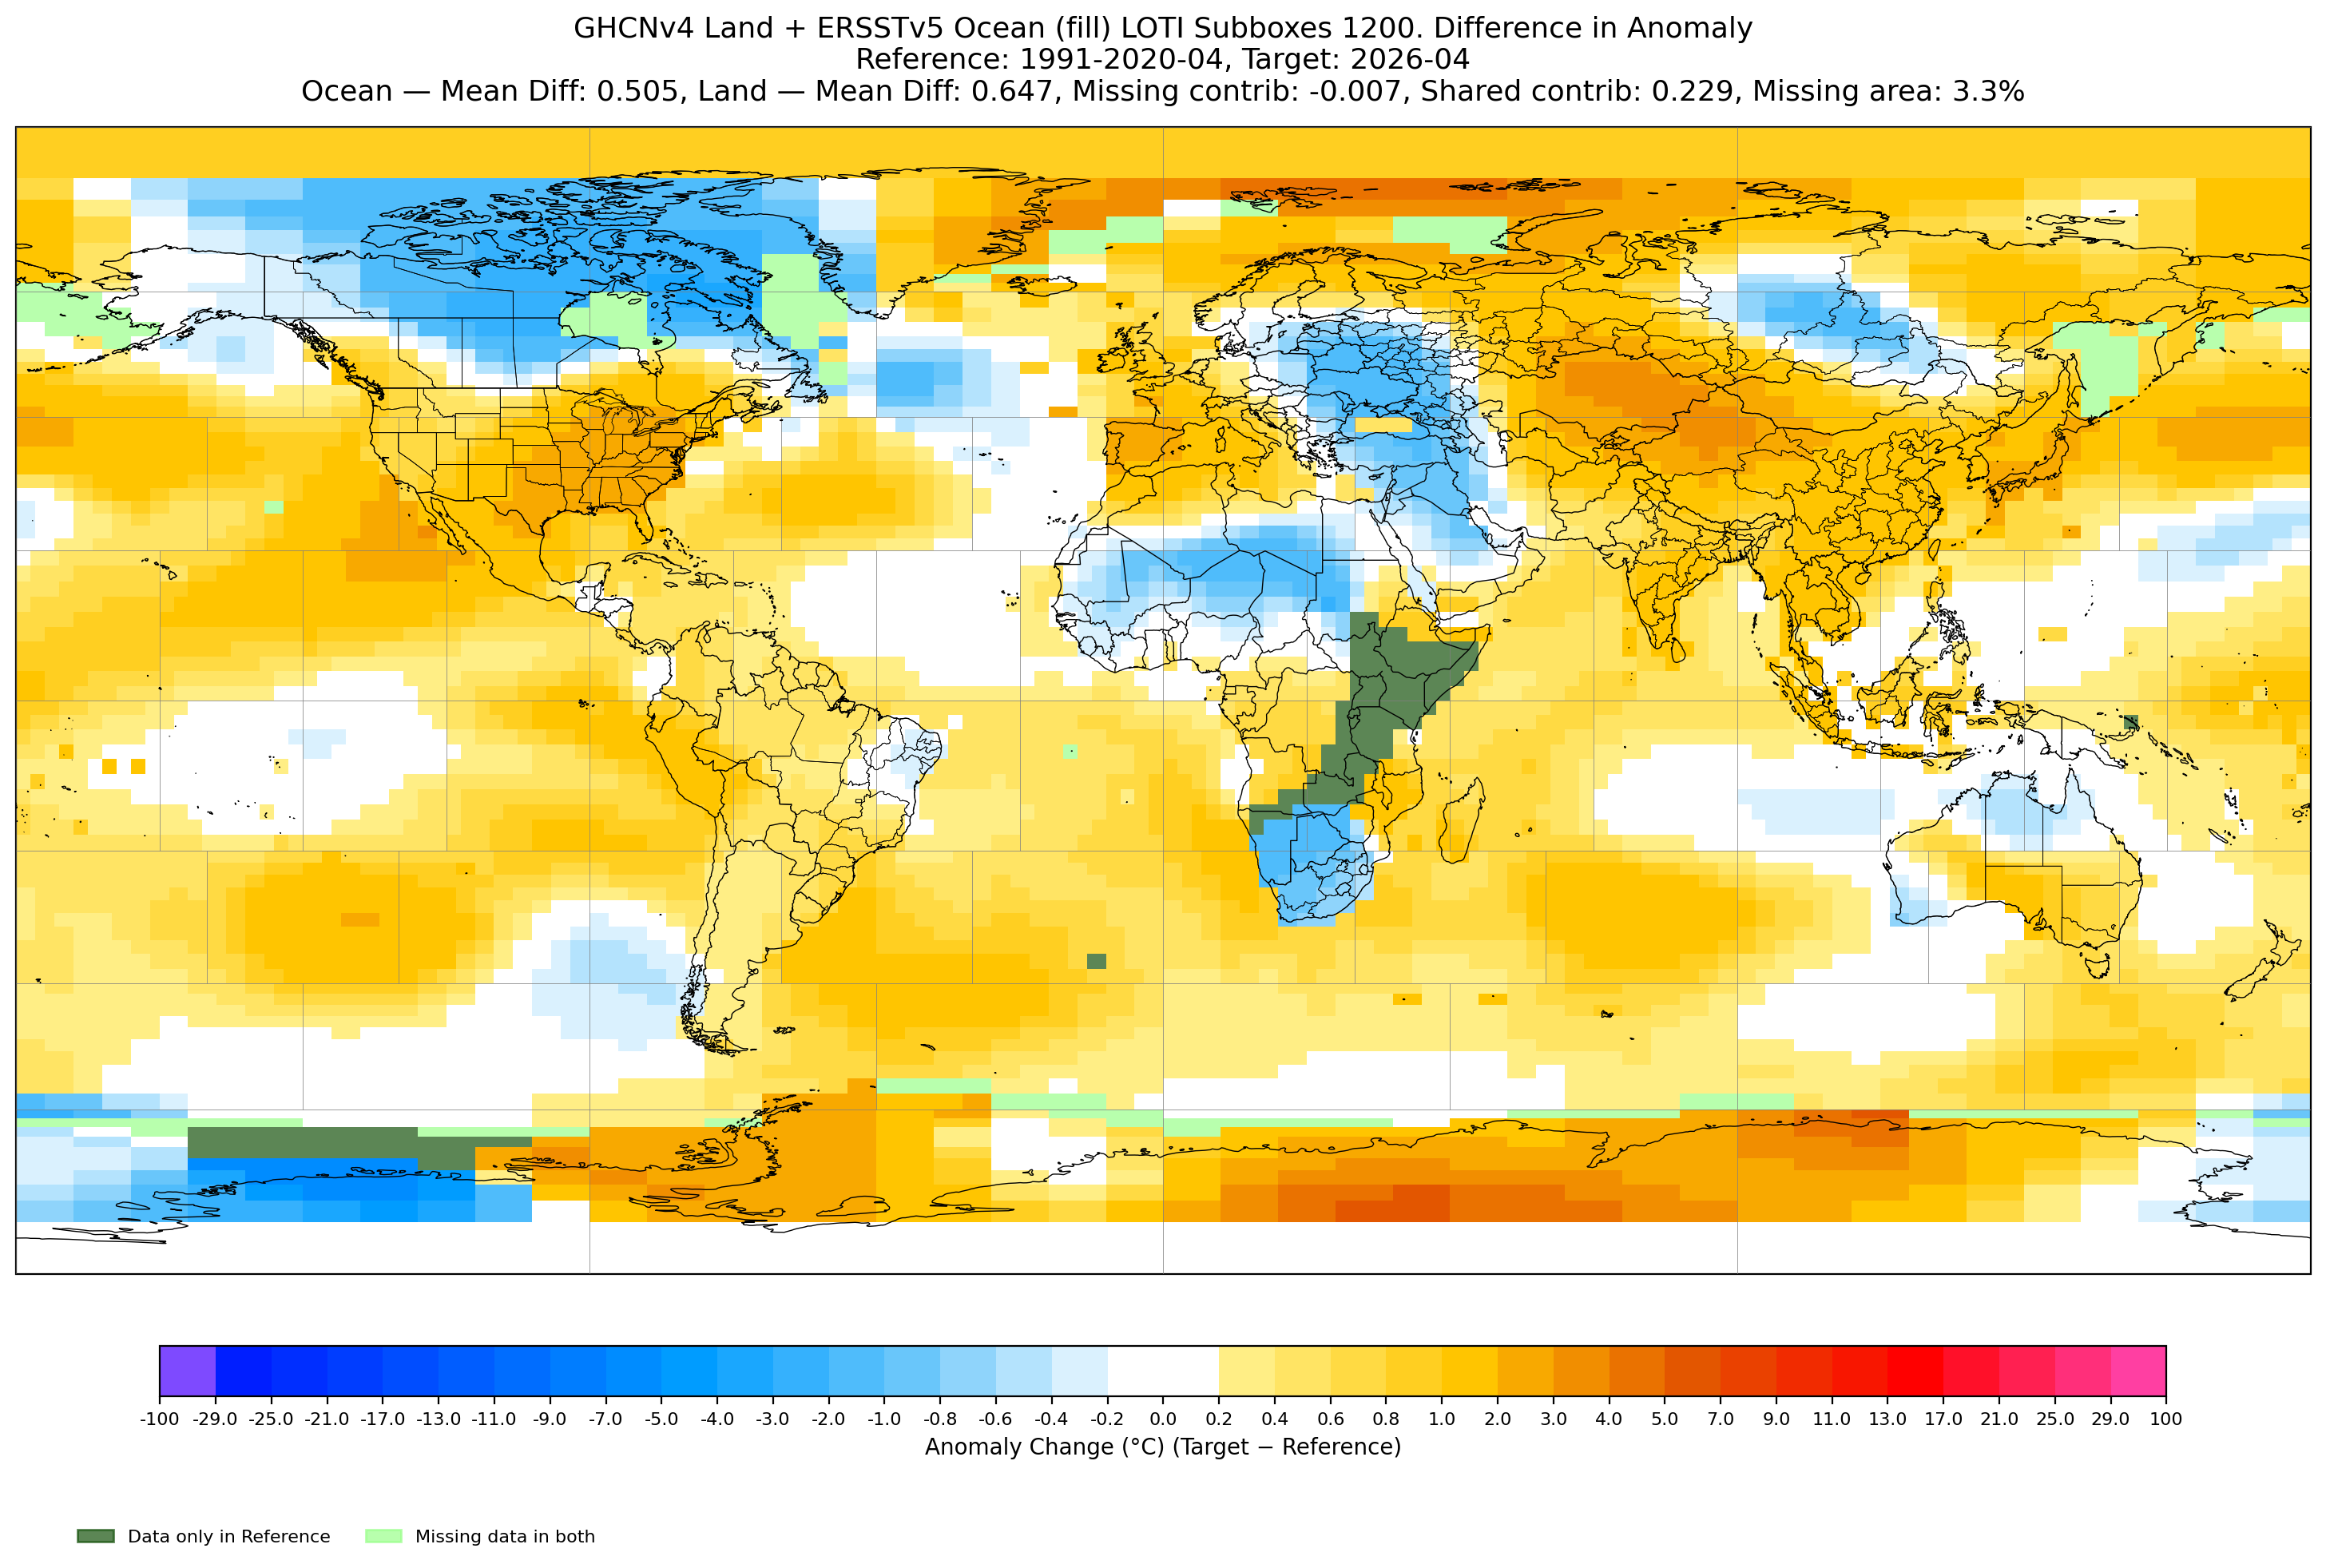
Going back and looking at the subbox anomalies, separated by land/ocean for last month (to compare it against the other two closest years), March 2026 (these are all 1991-2020 baseline):
[LAND] Mean_diff=0.953, contrib_missing=-0.025, contrib_shared=0.316, green_area_1e3km2=15812.0, missing_area=8.3%
[OCEAN] Mean_diff=0.454, contrib_missing=0.000, contrib_shared=0.280, green_area_1e3km2=0.0, missing_area=0.0%
the land anomaly for the subboxes was +0.95 C and the ocean was +0.45 C relative to the 1991-2020 baseline for gistemp loti... (this will be different than the actual final gistemp global loti computations, due to the compositor which would weight the subboxes differently, and also finally apply different debiasing for certain bands):
for April 2025.. (1991-2020 baseline)
[LAND] Mean_diff=1.014, contrib_missing=0.000, contrib_shared=0.375, green_area_1e3km2=637.6, missing_area=0.3%
[OCEAN] Mean_diff=0.375, contrib_missing=0.000, contrib_shared=0.230, green_area_1e3km2=0.0, missing_area=0.0%
for April 2020... (1991-2020 baseline)
[LAND] Mean_diff=0.784, contrib_missing=-0.000, contrib_shared=0.290, green_area_1e3km2=637.6, missing_area=0.3%
[OCEAN] Mean_diff=0.318, contrib_missing=0.000, contrib_shared=0.195, green_area_1e3km2=0.0, missing_area=0.0%
I went back and plotted the data I extracted from the subbox anomalies from the ocean subboxes and the land subboxes, and the inertia and trends in the ocean anomalies is much clearer..
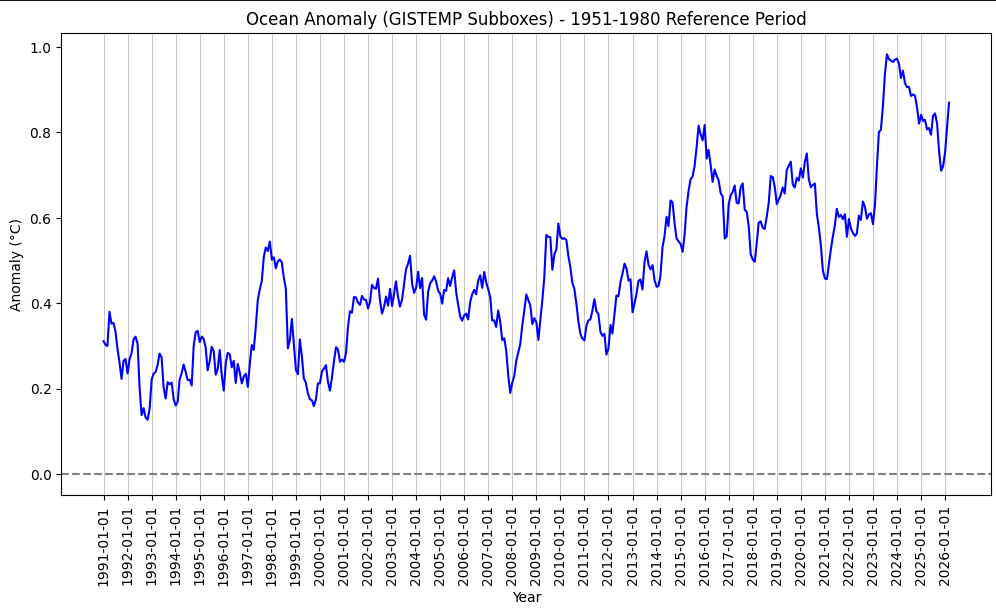
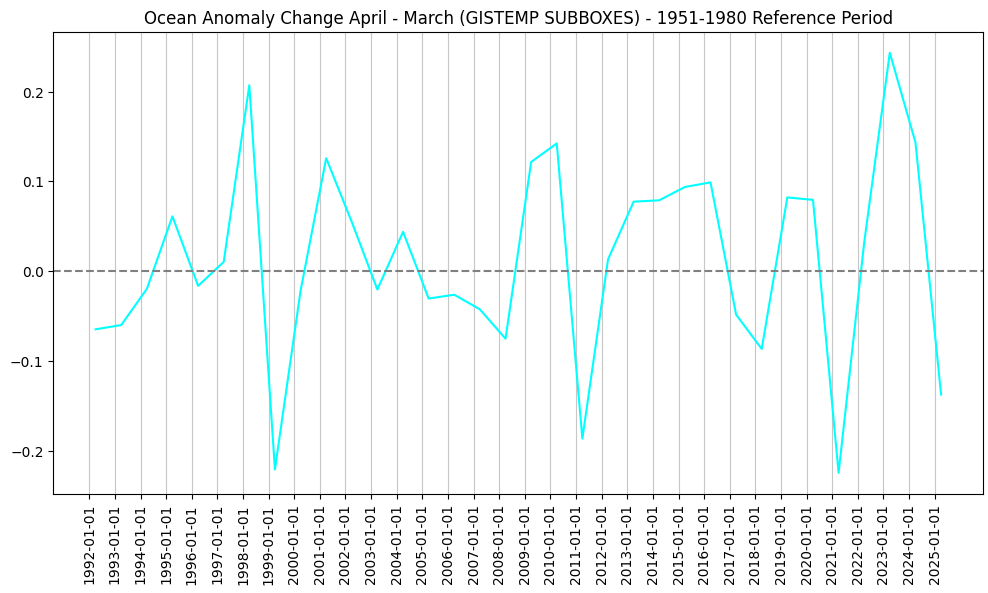
For reference... The April-March change is usually neutral, with a stddev is ~ 0.11 C, but given the situation I would expect the April-March change to be neutral-to-positive than negative given the situation, which implies a ocean anomaly warmer than 2025.
So, it looks over land 2020 might be a better guide as far as biases as the GISTEMP boxes as there are more scattered cold boxes in the NH (although the Alaska box will likely be infilled on the cool side), while for the ocean 2025 should be closer to 2026 of course.
So for April 2026 I think based on the above and below images, the land anomaly will be less than 2025 and possibly also 2020, but as for the ocean anomaly it seems from various sources (the EPAC in particular) that 2026 will be warmer than April 2025..
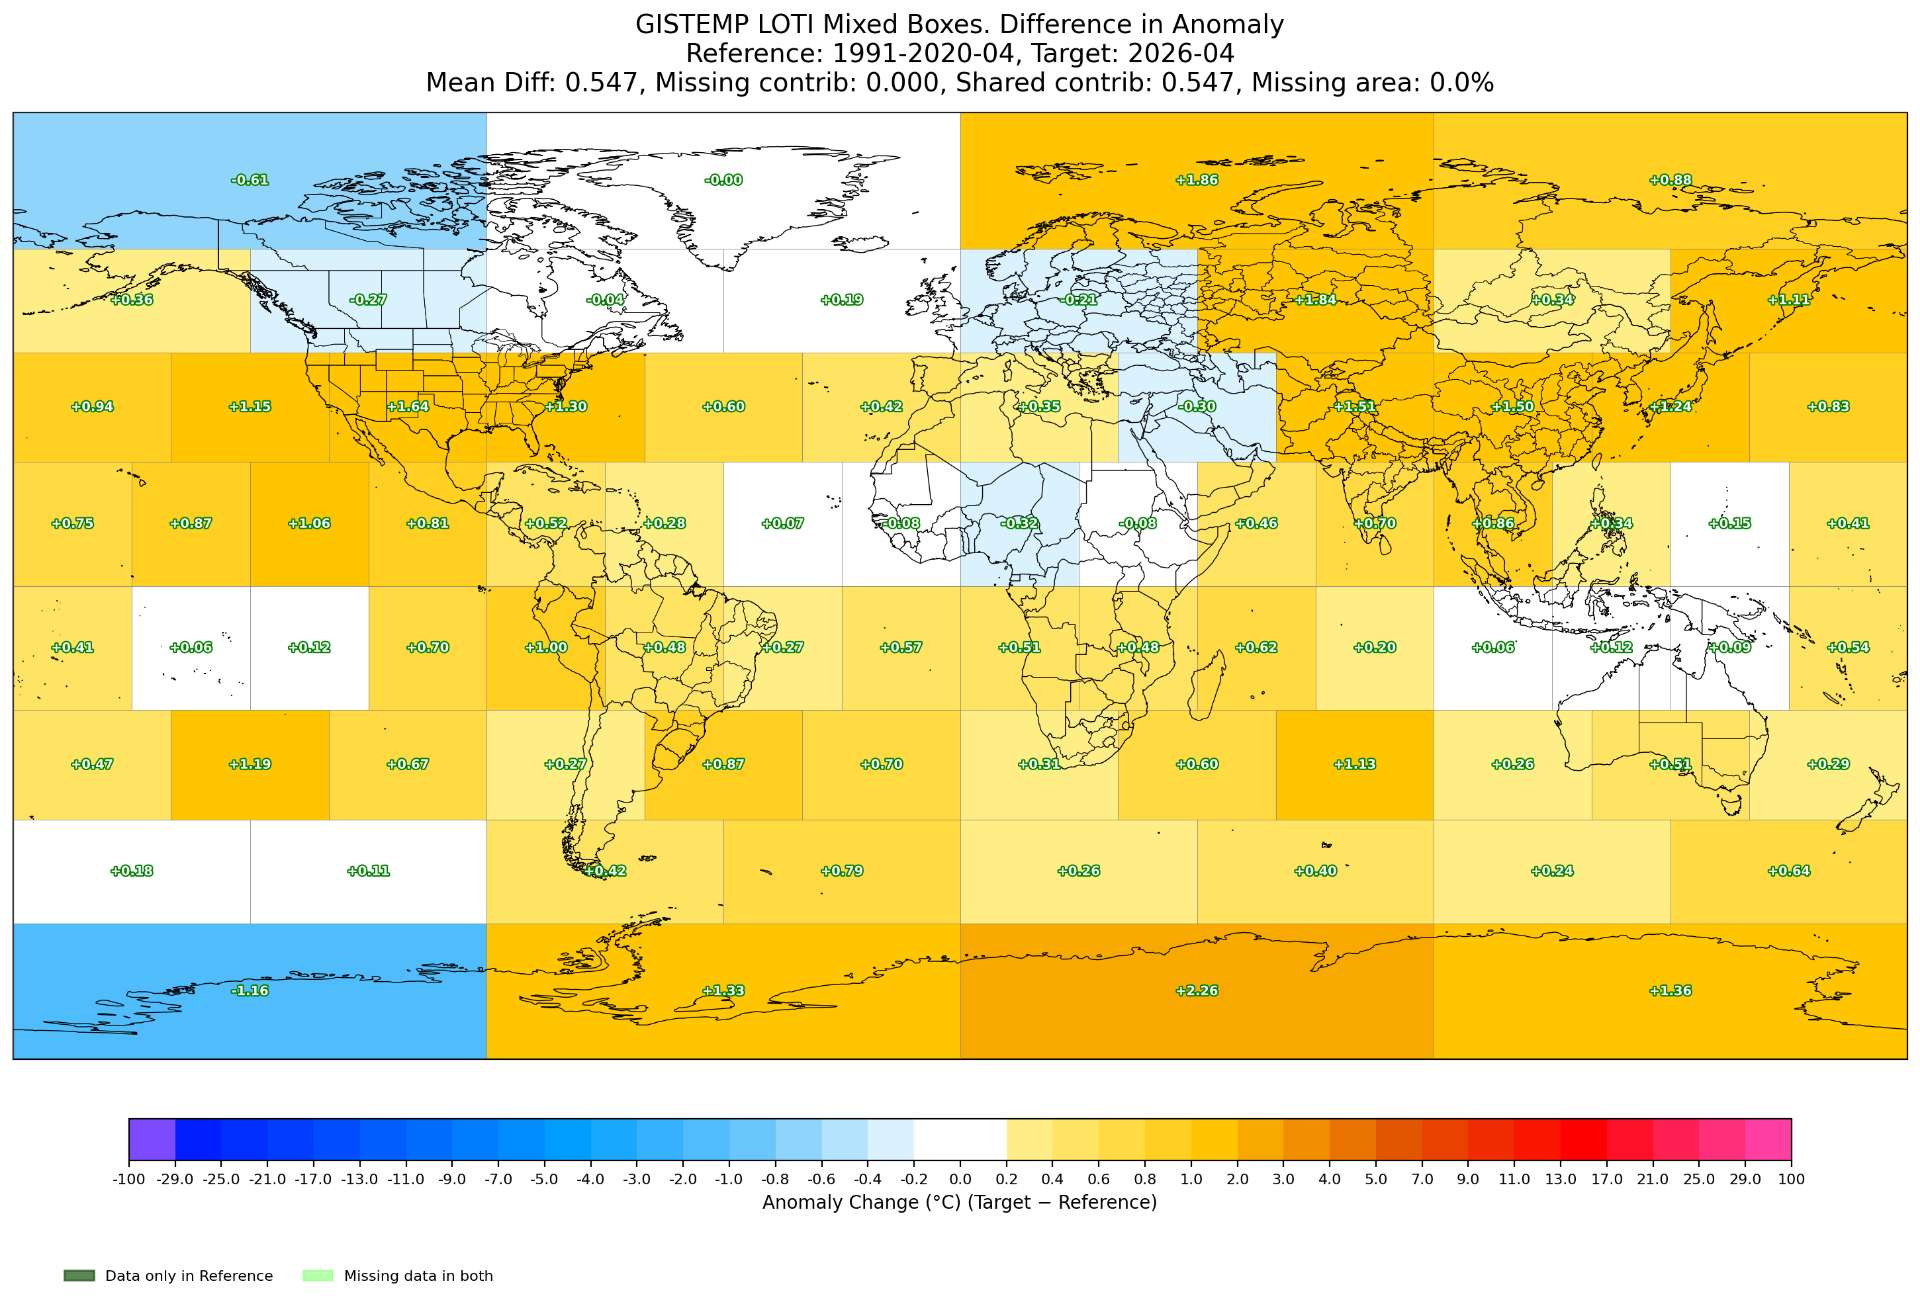
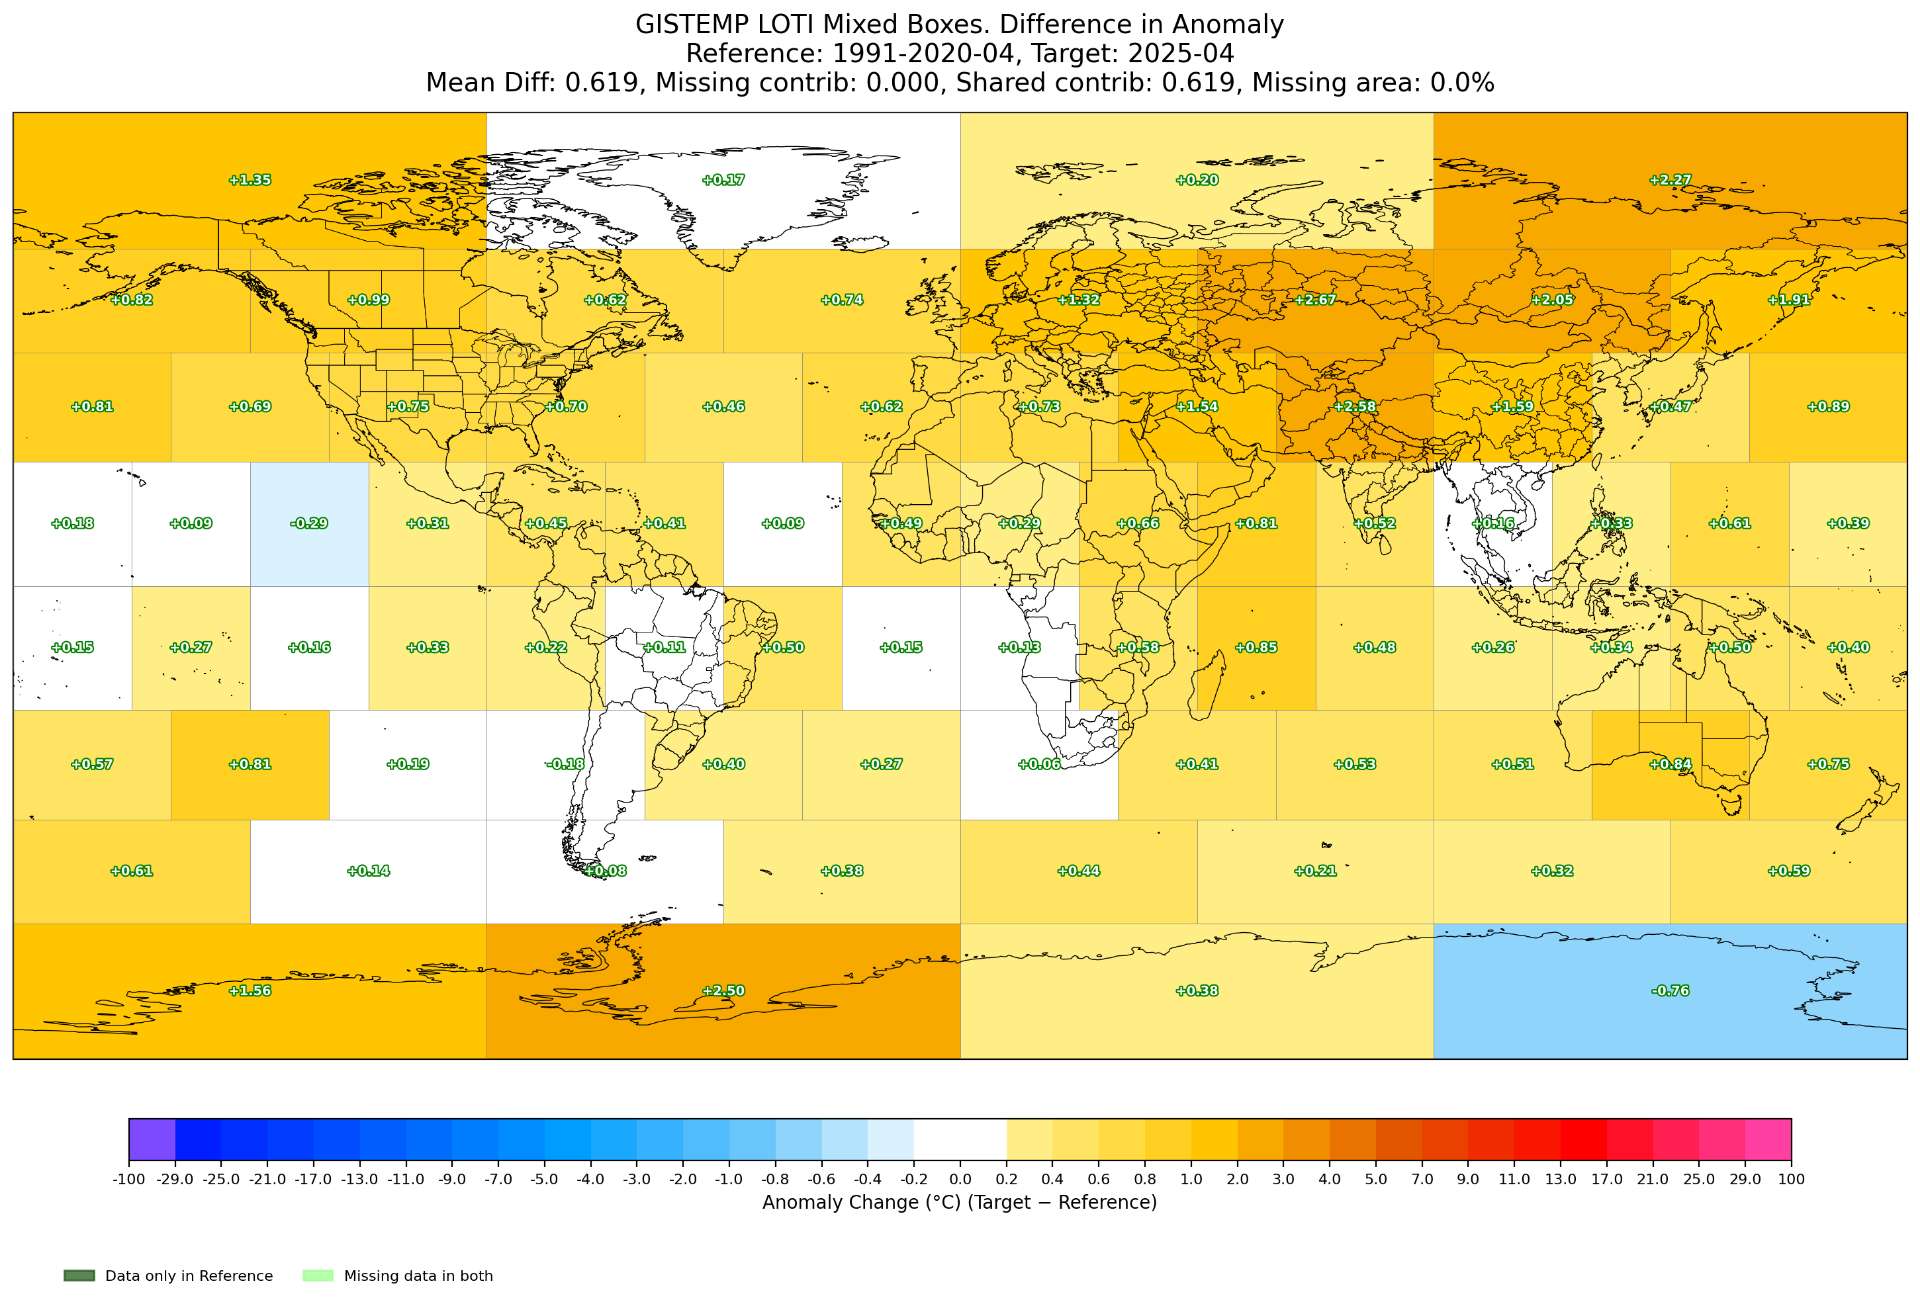
Interestingly when I compare the ERA5+forecast box interpolations to the GISTEMP Box values (i.e. the mixedBX npz) for April 2020 and 2025, on the differences between each box (i.e. taking that there is zero bias between the anomalies for the ERA5 interpolated boxes and the GISTEMP boxes, which definitely isn't the case), however, both data suggest a value of ~1.22 C (1.216 and 1.217 C respectively). This is a partly separate data computation (still relies on superensemble biases calculated, but then adjusts a gridded ERA5+superensemble and interpolates directly). I am not sure if its a coincidence that they line up so well, or whether this is superior to the other method I've been using -- it is only 2 data points: (GISTEMP 2025 - (ERA5&superensemble) 2026 April boxes, and for GISTEMP 2020 - ""; i.e +# means colder now )
I then looked at the same type of differencing for the actual GISTEMP loti values for April 2025 and April 2020 compared to ERA5 for the same months, and the differences were +0.017 and -0.025 respectively for those suggested values (so it doesn't seem the ERA5 interpolated to these boxes is all that terrible from these two samples).
Compare this to (including own forecast error adjustment of ~ +0.02 C) the ERA5->GISTEMP model that I am using has an actual (hindcast) error for 2025 and 2020 respectively of +0.038 C and -0.001 C.
Intuitively, from these two samples suggests that 1.163 C from the ERA5->GISTEMP might be low (suggesting nudging up to 1.18 C), while the suggested value of 1.216 C might be a tiny bit high, nudging it downwards to 1.21 C; the latter is close to the yearly model that doesn't have the absolute ERA5 temp monthly adjustment).
It is interesting since it provides a simpler, alternate method I haven't tried before (since I didn't have the gridded super-ensemble forecast until recently) that might be more productive than a global mean -- i.e. rather than developing a model that tries to simulate the biases at each step based on station availbility, sum the differences of the anomalies at the box level for the gistemp-box interpolated ERA5 target year against gistemp box anomalies for each reference year (each difference being a sample), and then take each sum against the actual LOTI values to get a final value. This seems more doable than my previous idea, but don't know if this will pan out; at the very least I would like to try to get trends over time for each box to see if that reveals any interesting patterns.
~~~~~~
Global temps for the month's forecast have only increased by about 0.01 C in the last day, but whatever apparent bias there might be has also probably gone up now a bit: more of the west coast of US is warmer than a couple days ago (which should bias more of Canada's fewer stations even warmer with homogenization & compositing), Kazakhstan and Russia have warmed up a bit, while parts of Europe have gotten slightly cooler.
The amount of differences in the gistemp boxes is far less compared to last month (especially as the land anomalies are milder), but last month we did have a 0.04C warmer ocean if I recall compared to ERA5 t2m over the same subboxes), and that probably should continue this month as we transition to El Nino ...


~
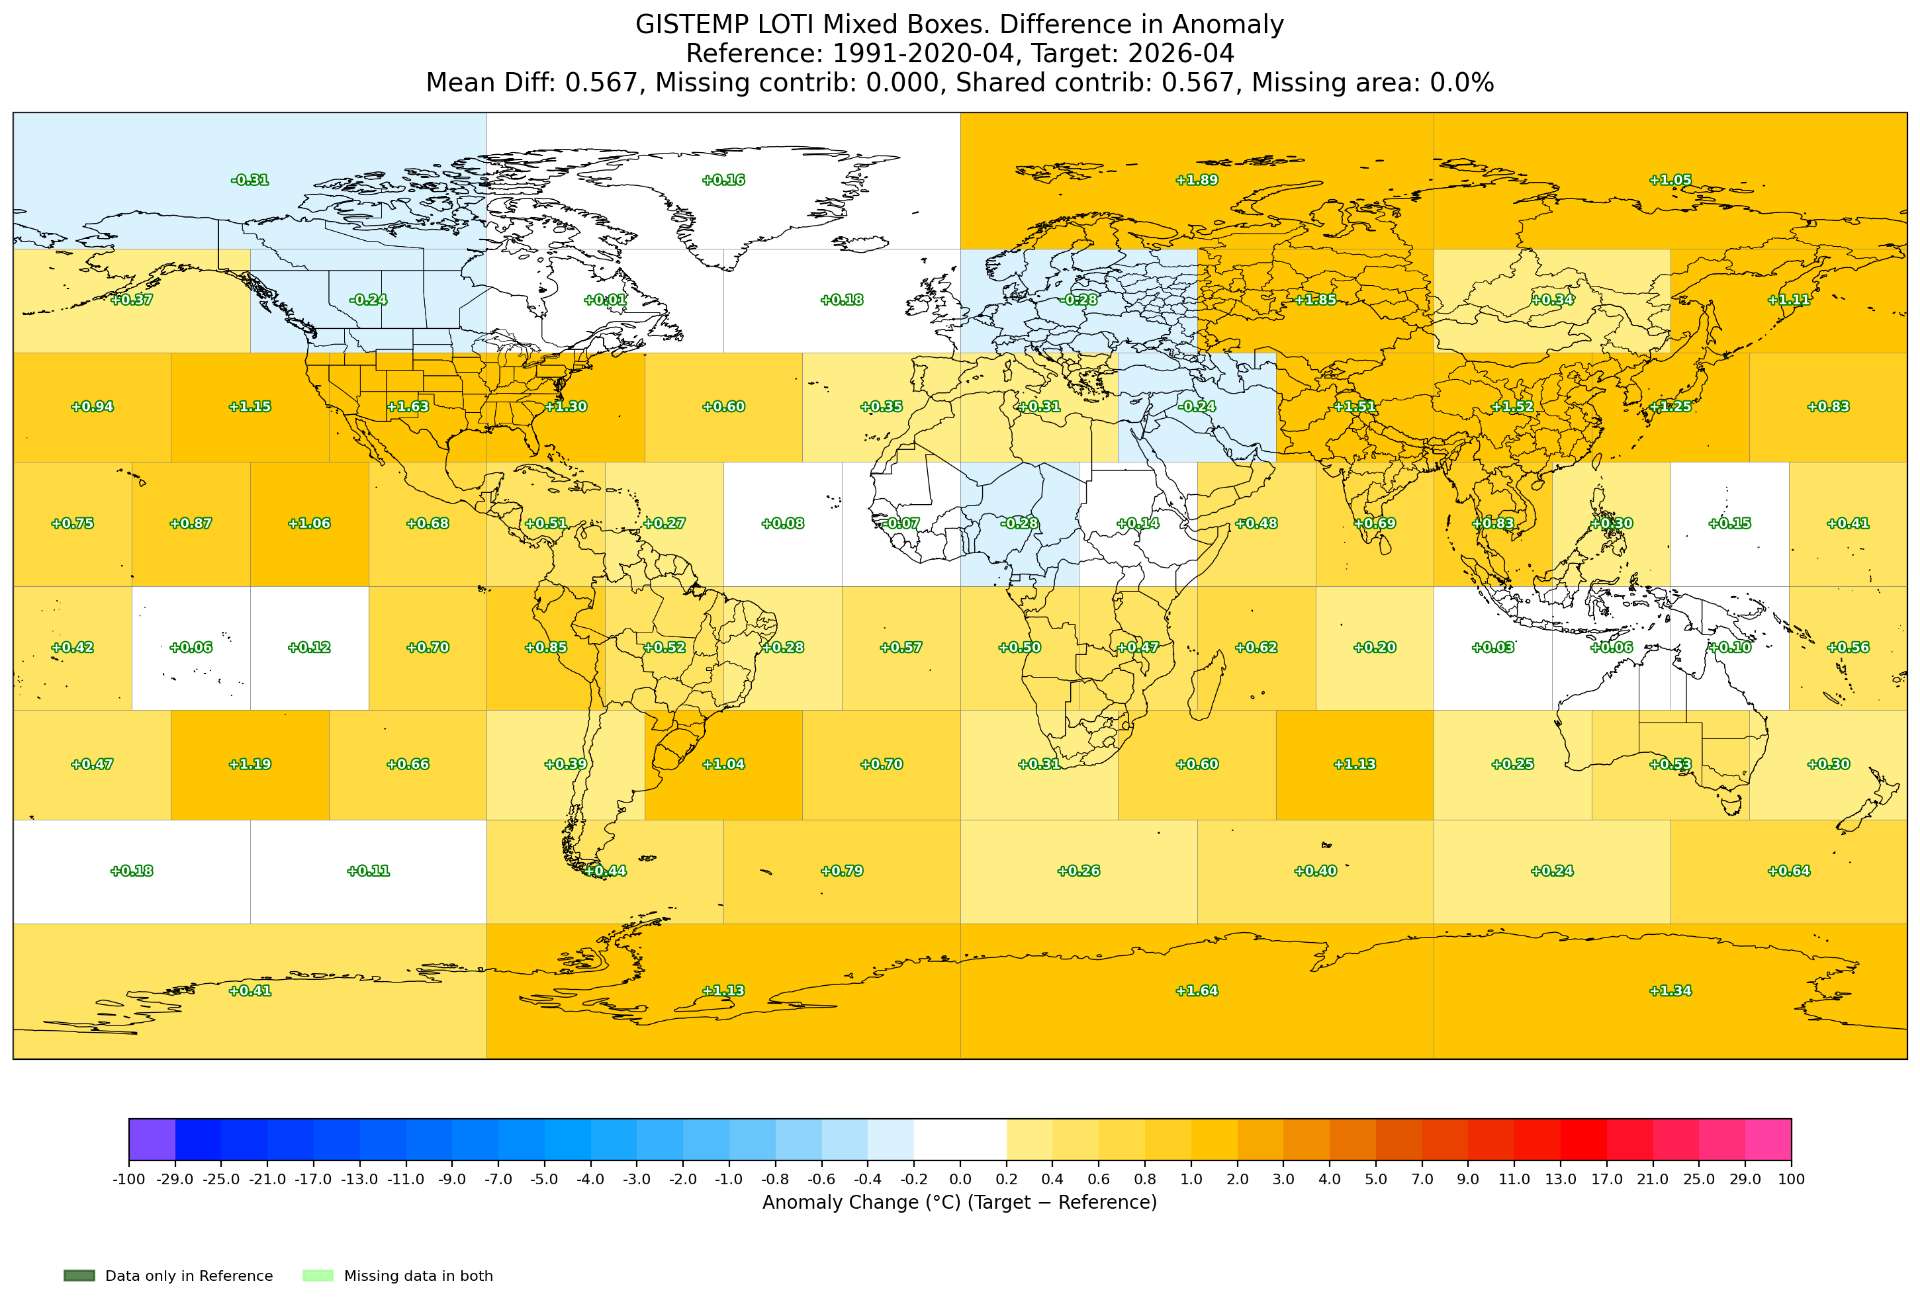
GISTEMP style Boxes
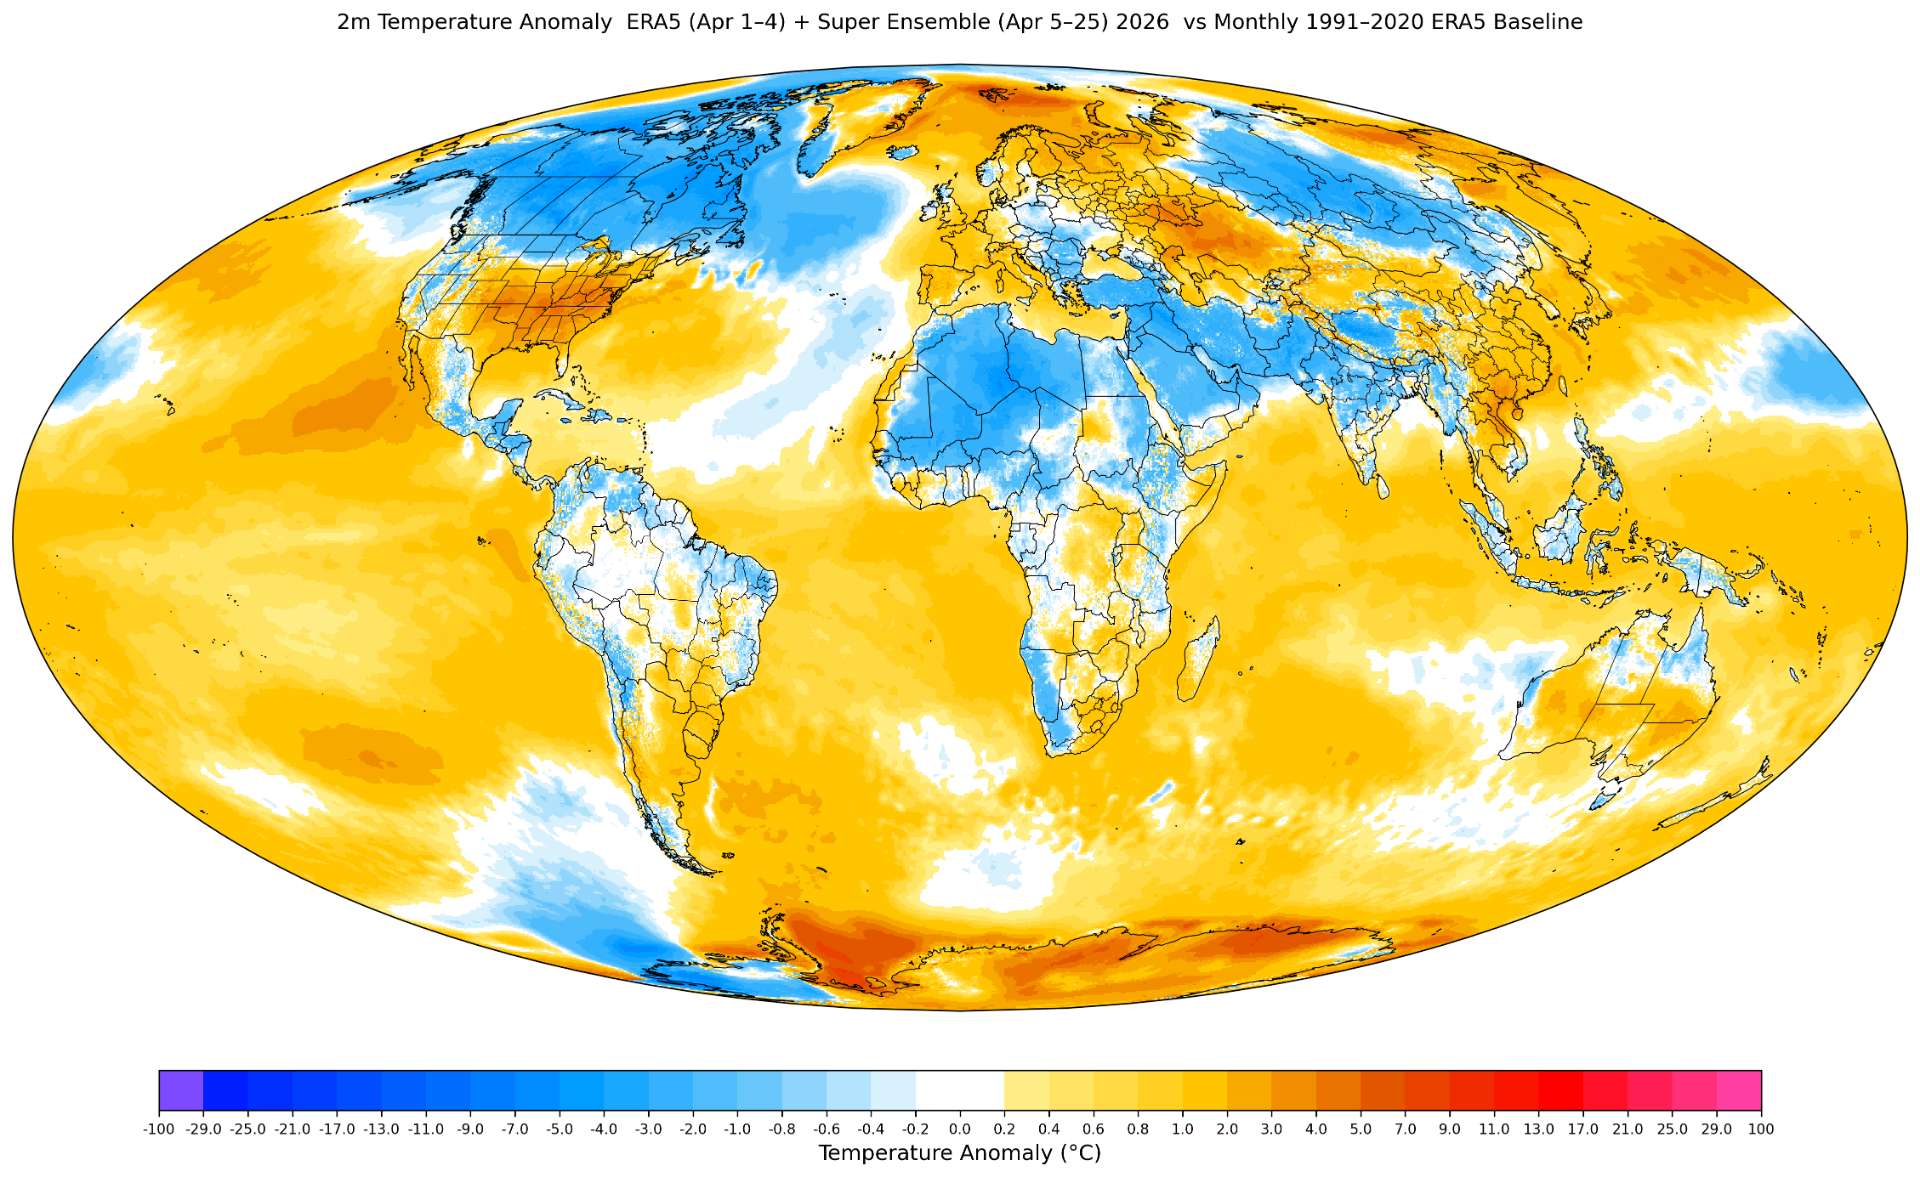
April 2026 (ERA5 and forecast), t2m:
April 2025 GISTEMP boxes:
April 2020 GISTEMP boxes:
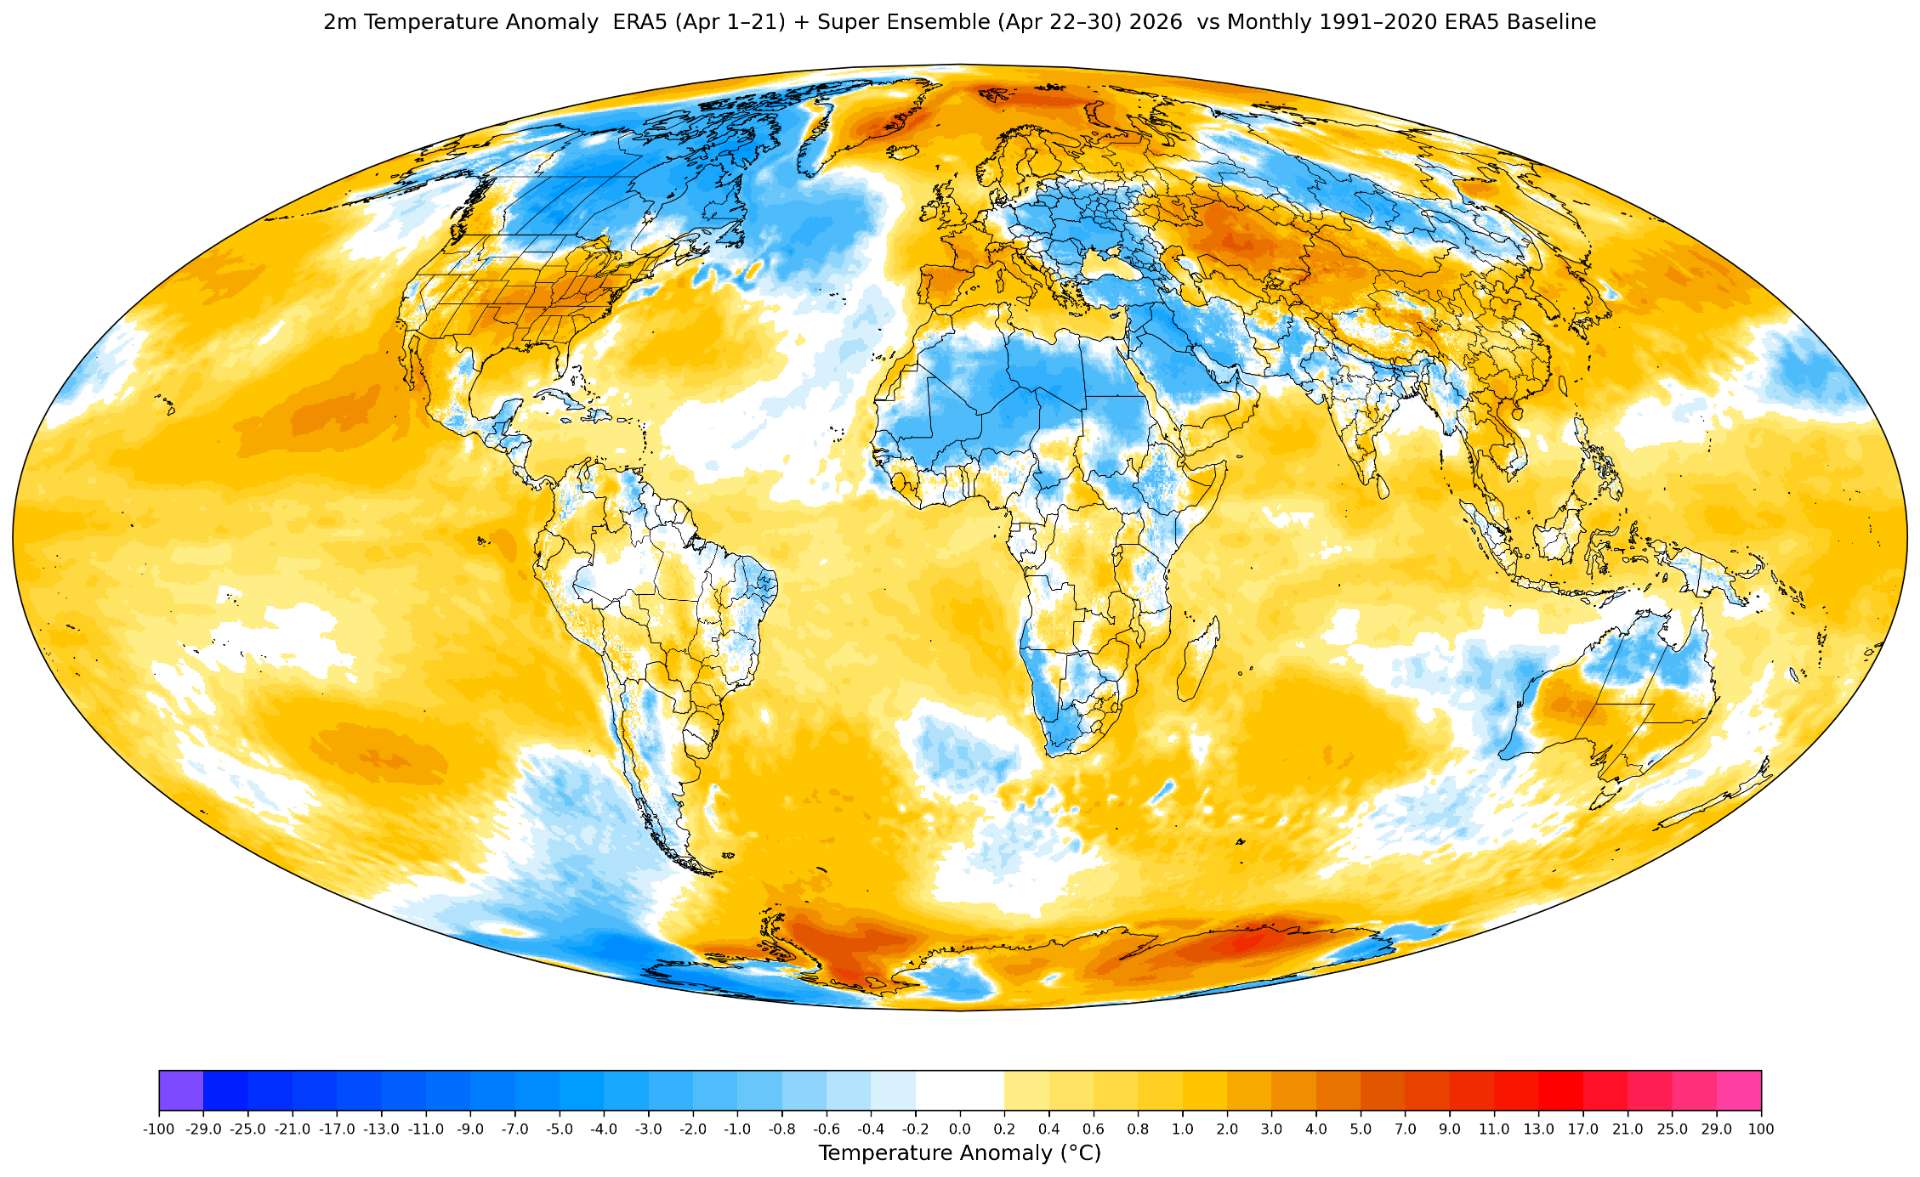
Following up from a run I did much earlier today (up to 17/06Z), when the ERA5 preliminary from copernicus was a couple days behind what it is presently now at this moment (13th vs 15th), so tomorrow there may be a large jump when I update.
~
I followed up on this delta analog method using era5 - gistemp box anomalies using a varying model type/cutoffs per month to try to improve it.
Although it does seem to have a comparable (in terms of the validation data from either base models), or even slightly worse variance (in terms of my own predictions for the last year in hindcast), it looks robust enough for all months to use now and seems like a good idea since it diverges significantly from the other ERA5->GISTEMP model for some months in hindcast (sometimes better, sometimes worse for particular months).
For April, val_std=0.0572, pred_std=0.0054; where pred_std confirms my speculation yesterday that using many independent analogs seems a valid method, since the gistemp box anomalies from all the years stay strongly correlated with the actual gistemp loti value even if you change the baseline to 1991-2020 in each; I recalled incorrectly previously that there was some band/zonal weighting debiasing in GISTEMP after the boxes were created from when I went through the code some time ago, but this recollection was not the right interpretation (there is weighting of the bands but its only to preserve equal area since there are a different number of boxes in the different bands.)
Hindcast from the last 12 months shows that the variance from weighting the two predictions (by inv. variance on residuals of own predictions and hindcast for the other model) is only slightly worse (previous std dev of 0.048 from last 12 samples, becomes a std dev of 0.051 in the mixed), so I expect should make my own predictions more robust even if the combined variance appears marginally worse in the last 12 limited samples of hindcast (this results right now in weighting the old ERA5->GISTEMP model as ~ 60% and the new delta analog by about 40%).
After adjusting based on recent errors this yields, 1.162 and 1.209 from ERA5->GISTEMP old model, and the delta box anomaly analogs, and then weighting them (~0.6 and 0.4), yields a point estimate of 1.181 C.
This is the common sense value again based on the simple analysis I did yesterday.
Now getting a center point estimate of 1.154 (1.139 from old ERA5->GISTEMP, and 1.179 from the experimental analog)...
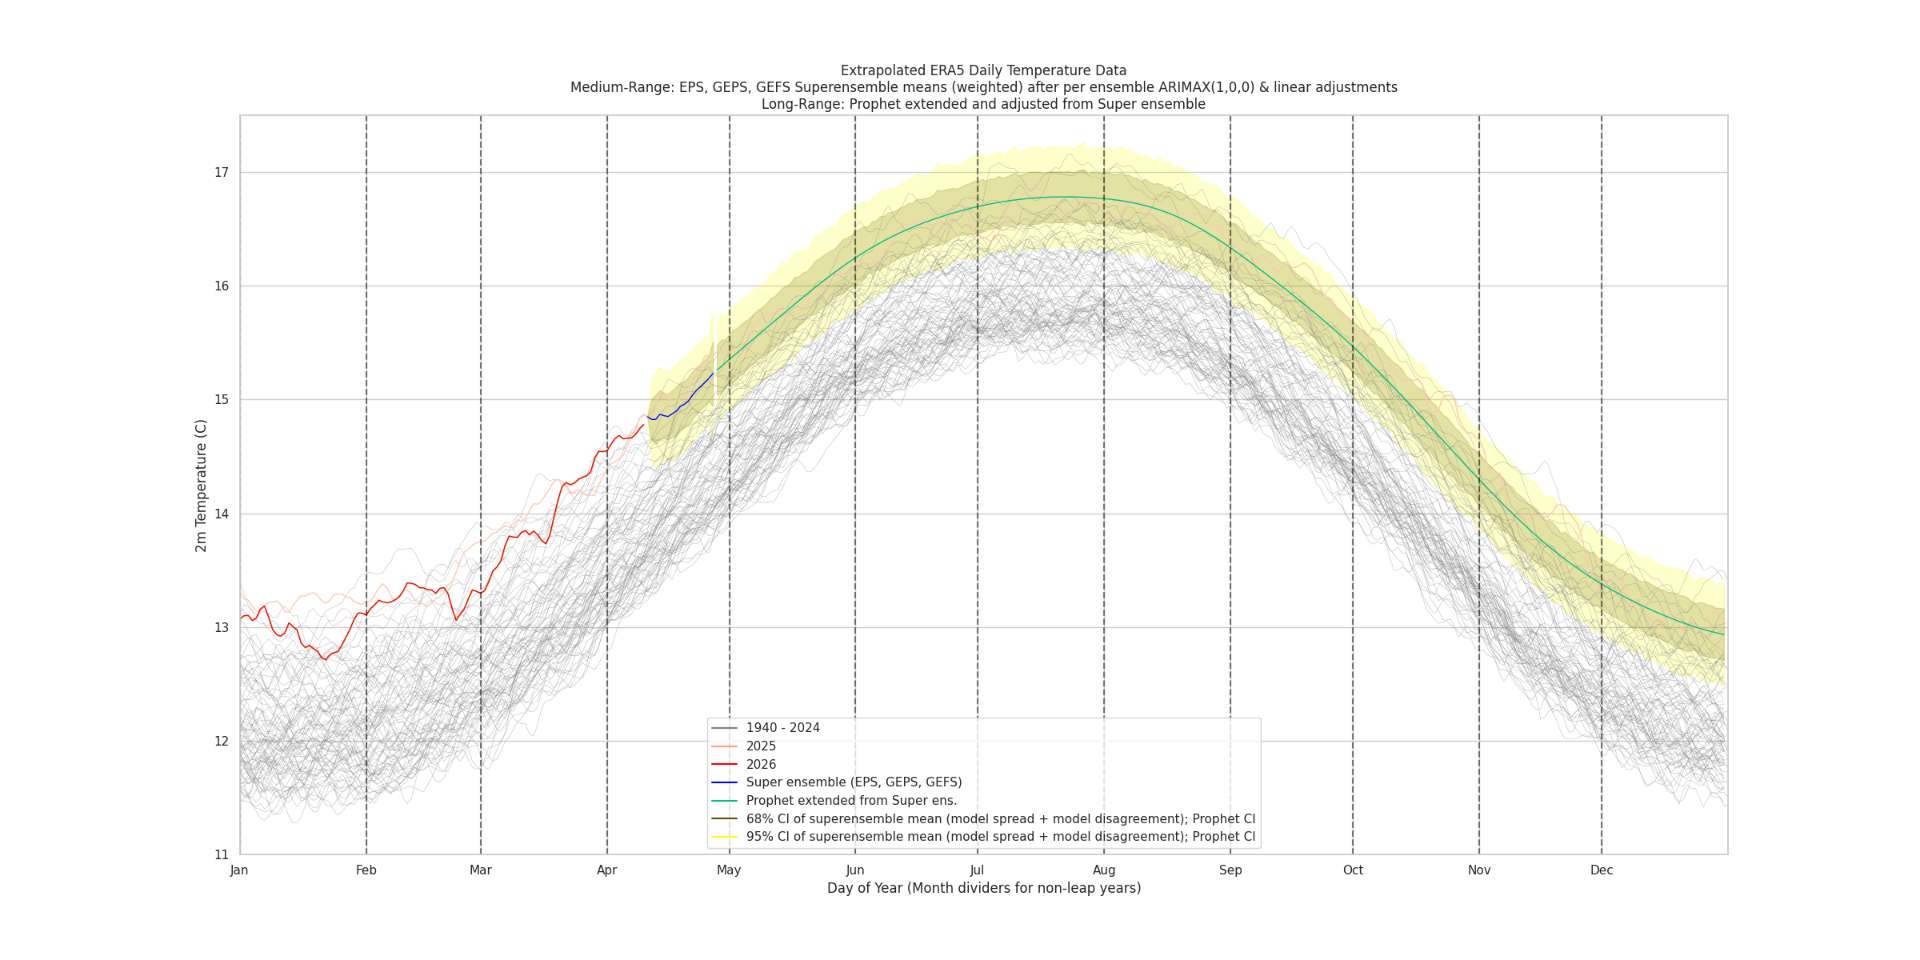
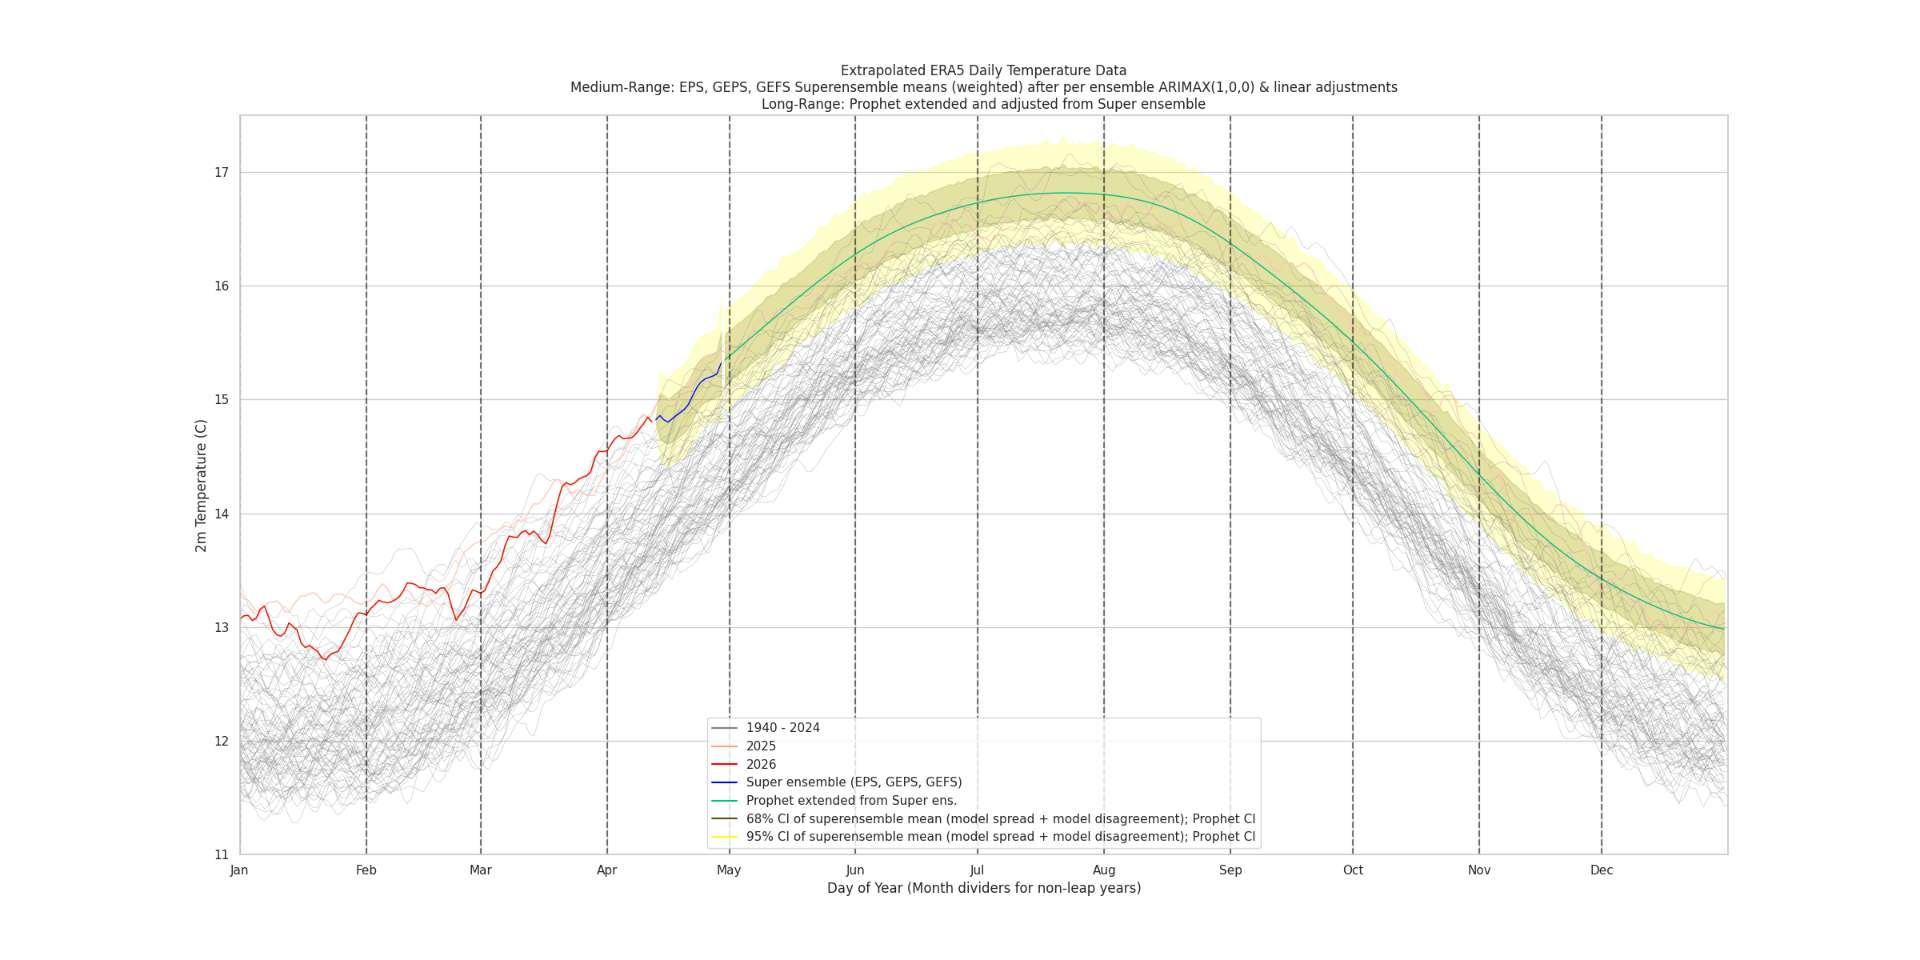
Super ensemble runs from 10 days ago or so were far too warm, and really missed the dip mid-month (missing the cold front across US) (colored to show when red means model was too warm, and obs. was colder than predicted):
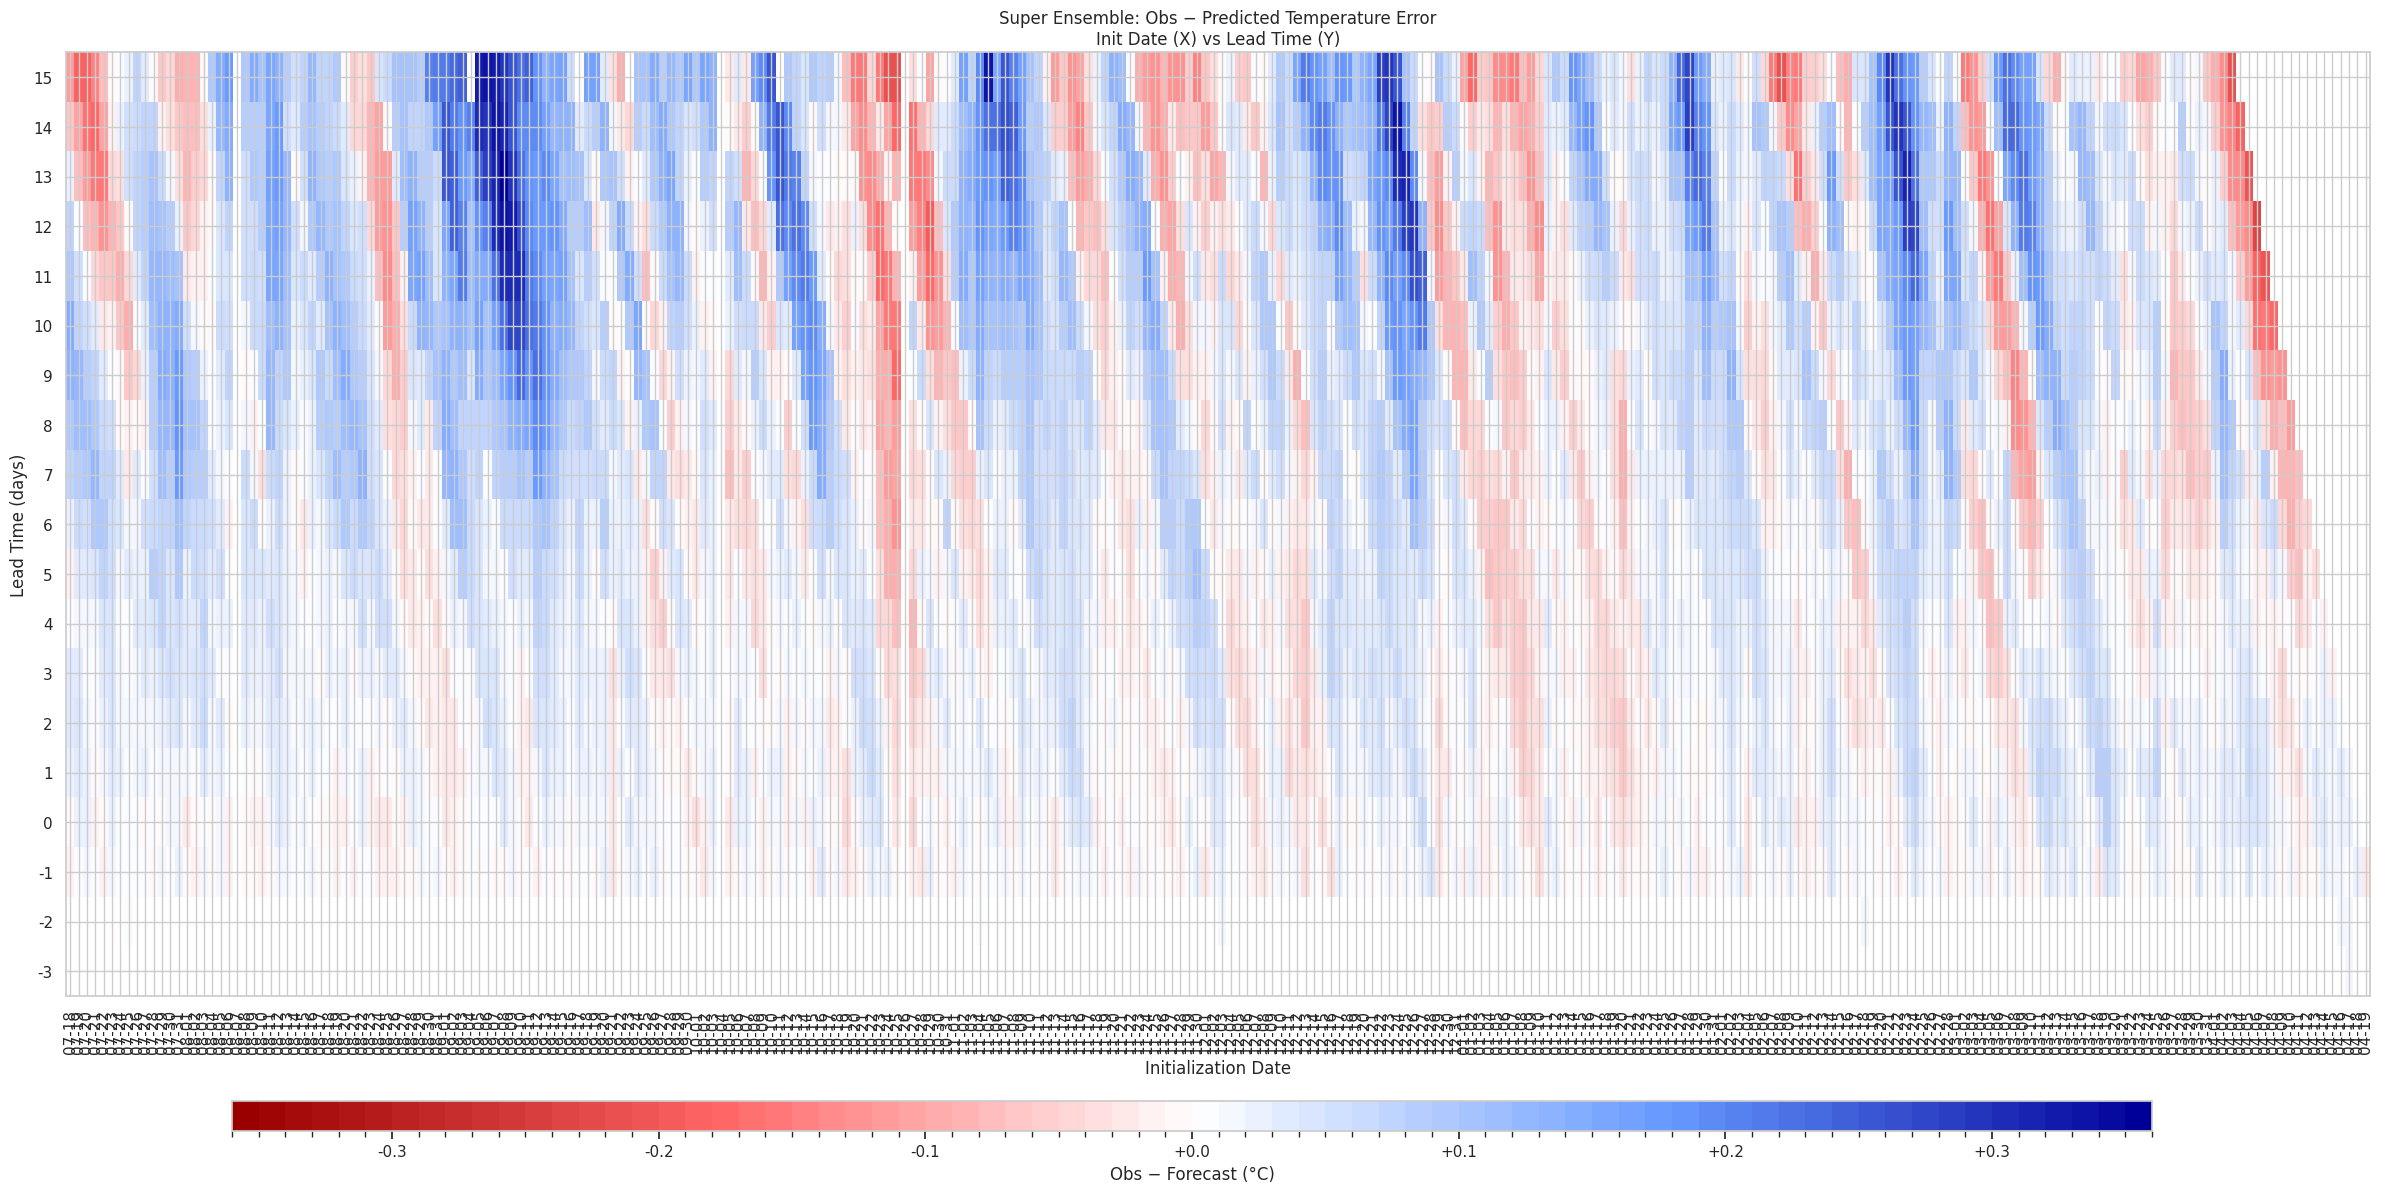
init 10 days ago for yesterday:
vs latest analysis...
@zenarxy matches the other delta-analog method I've come up with again...
I've been below you for a while mixing the two methods, but the 1.145-1.195 bin has been too expensive... so thank you for helping me out?
Point estimate (old, deltamethod) adjusted by prediction error mean: 1.128, 1.151
Point estimate (mix) adjusted by prediction error mean: 1.137
Final copernicus ERA5 point is in...
1.1316 (adjusted) (1.1064 unadjusted from own errors) ERA5->GISTEMP
1.1471 (adjusted) delta analog method (still have 3 days of gridded ERA5 missing)
(Adjusted) mix of both predictions: 1.1377 C
Given the recent anomalies from the last few months (ocean anomaly) probably again should expect the actual anomaly to be higher than this 1.138 C estimate, but hopefully not as much as previously (the US warm anomaly isn't as extreme as last time so it shouldn't bias Canada warm as much as the last couple months under homogenization and the GISTEMP compositing).
Scheduled release date is Mon May 11 for GISTEMP...
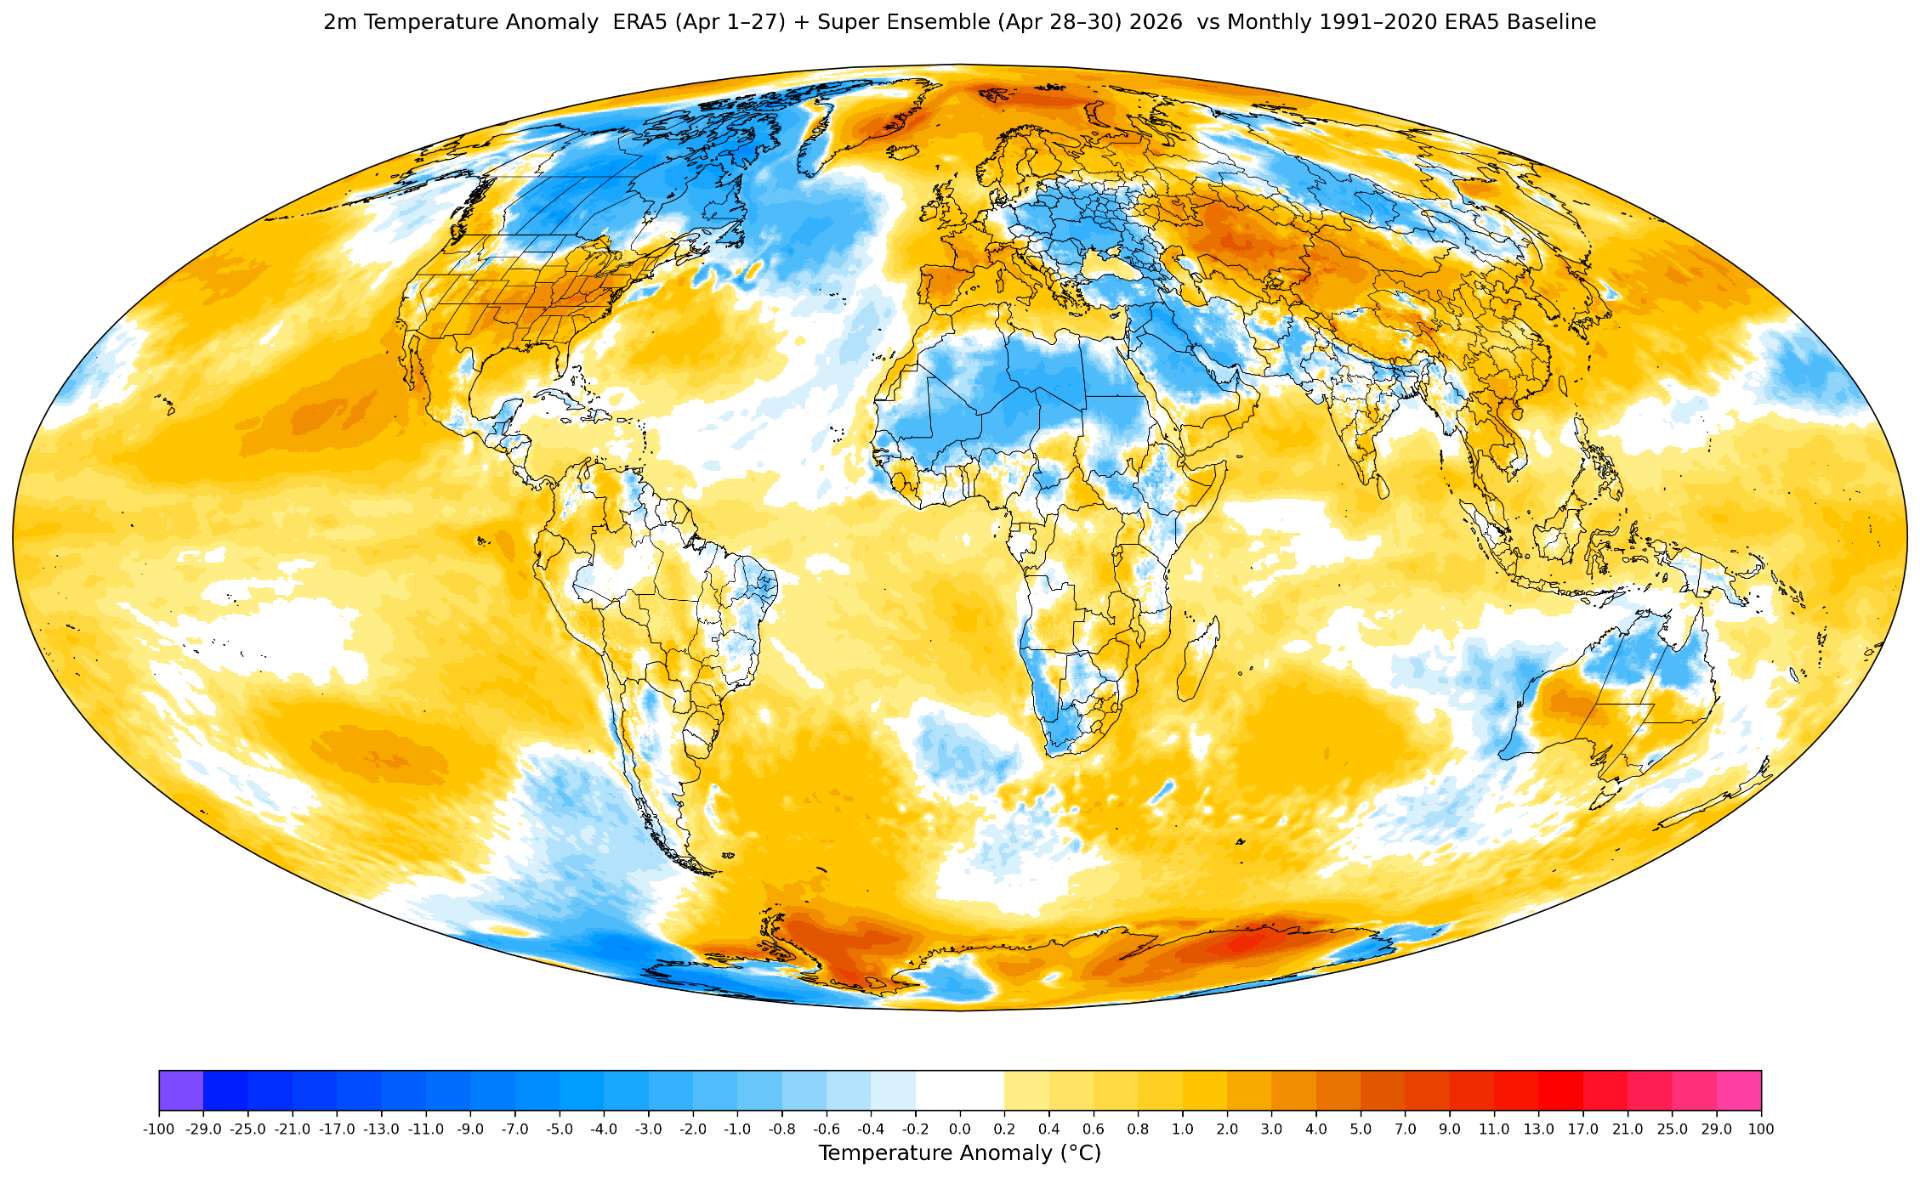
If the anomaly is not close to the bin edges (which at the moment it looks it will be) it would seem any late coming Antarctica stations would cause the largest swings.
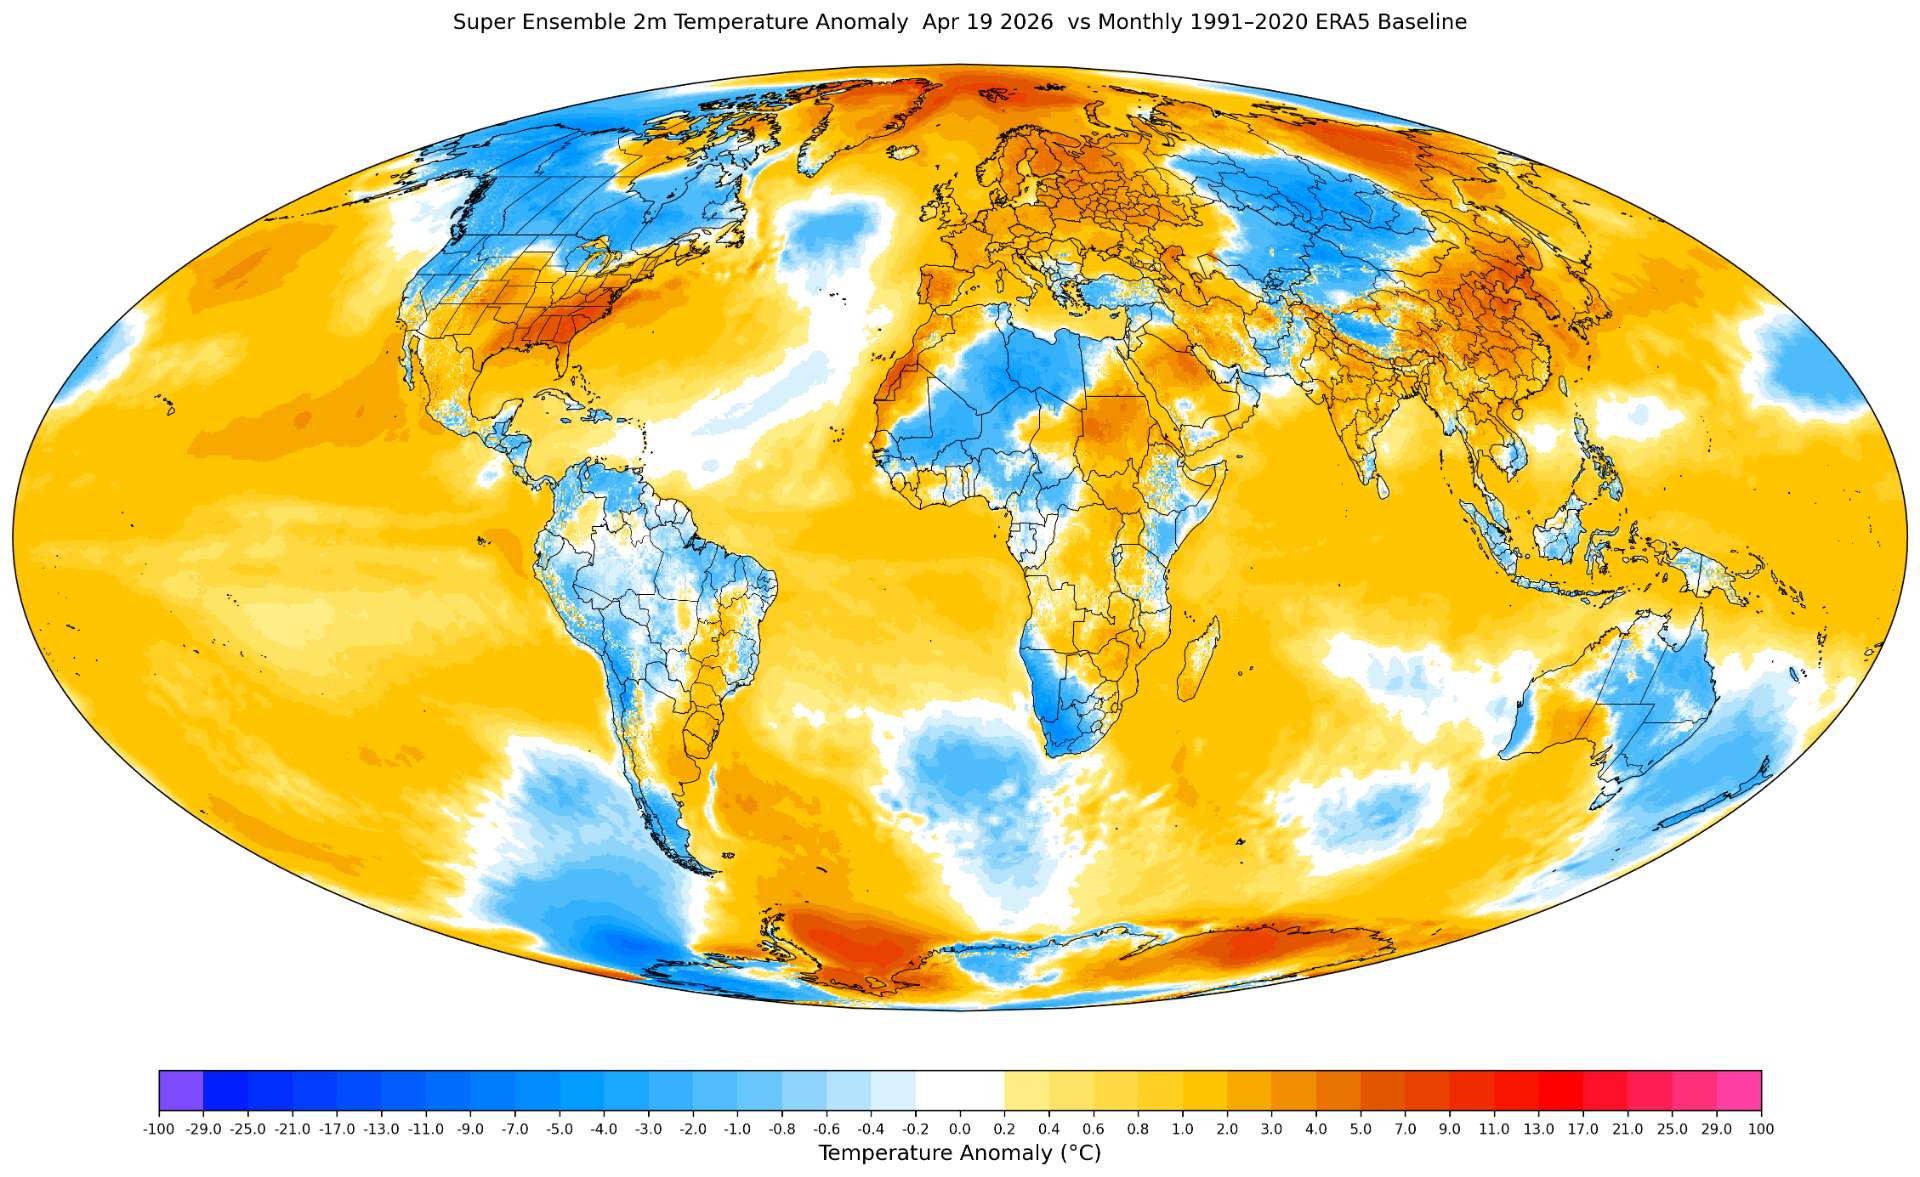
Preliminary anomaly map (3 days missing):
And GISTEMP type boxes: