Resolves to the price given by CoinMarketCap on 2024-03-29 at 11:59pm Eastern Time.
Convenient market data for trading on this market can be found in the Delta column on this page.
I may add more answers later, depending on if there is particular demand or wide spreads between adjacent answers.
 1,000
1,000🏅 Top traders
| # | Name | Total profit |
|---|---|---|
| 1 | Ṁ390 | |
| 2 | Ṁ333 | |
| 3 | Ṁ238 | |
| 4 | Ṁ235 | |
| 5 | Ṁ225 |
People are also trading
@BoltonBailey I can confirm. I am in ET, and the line chart at both 11:55 PM and 12:00 AM shows it dipped just below, by a hair.
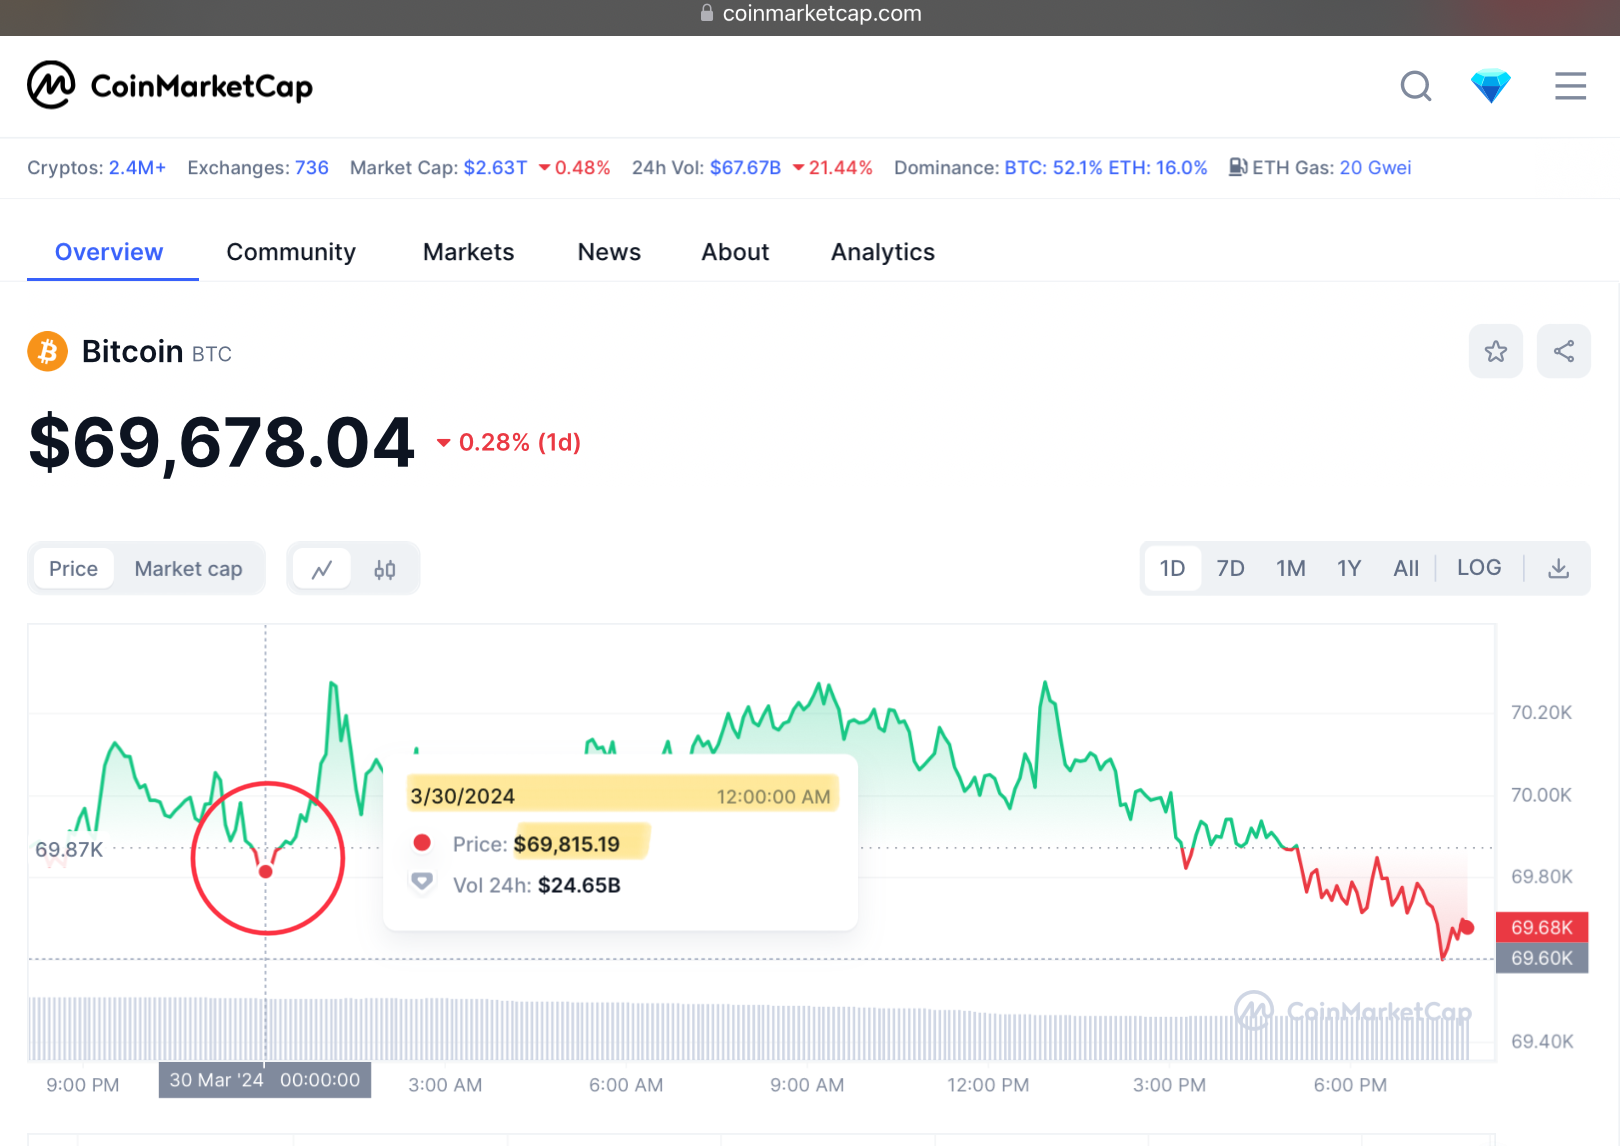
Note this data will roll off the chart in a few hours, but I think the dip is still visible in the 7d timeframe.
@BoltonBailey Also note the linechart has better resolution (5min in 1d timeframe and 15min in 7d) than the candles (1h candles and unclear if the candle timestamp is the open or the close).
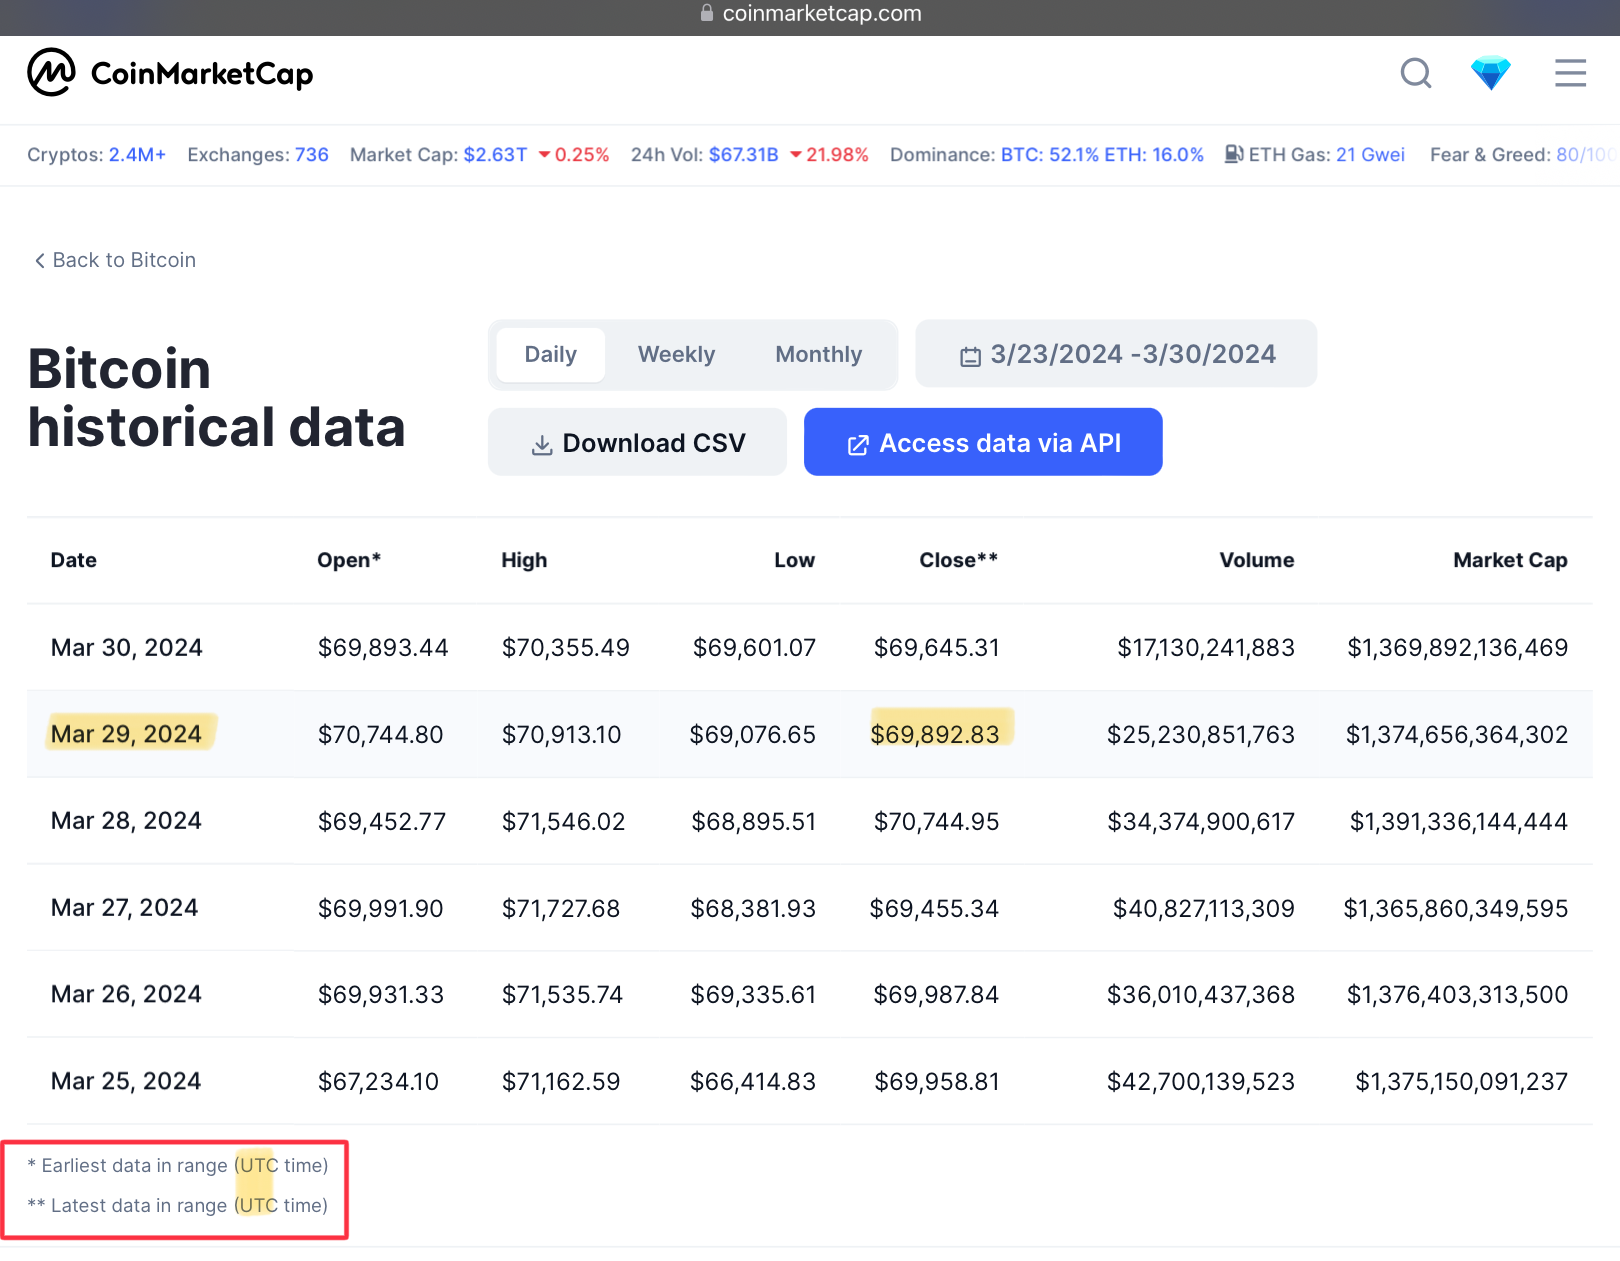
Finally, I suggest using UTC with CoinMarketCap since they provide a permanent record (as opposed to the ephemeral intraday data from the chart) of daily open/high/low/close historical data based on UTC date changes. Coincidentally in this case it would also resolve NO: