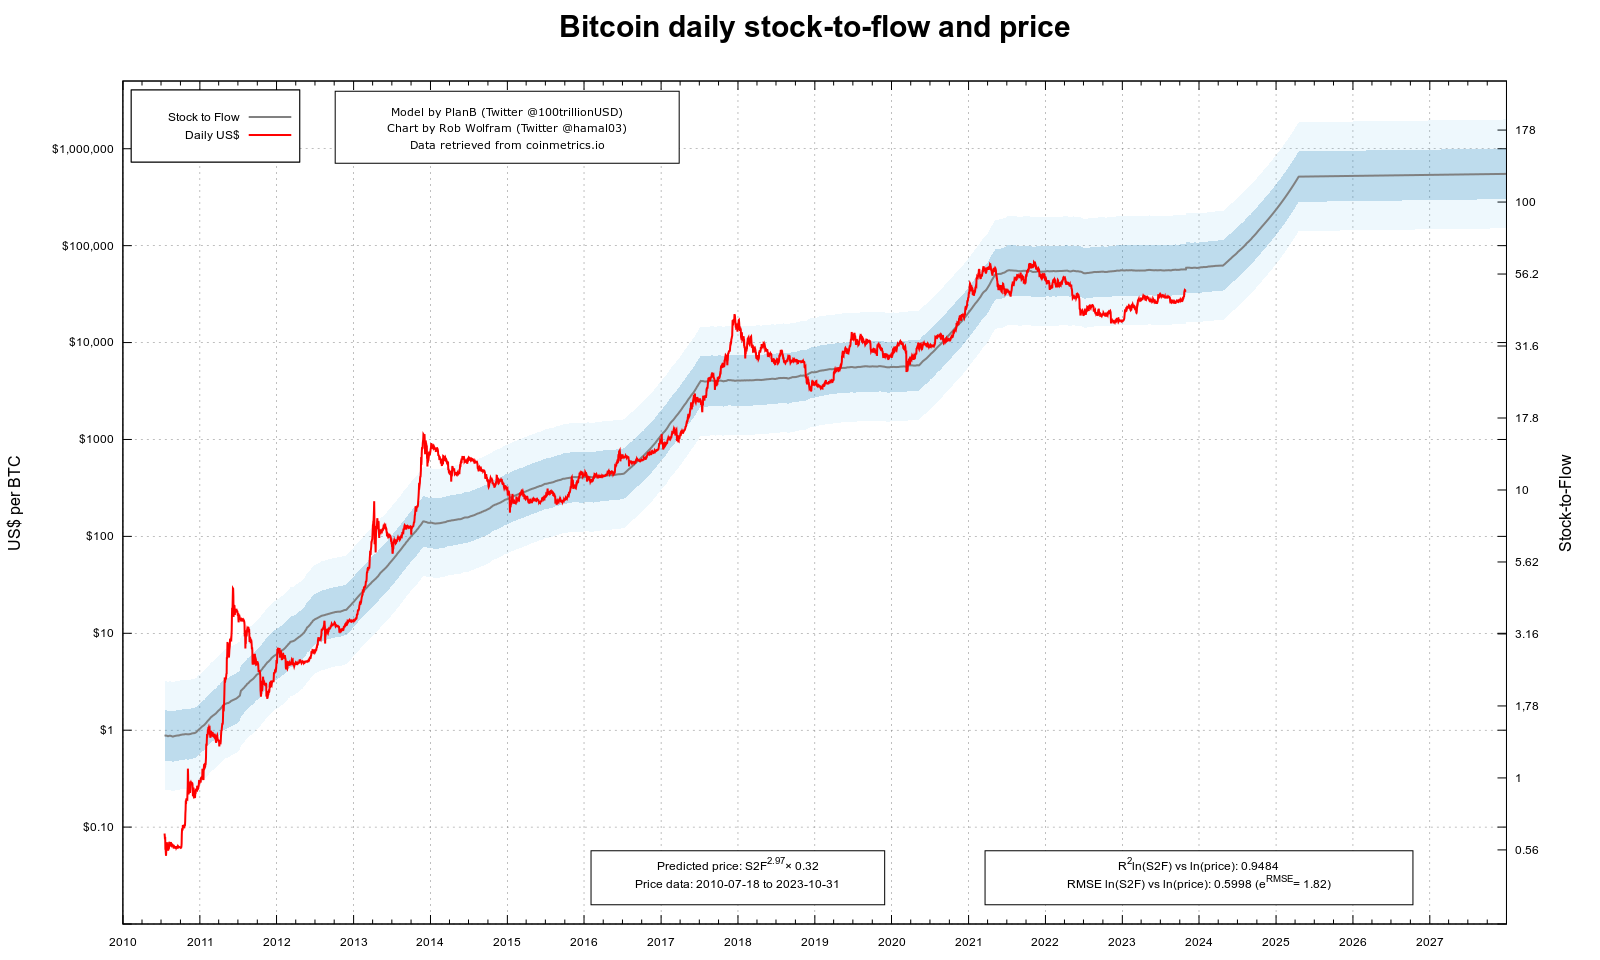
Stock-to-flow Bitcoin model: This is a price prediction model where the price is predicted based on how much Bitcoin already produced (stock) and the speed at which it's being produced (flow). Detailed explanation here.
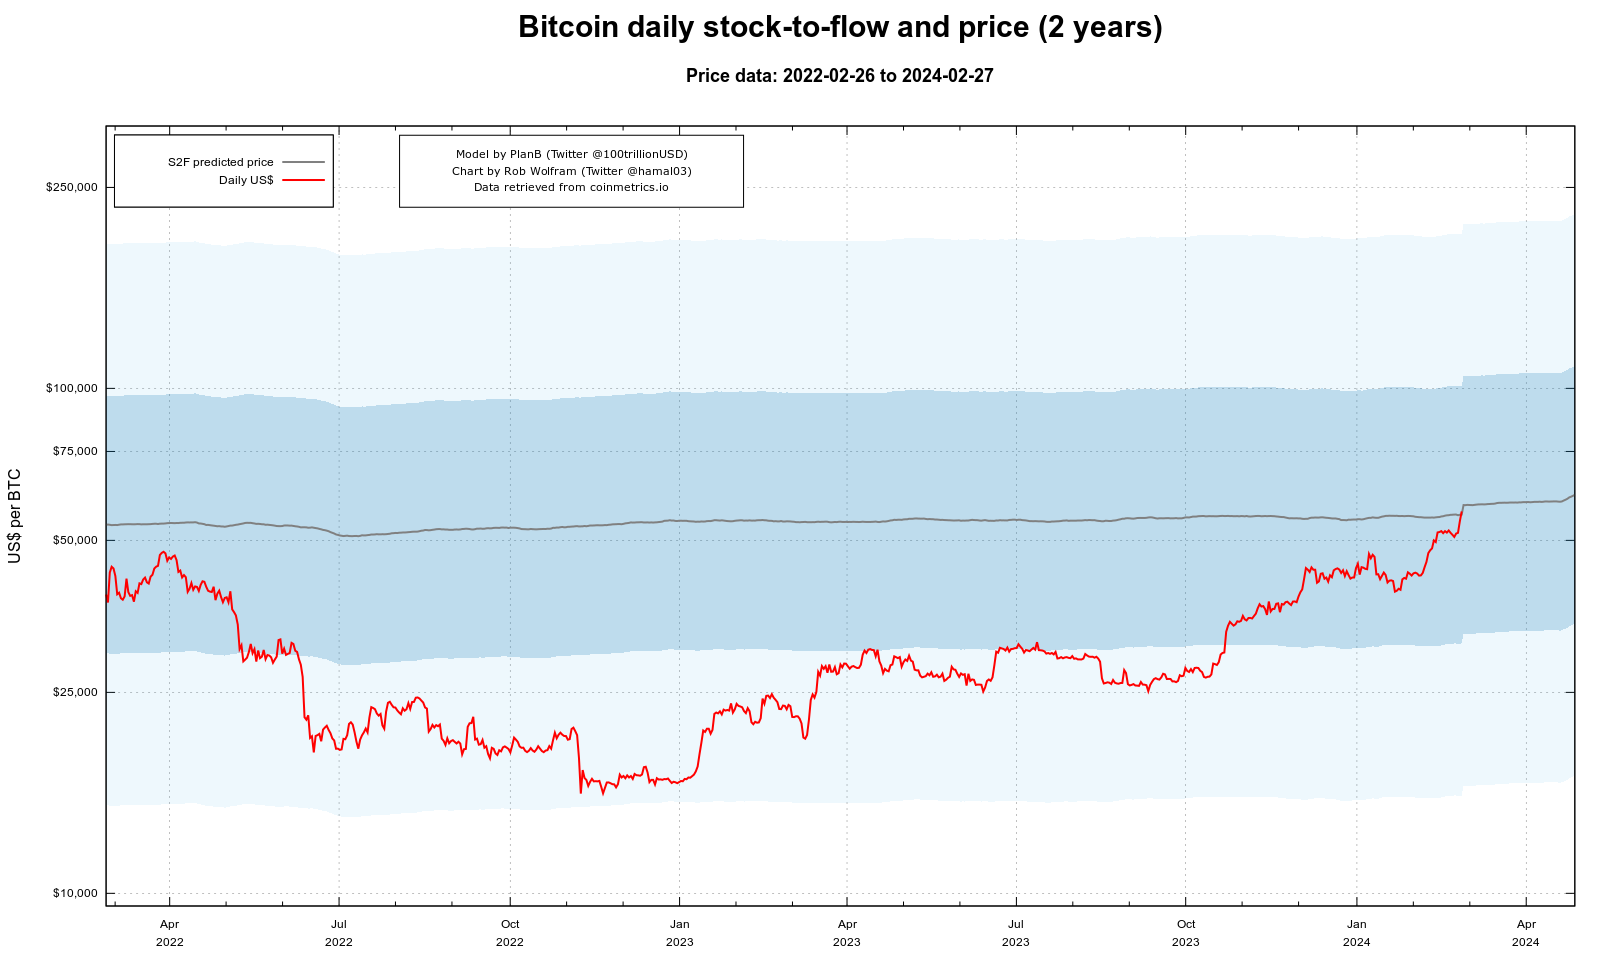
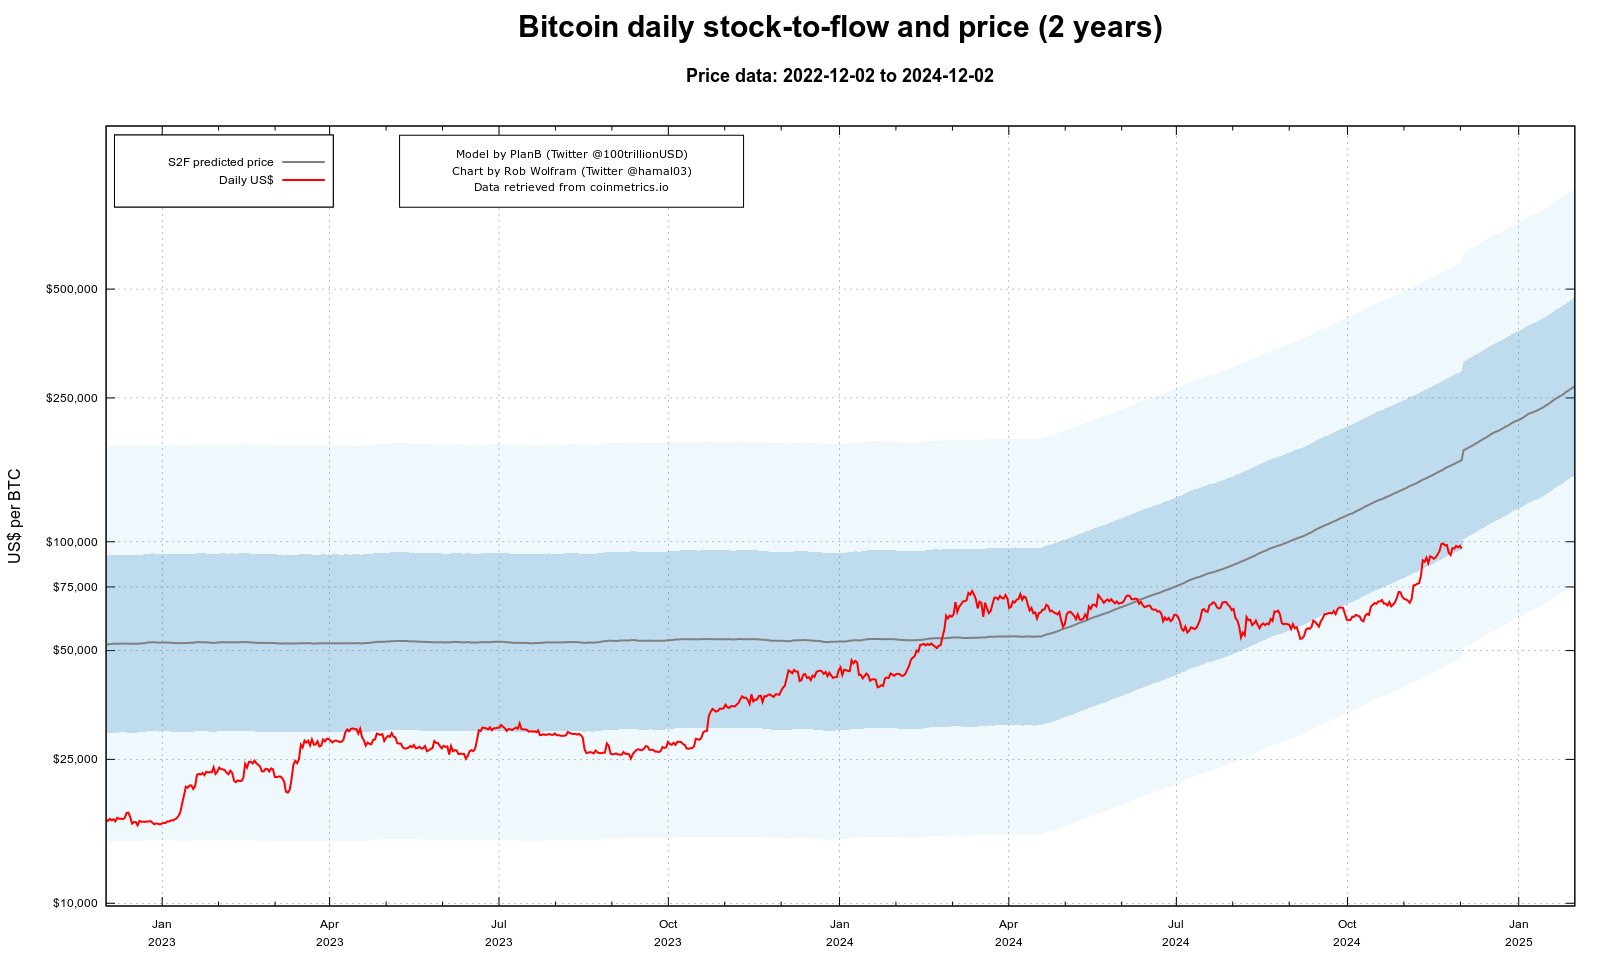
Break: for this market, the model will be considered broken if the price goes outside of the 2 standard deviations band of the model (light blue band on the chart below).

Note, that this happend before, for example in 2018. But previous breaks do not count for this market.
Resolves YES: if it's visible* in the 2-year detail chart that the price went outside the 2nd band.
* A red pixel of the chart has a neighbouring white pixel at the left or right side.
Resolves NO: if conditions for YES are not met before close.
Resolves N/A: if the website above that posts the charts stop working, and I fail to find a good replacement for the source of information.
🏅 Top traders
| # | Trader | Total profit |
|---|---|---|
| 1 | Ṁ9,899 | |
| 2 | Ṁ503 | |
| 3 | Ṁ301 | |
| 4 | Ṁ119 | |
| 5 | Ṁ100 |
Resolves YES: if it's visible* in the 2-year detail chart that the price went outside the 2nd band.
* A red pixel of the chart has a neighbouring white pixel at the left or right side.
The red line has some anti-aliasing (I only adjusted color levels), but I think it's a YES.

more zoom and contrast

Personally I think it's either gonna break right here:

or it's not going to break at all. 2 standard deviations is a decently big chunk of space and I sincerely doubt Bitcoin will jump beyond 1 mil. The (somewhat-recent) news (something something no federal bitcoin reserve) that pulled BTC down from 100k may be able to keep it at around 100k instead of bouncing back up too quickly, thus breaking the S2F chart. Otherwise, if it can stay solidly above 100k with a significant margin, there's no chance it breaks.

Exactly at the model price right now
