You can see users' trades on binary and multi graphs
Dec 30, 2025

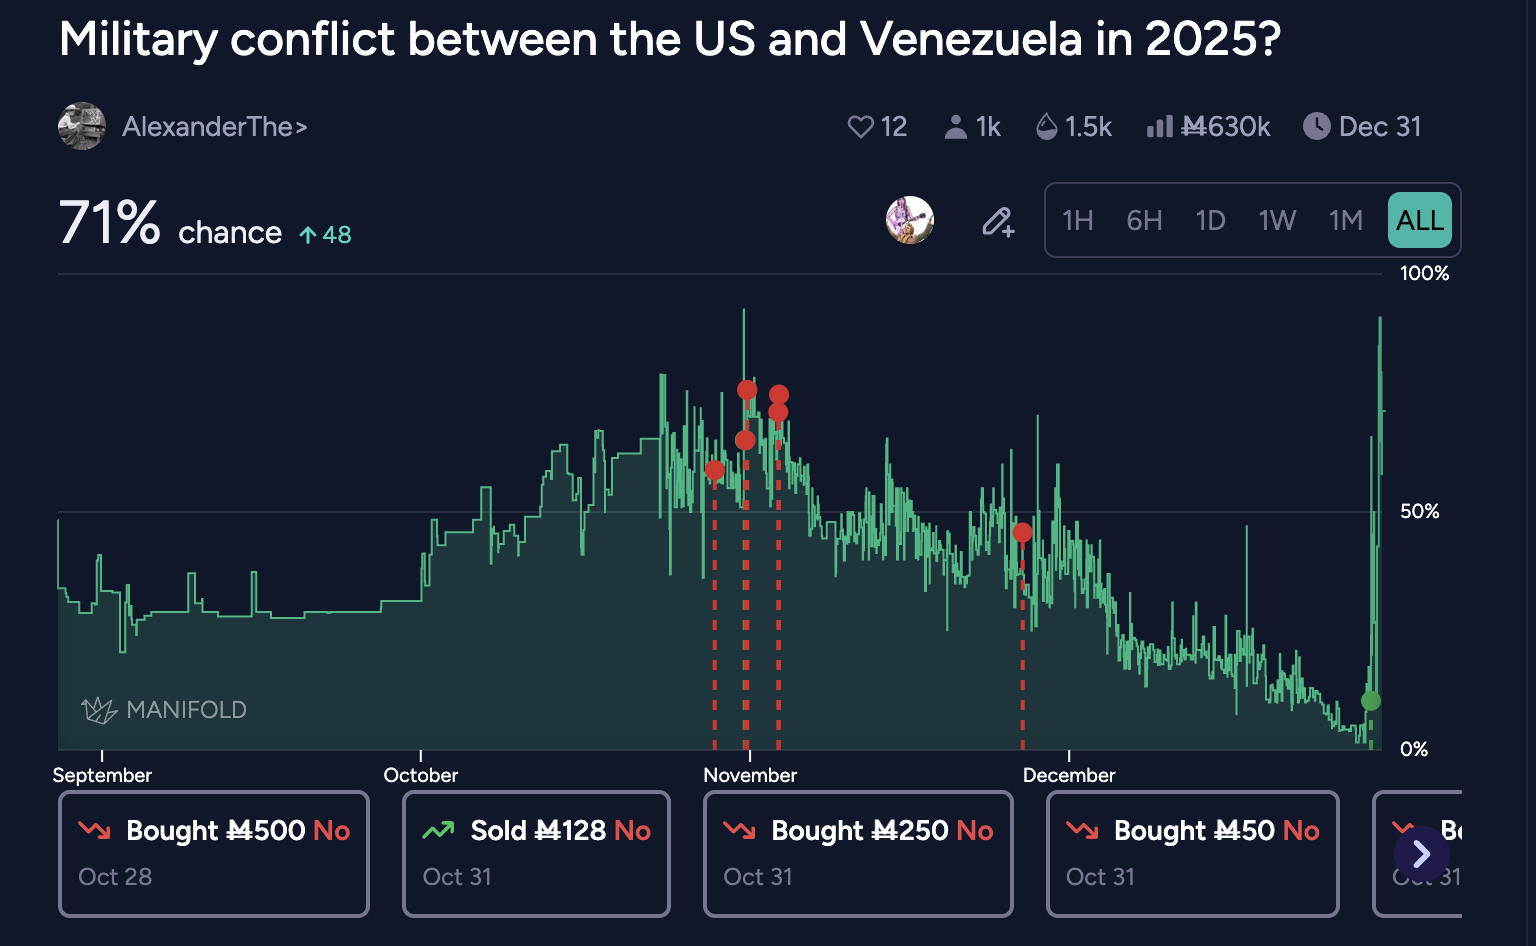
You can trigger the display via tapping:

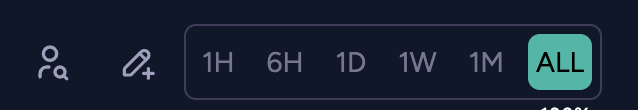
  • the search user button to the left of the time selector on desktop

  • their position row and tapping the 'graph trades' on the positions tab

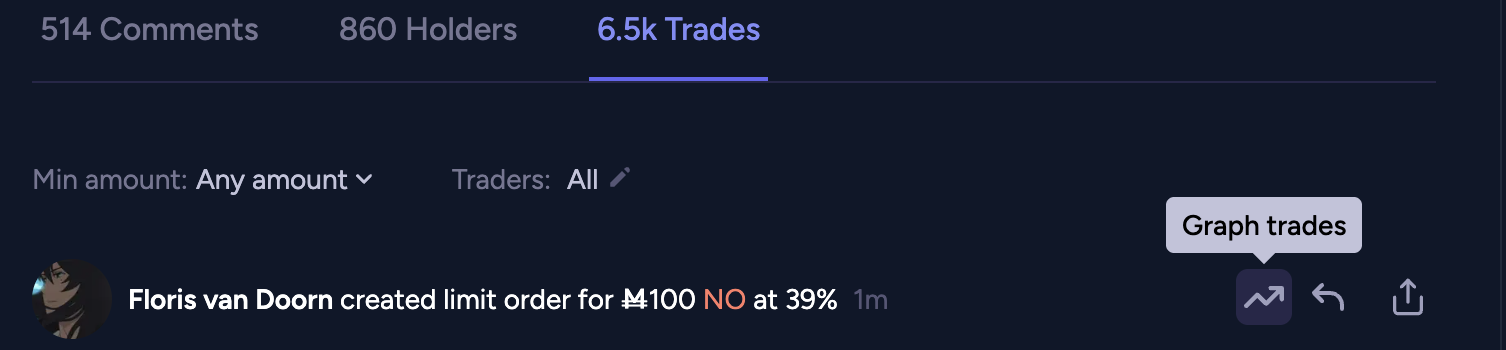
  • the 'graph trades' wiggly arrow icon on one of their trades in the trades tab

finally, i can see a perfect log of me buying peaks and selling dips

This is nice and useful. One small thing my I notice is that for ‘no’ trades the average cost is reported as the price for “no” shares, but the “last trade prob” is the “yes” share price

@brod good point, would you rather see both in yes or both in no?

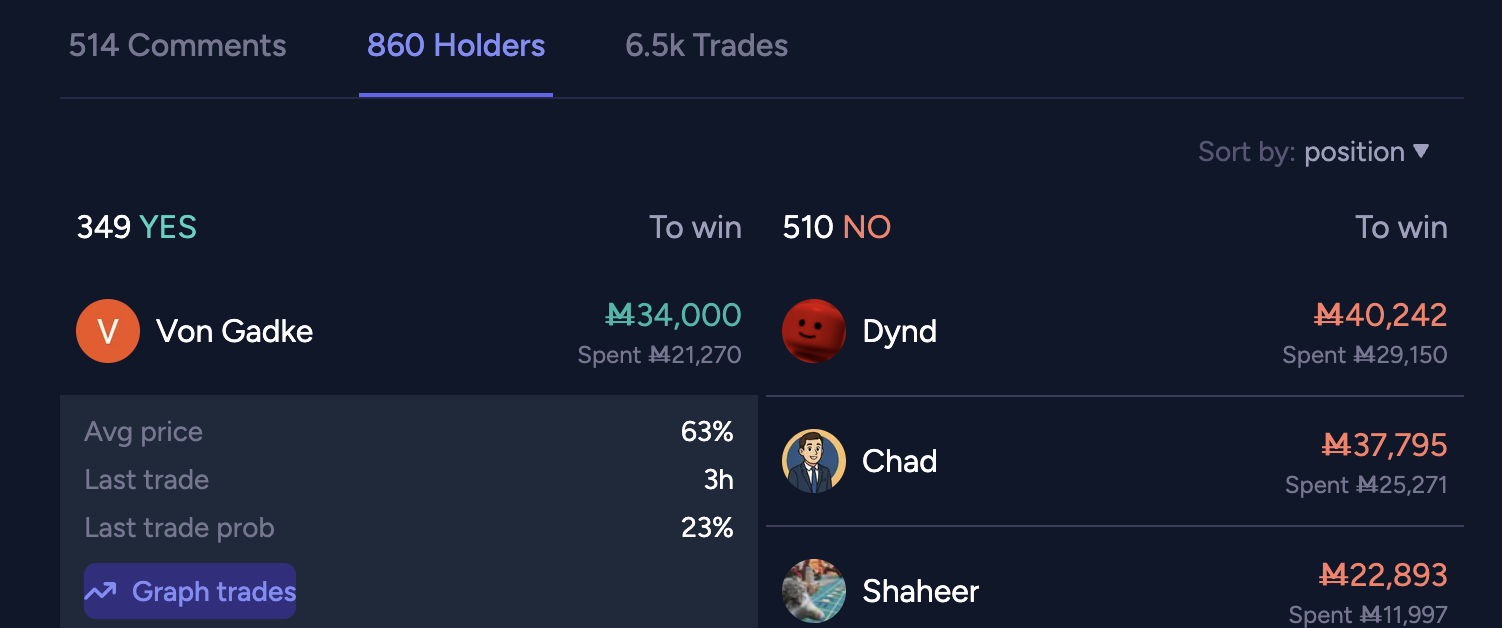
@ian I think both in no would be better, definitely makes more sense for the average cost to be quoted in “no” and i think they should be consistent

fwiw i'd rather see them shown in yes, it's a very seemingly consistent feature of manifold that it shows the prob as the yes prob even for no shares, it would be confusing for this to stop being the case for this one thing imo? or if you do show the no share cost i'd rather see 23c than 23%, to make it clear it's not following the market prob convention of always being in terms of yes?

Could we have it both ways?

@Bayesian true, this is breaking the convention, I will take a look

@Quroe made it so for no holders you can see both prices

I just noticed that AI clarifications can be approved or rejected on a case-by-case basis now, so that makes two good new features, thank you!

This is going to be immensely useful for me.

Are all of these tutorial posts going to be collated into a singular place? Like, a dashboard? Or a master post like a table of contents?

@Quroe the documentation is in the code

© Manifold Markets, Inc.TermsPrivacy