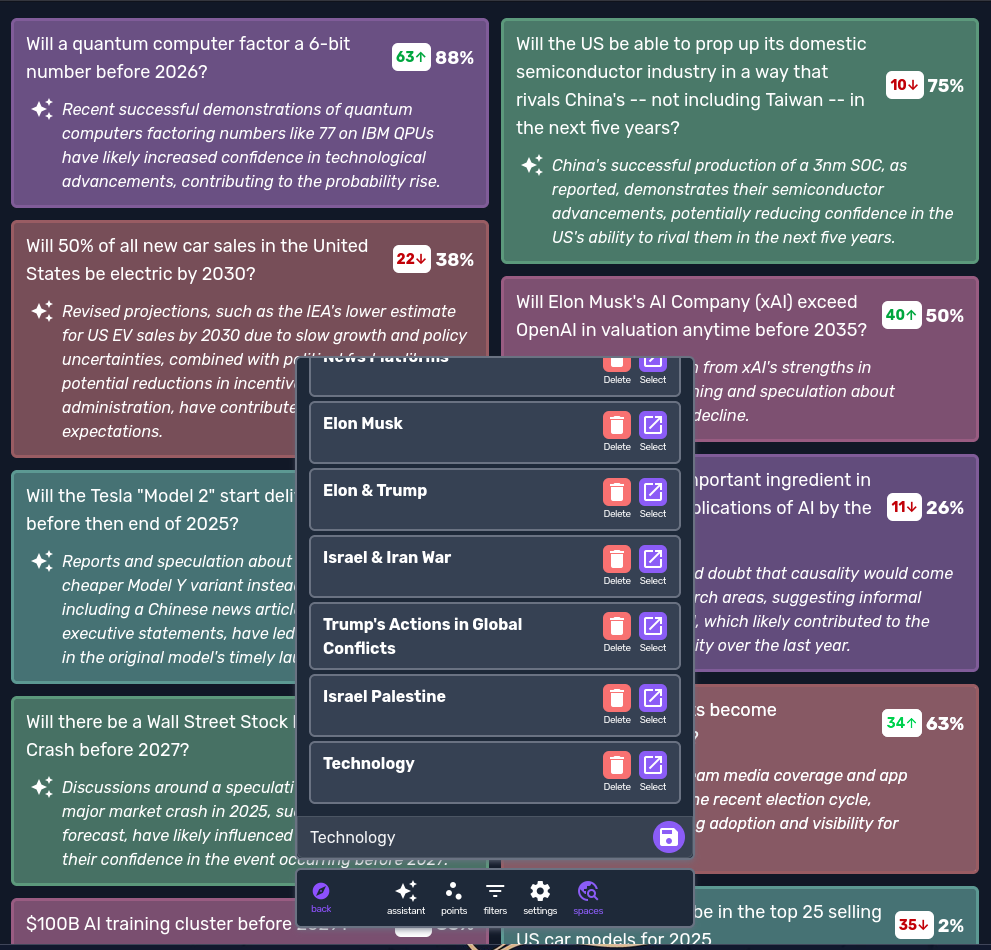
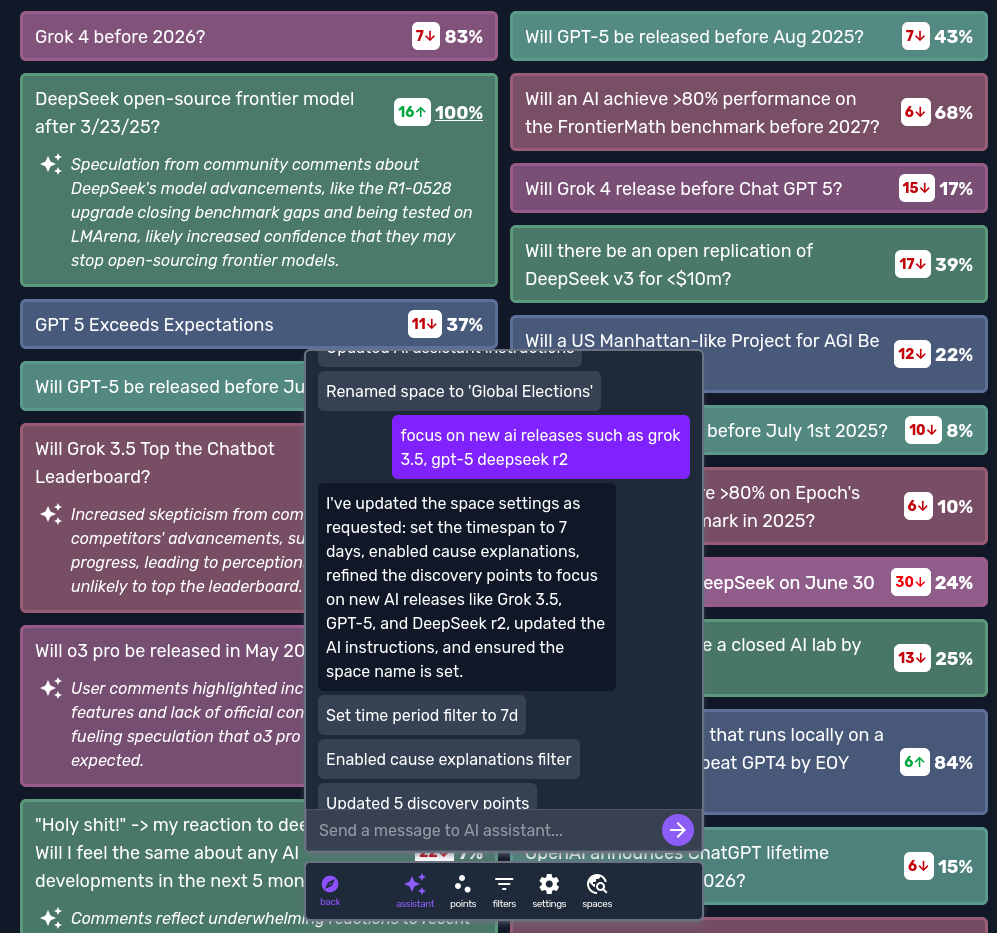
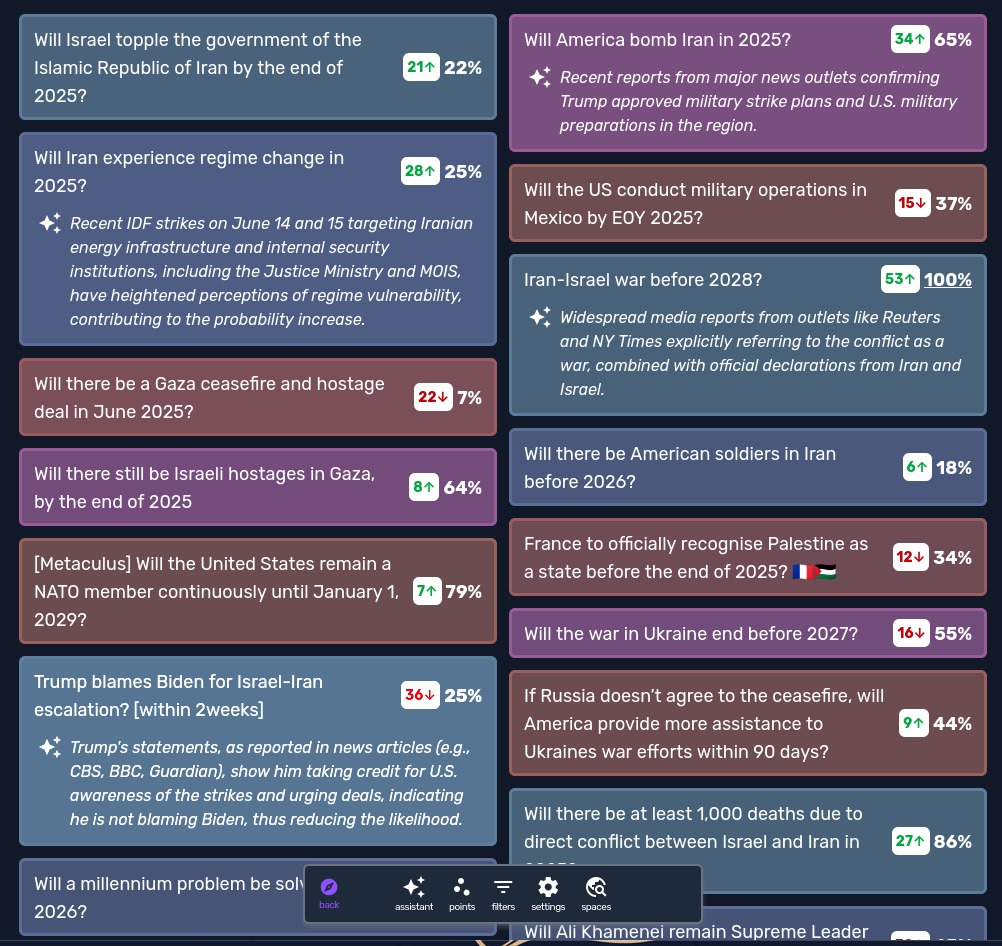
The platform uses text to vector embeddings (semantic similarity) to retrieve markets. Explains why probability shifts occurred (daily, weekly, monthly and yearly) by showing in the feed small summaries of all recent comments for individual markets. You can also create your own areas you'd like to track and explore public ones created by other users.
I use it every day to get an accurate idea of where the world is heading or find markets to trade in areas I care about.
The number of daily active users will be measured by the average of the last 3 days of June.
You can check out the app here: newstag.app
Or download it on android: https://play.google.com/store/apps/details?id=app.newstag.twa
I will not bet.
Screenshots:
Update 2025-06-11 (PST) (AI summary of creator comment): - Bots will not count towards the daily active users.
Update 2025-06-12 (PST) (AI summary of creator comment): The creator has stated they do not currently have a reliable way to count daily active users. Current active user figures shared are based on sign-ups, which the creator indicates is distinct from how daily active users will be determined for resolution.
Update 2025-06-21 (PST) (AI summary of creator comment): - In response to a user question, the creator has confirmed that coordinated efforts to increase the user count (e.g., asking friends to use the app) are allowed and will be counted.
Update 2025-06-28 (PST) (AI summary of creator comment): - To be counted as a daily active user, one must be signed in with Google.
The creator has stated the counting period begins now and will last until the end of June. This updates the original criteria which specified the average of the last 3 days of June.
The app now displays a real-time number of active users in the last 24 hours.
Update 2025-06-28 (PST) (AI summary of creator comment): - The in-app counter displaying the number of active users is visible without needing to sign in.
Update 2025-06-28 (PST) (AI summary of creator comment): - In response to a user asking if activity solely intended to influence the market counts, the creator confirmed that making the market gameable was the intent.
 1,000
1,000🏅 Top traders
| # | Trader | Total profit |
|---|---|---|
| 1 | Ṁ1,551 | |
| 2 | Ṁ740 | |
| 3 | Ṁ604 | |
| 4 | Ṁ307 | |
| 5 | Ṁ299 |
@jessald Also since the active user count is the average of the last three days of June they would want to start doing this today.
@jessald Making this market gameable was always the intent since it creates the incentive to share the app.
@traders The counting of users starts today and will last until the end of June, for the time period to avoid bots you can use the app only if signed in with Google.
In the app you can also see real-time number of active users in the last 24 hours.
@patrik come on, that's an incentive to fake increase the active users just to see the number, without actually using the app
0-10 at 70% is overpriced.