
Resolution Criteria:
This question will resolve as Yes if we find a positive statistically significant (p < 0.05) coefficient for the “social portfolio diversity” variable (defined below) in a linear regression predicting well-being (with a measure of the total amount of in-person social interaction included as a control variable). Otherwise it will resolve as No.
Original study results
The primary hypothesis in the original study was that in-person social portfolio diversity predicts higher well-being, even when controlling for the proportion of episodes in the day that included in-person social interaction.
The authors ran a linear regression predicting participants' well-being, with (1) social portfolio diversity and (2) the proportion of episodes in the day that included in-person social interaction as predictor variables. They found a positive, statistically significant (p < 0.05) coefficient for social portfolio diversity. We will consider this result to have replicated if we also find a positive, statistically significant coefficient for that variable when we run the same linear regression using newly-collected data.
Study summary
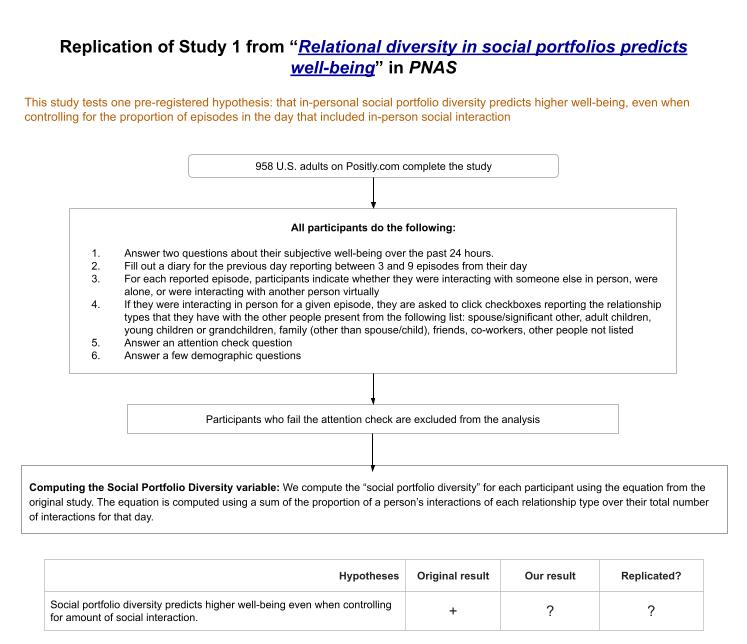
Click here for a higher resolution version of the diagram
In the original study and in our replication, participants answered questions about their subjective well-being, then they filled out a diary reporting on their day the previous day. For each episode of their day they were asked if they were with anyone else in person. When they reported spending time in-person with others, they were asked to check off the relationship types they had with the people who were present (e.g., spouse/significant other, friends, co-workers, etc.) Participants then answered an attention check question and a few demographic questions.
The social portfolio diversity variable, in both the original study and in our replication, is calculated using the following equation:
The original study authors chose this formula because it is similar to Shannon’s biodiversity index. The equation involves computing, for each of the relationship categories a person reported having interactions with, the proportion of their total interactions that this category represented (which the authors call “p”). For each category of relationship, this proportion is multiplied by its natural logarithm. Finally, all these products are summed together and multiplied by negative one so that the final result is a positive number.
The proportion of episodes of in-person social interaction is the number of episodes in the day reported with in-person social interaction over the total number of episodes reported for the day.
The well-being dependent variable is calculated by averaging two questions about subjective well-being, one asking about how happy the person has felt over the last 24 hours (from 0 to 10), and the other asking them to place themselves on a ladder from 0 to 10 representing how well their life is going.
The original study included 578 participants after excluding participants who failed the attention check. Our replication included 963 participants after excluding those who failed the attention check (which meant we had 90% power to detect an effect size as low as 75% of the original effect size) recruited from MTurk via Positly. You can preview our replication study (as participants saw it) here.
Background info
Transparent Replications by Clearer Thinking aims to replicate studies from randomly-selected, newly-published papers in prestigious psychology journals, as well as any psychology papers recently published in Nature or Science involving online participants. “Relational diversity in social portfolios predicts well-being” is one of the most recent psychology papers involving online participants published in the Proceedings of the National Academy of Sciences. Study 1 from that paper met our criteria for replication.
Context: How often have social science studies replicated in the past?
In one historical project that attempted to replicate 100 experimental and correlation studies from 2008 in three important psychology journals, analysis indicated that they successfully replicated 40%, failed to replicate 30%, and the remaining 30% were inconclusive. (To put it another way, of the replications that were not inconclusive, 57% were successful replications.)
In another project, researchers attempted to replicate all experimental social science science papers (that met basic inclusion criteria) published in Nature or Science (the two most prestigious general science journals) between 2010 and 2015. They found a statistically significant effect in the same direction as the original study for 62% (i.e., 13 out of 21) studies, and the effect sizes of the replications were, on average, about 50% of the original effect sizes. Replicability varied between 57% and 67% depending on the replicability indicator used.
The replication described here was run as part of Transparent Replications by Clearer Thinking, which has not run enough replications yet for us to give any base replication rates. Having said that, if you’re interested in reading more about the project, you can read more here. And here is where you can find write-ups for the previous replications we’ve completed.
 1,000
1,000🏅 Top traders
| # | Trader | Total profit |
|---|---|---|
| 1 | Ṁ34 | |
| 2 | Ṁ16 | |
| 3 | Ṁ6 | |
| 4 | Ṁ6 |