Live trading market, does not close early. Resolves according to official NHC advisories.
Update 2025-10-24 (PST) (AI summary of creator comment): Special update advisories issued by the NHC (in addition to regular advisories) will count for resolution purposes.
 1,000
1,000🏅 Top traders
| # | Trader | Total profit |
|---|---|---|
| 1 | Ṁ858 | |
| 2 | Ṁ195 | |
| 3 | Ṁ105 | |
| 4 | Ṁ104 | |
| 5 | Ṁ62 |
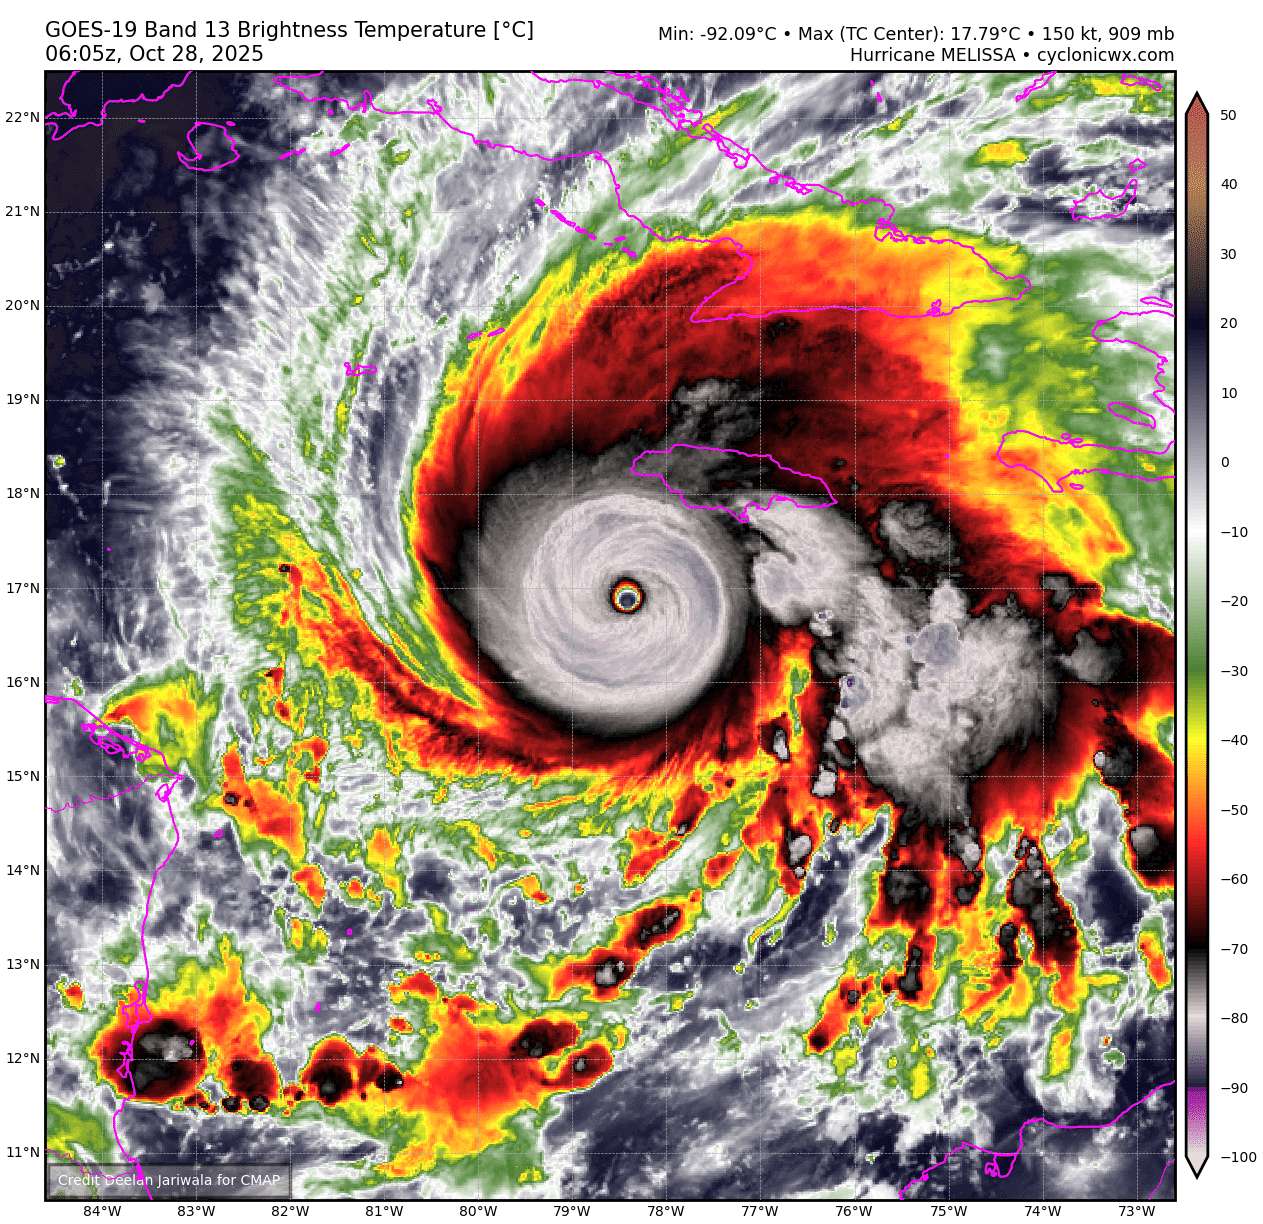
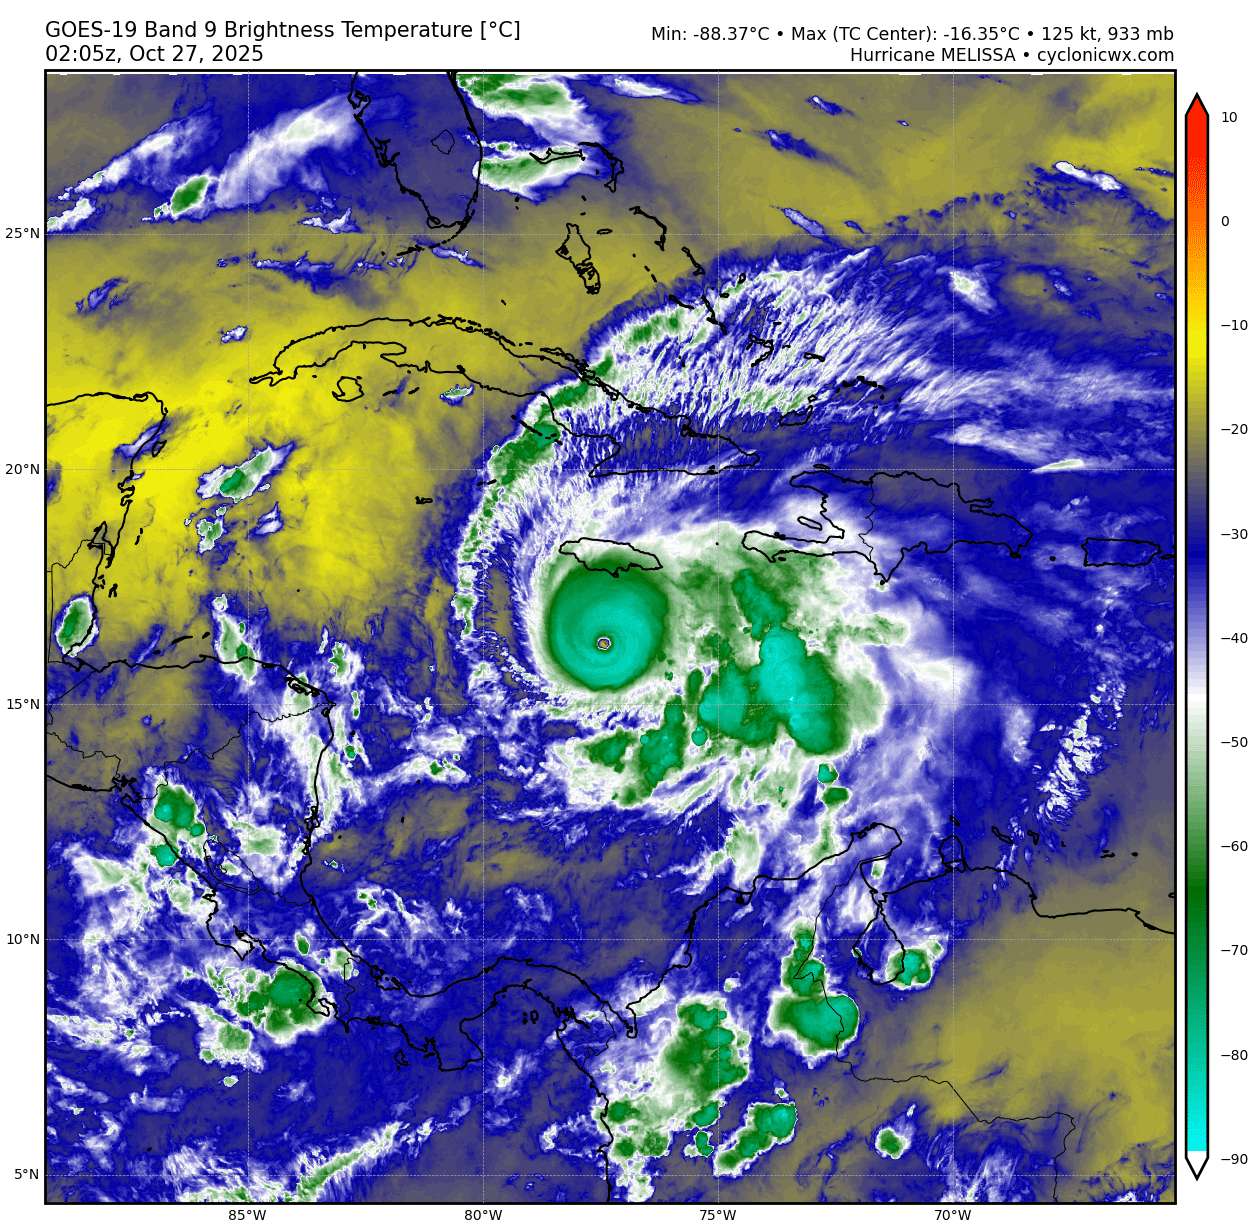
Landfall at ~17Z
WTNT63 KNHC 281701
TCUAT3
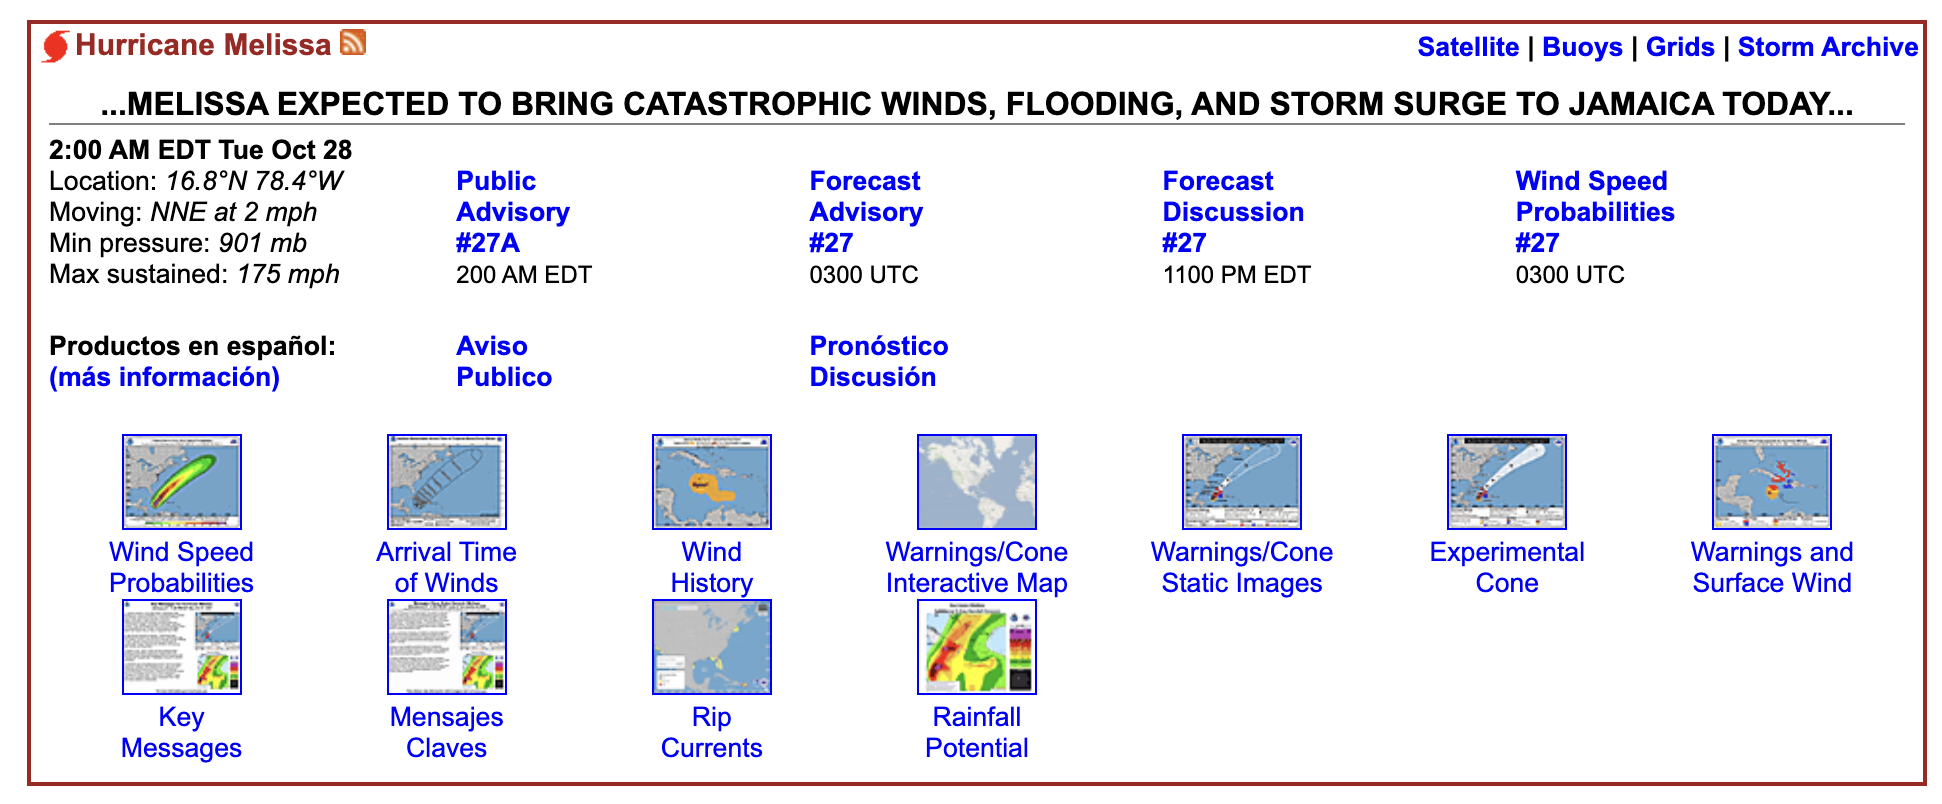
Hurricane Melissa Tropical Cyclone Update
NWS National Hurricane Center Miami FL AL132025
100 PM EDT Tue Oct 28 2025
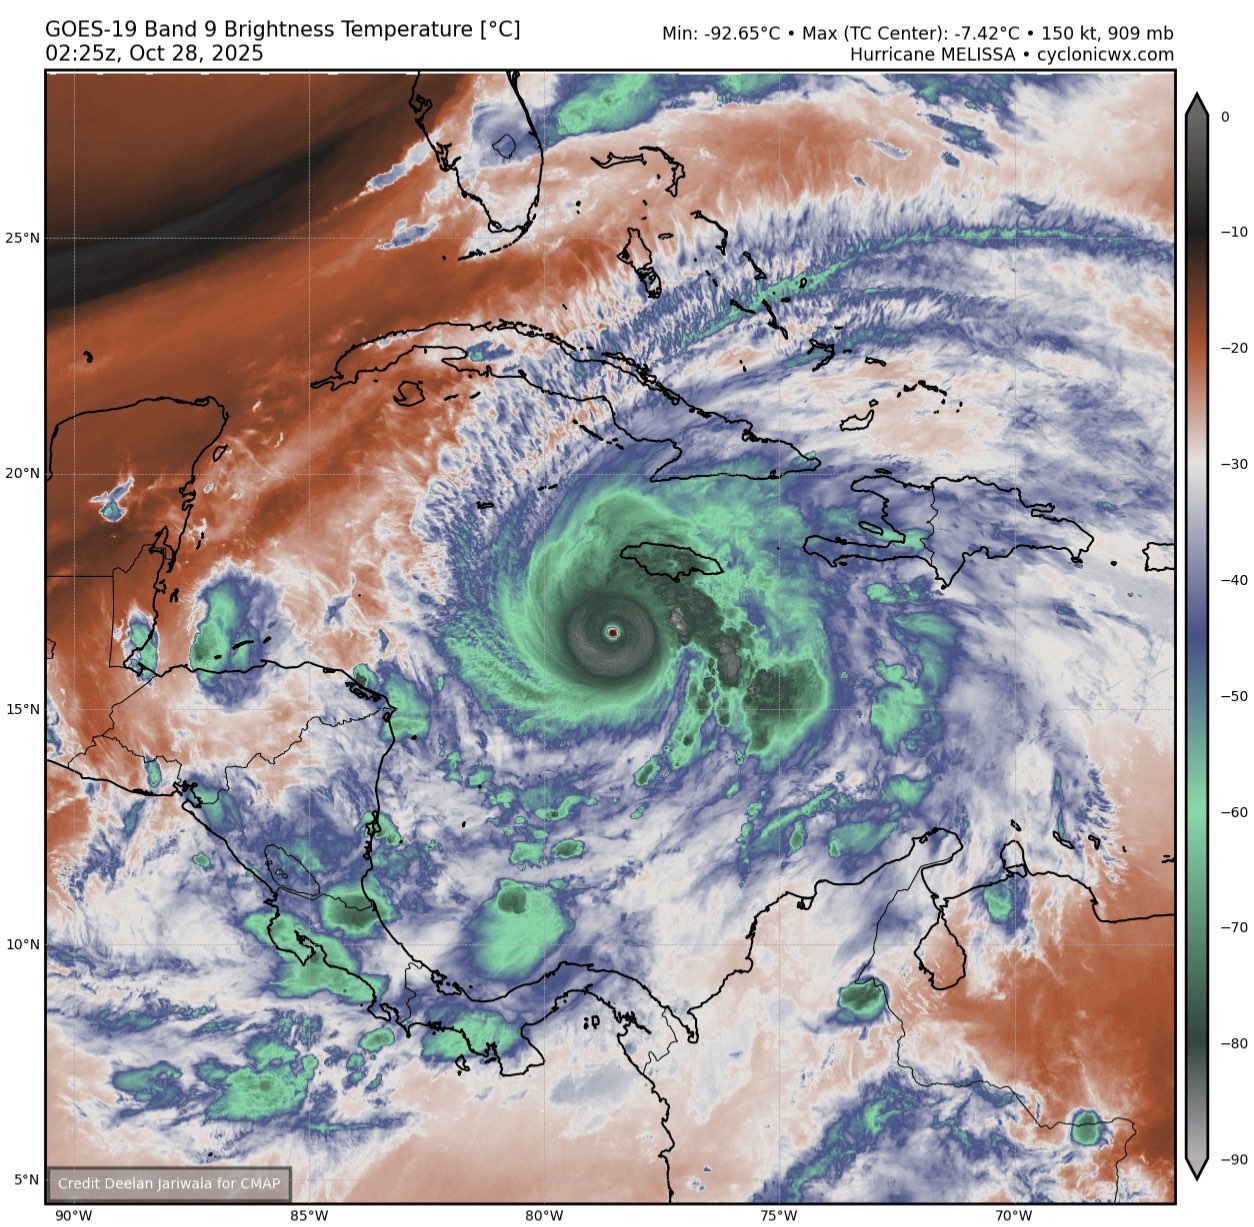
...CATEGORY 5 MELISSA MAKES LANDFALL IN JAMAICA...
...ONE OF THE MOST POWERFUL HURRICANE LANDFALLS ON RECORD IN THE
ATLANTIC BASIN...
Melissa has made landfall in southwestern Jamaica near New Hope with
estimated maximum sustained winds of 185 mph (295 km/h) and an
estimated minimum central pressure of 892 mb (26.34 inches).
THIS IS AN EXTREMELY DANGEROUS AND LIFE-THREATENING SITUATION! Do
not leave your shelter as the eye passes over, as winds will
quickly, and rapidly increase on the other side of the eye.
Residents should remain in place through the passage of these
life-threatening conditions. To protect yourself from wind, the
best thing you can do is put as many walls as possible between you
and the outside. An interior room without windows, ideally one where
you can also avoid falling trees, is the safest place you can be in
a building. You can cover yourself with a mattress and wear a
helmet for added protection.
The next position update will be provided with the intermediate
advisory at 200 PM EDT (1800 UTC).
SUMMARY OF 100 PM EDT...1700 UTC...INFORMATION
-----------------------------------------------
LOCATION...18.1N 78.0W
ABOUT 25 MI...40 KM SE OF NEGRIL JAMAICA
ABOUT 145 MI...235 KM S OF GUANTANAMO CUBA
MAXIMUM SUSTAINED WINDS...185 MPH...295 KM/H
PRESENT MOVEMENT...NNE OR 25 DEGREES AT 9 MPH...15 KM/H
MINIMUM CENTRAL PRESSURE...892 MB...26.34 INCHES
$$
Forecaster Kelly
@parhizj Definitely thought the bid for <900 mbar was toast when I saw the eye distorting before I went to sleep. How wrong I was.
@Calibrate Went to sleep when the game ended in the 18th inning and recon ended, and did not expect it to deepen so much by next recon... the first drop was 891.7 mb but it appears to be weakening as it nears land as latest drop is 893.7.
Edit: nevermind...
Looks like I didn't miss any recon?
it looks like to me its possible it deepened alot and we missed the true minimum pressure with the gap in recon as it has been weakening as it approaches land
@parhizj There was definitely a recon gap as you said. I remember some dropsonde recording around 899.8 mb, but the minimum extrapolated pressure was around 903 mb, so I kind of discounted that. The other details are kind of fuzzy.
I think Melissa probably goes down as having completed a couple of ERCs, but I've never seen a hurricane maintain its strength while doing so, or complete one in such little time, or send out pressure waves like a black hole merger in the process. Insane.
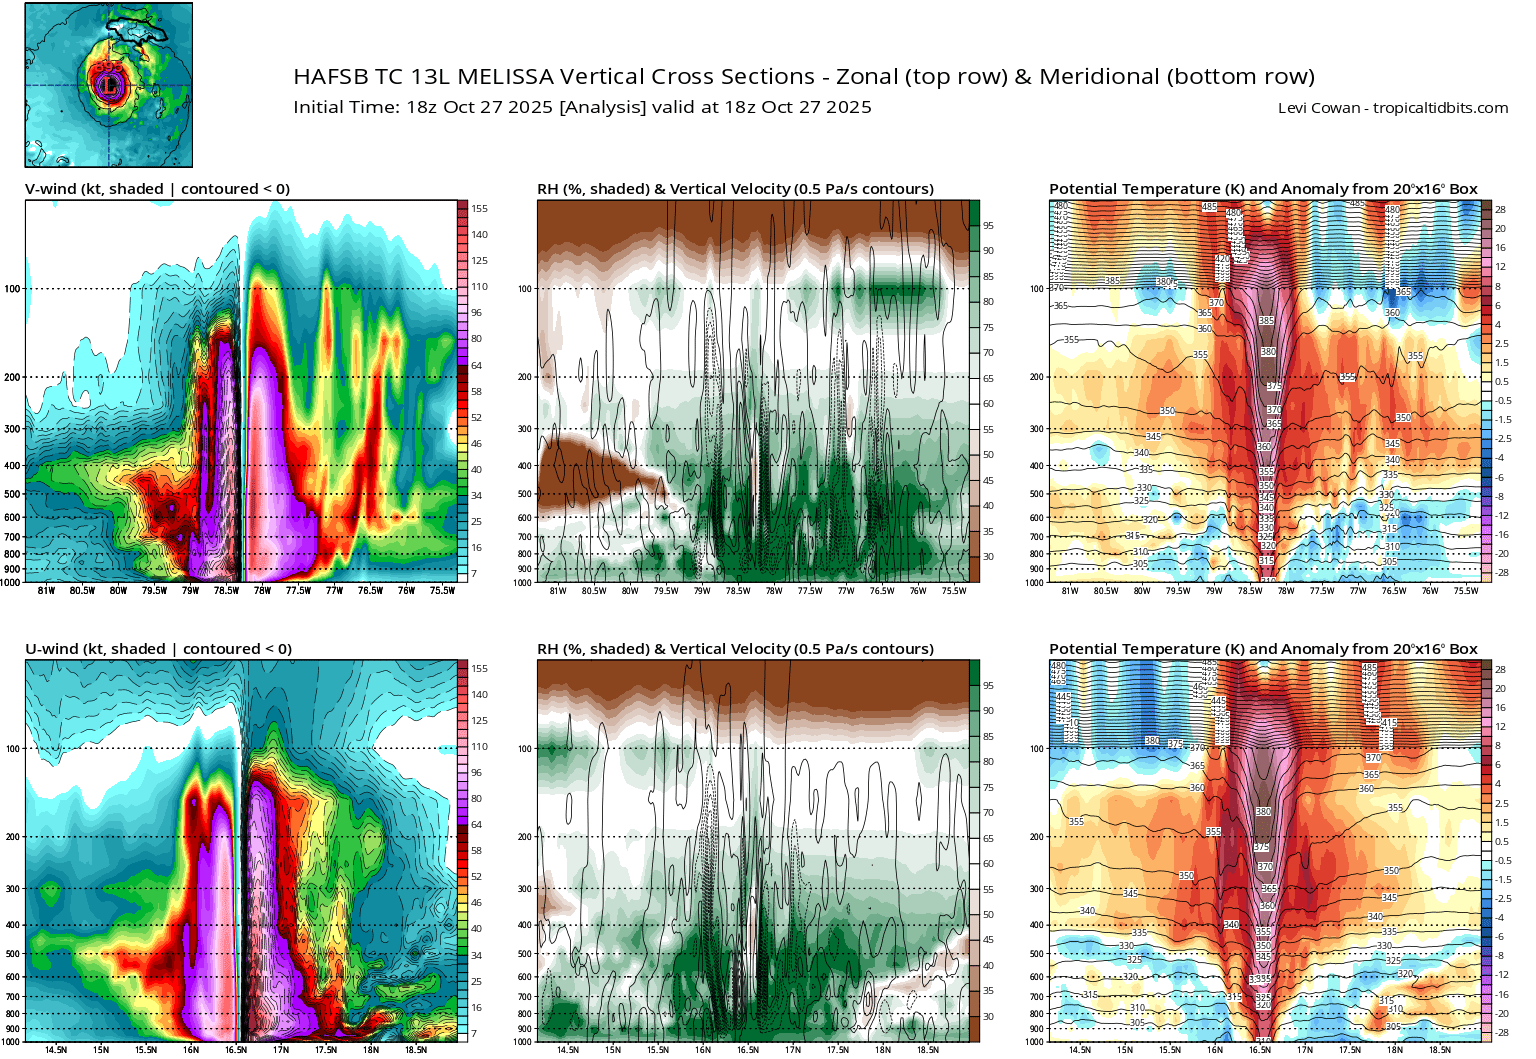
Other than the marginal ERC during that earlier recon that I suspected indicated by M-PERC, if there was a real ERC it was much earlier on when it had not cleared out the eye yet (i.e. just before then) because it was a bit weaker than I expected in terms of its development.. Best bet now would be to look through HAFS models for analysis to check that later on...
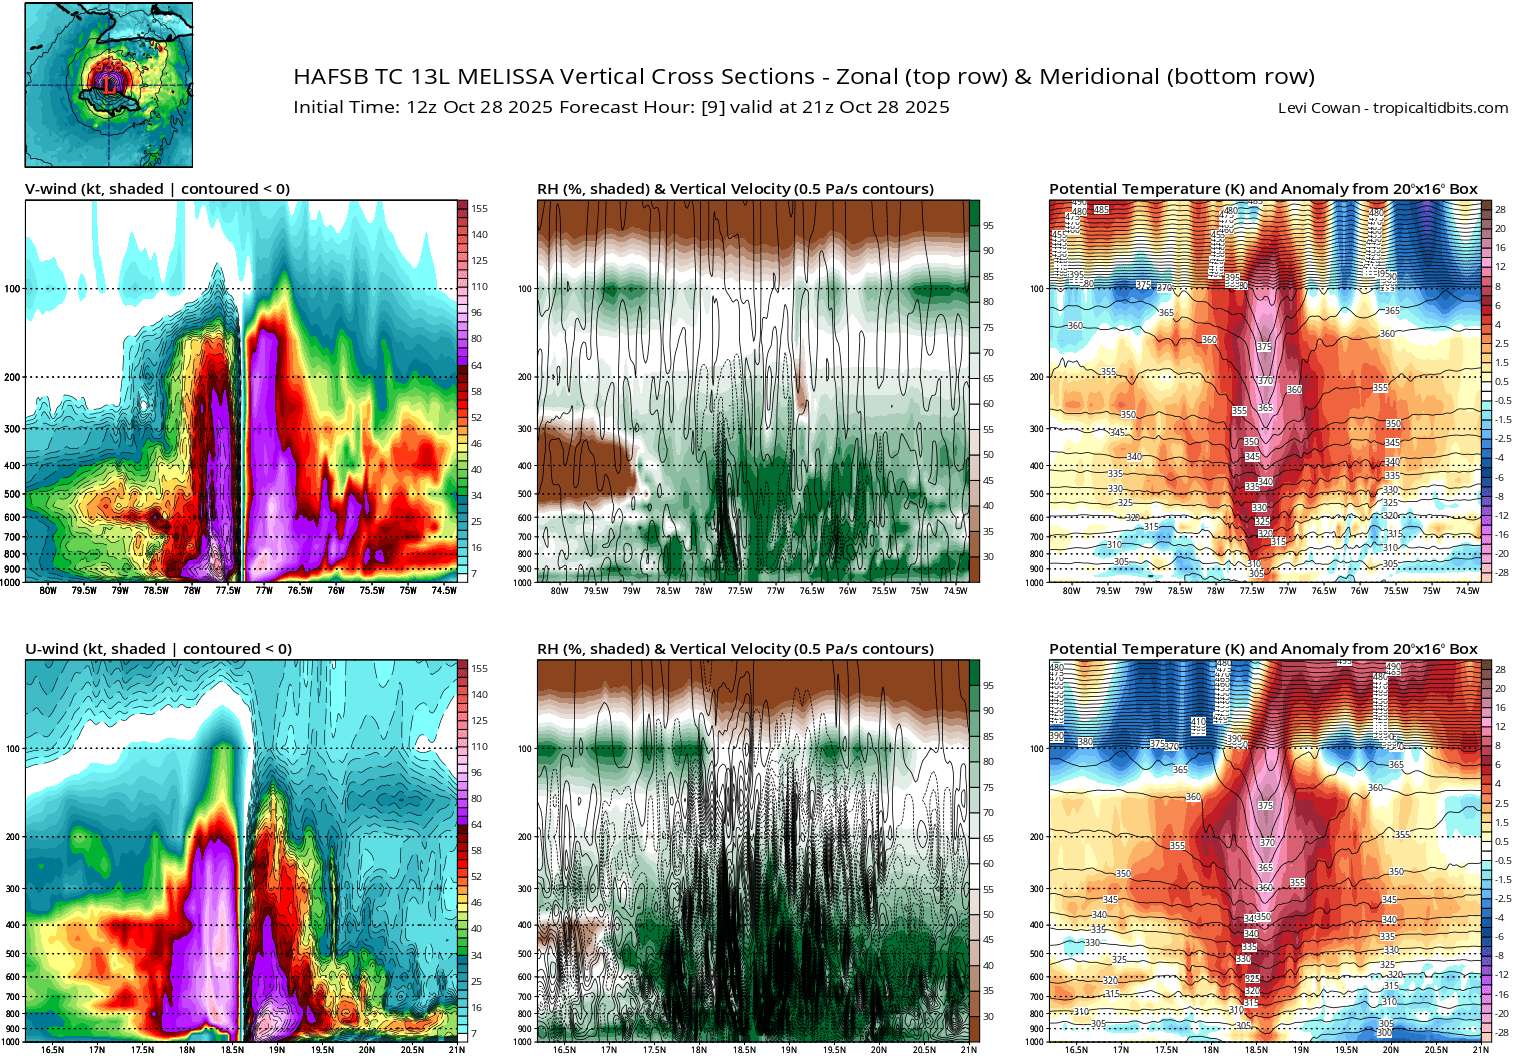
Edit: for future reference... from HAFS-B analysis what looked like to me the marginal ERC with the temporary peak during the gap in recon 18Z (close to the peak hours onset forming the secondary eyewall close to the first I speculate not too far after onset (can make out a secondary eye wall in all three charts)
I could not come up with a clear onset from the HAFS-B analysis but my guess is the secondary eye wall getting disrupted as it tried to form more cleanly so this may be why I see some indication in 06Z but not 12Z and why it took longer for the inflectin point, but in this story it appears to be a much more marginal case than a classical case ( thus a marginal ERC / aborted ERC)
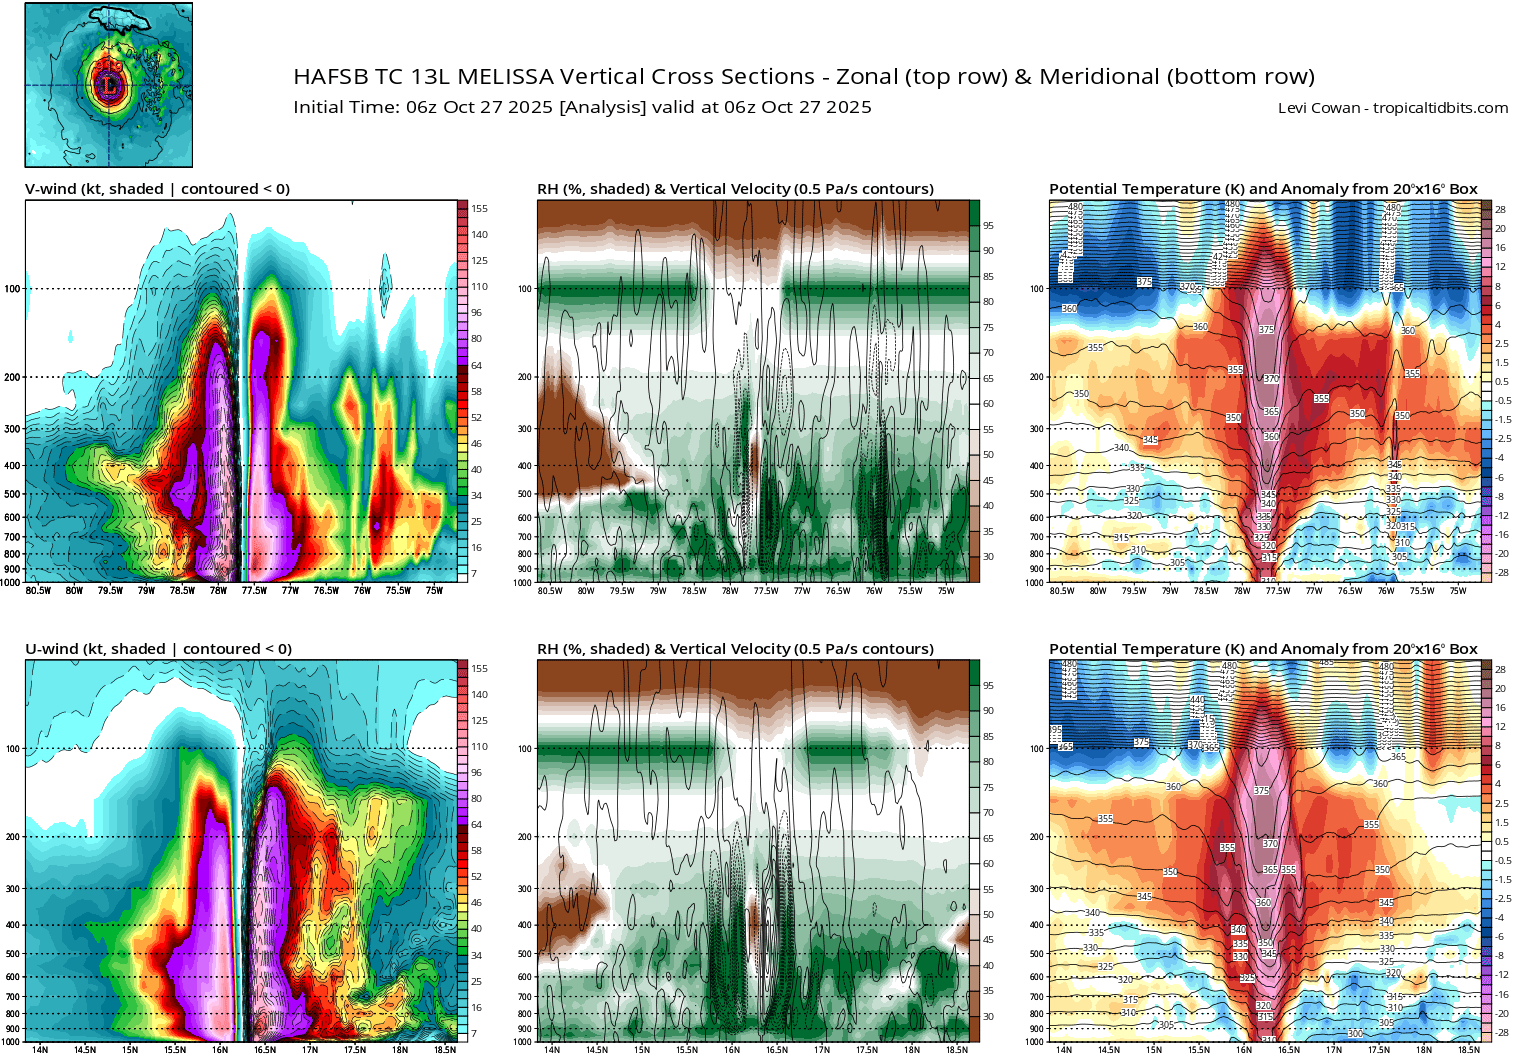
Unfortunately the HAFS analysis of 6 hour intervals doesn't give us a great idea during this period, but a clearer second eye wall (even if a bit asymmetric) is more clearly seen at the 27/18Z analysis in the various charts from the tropicaltidbits vertical cross sections.
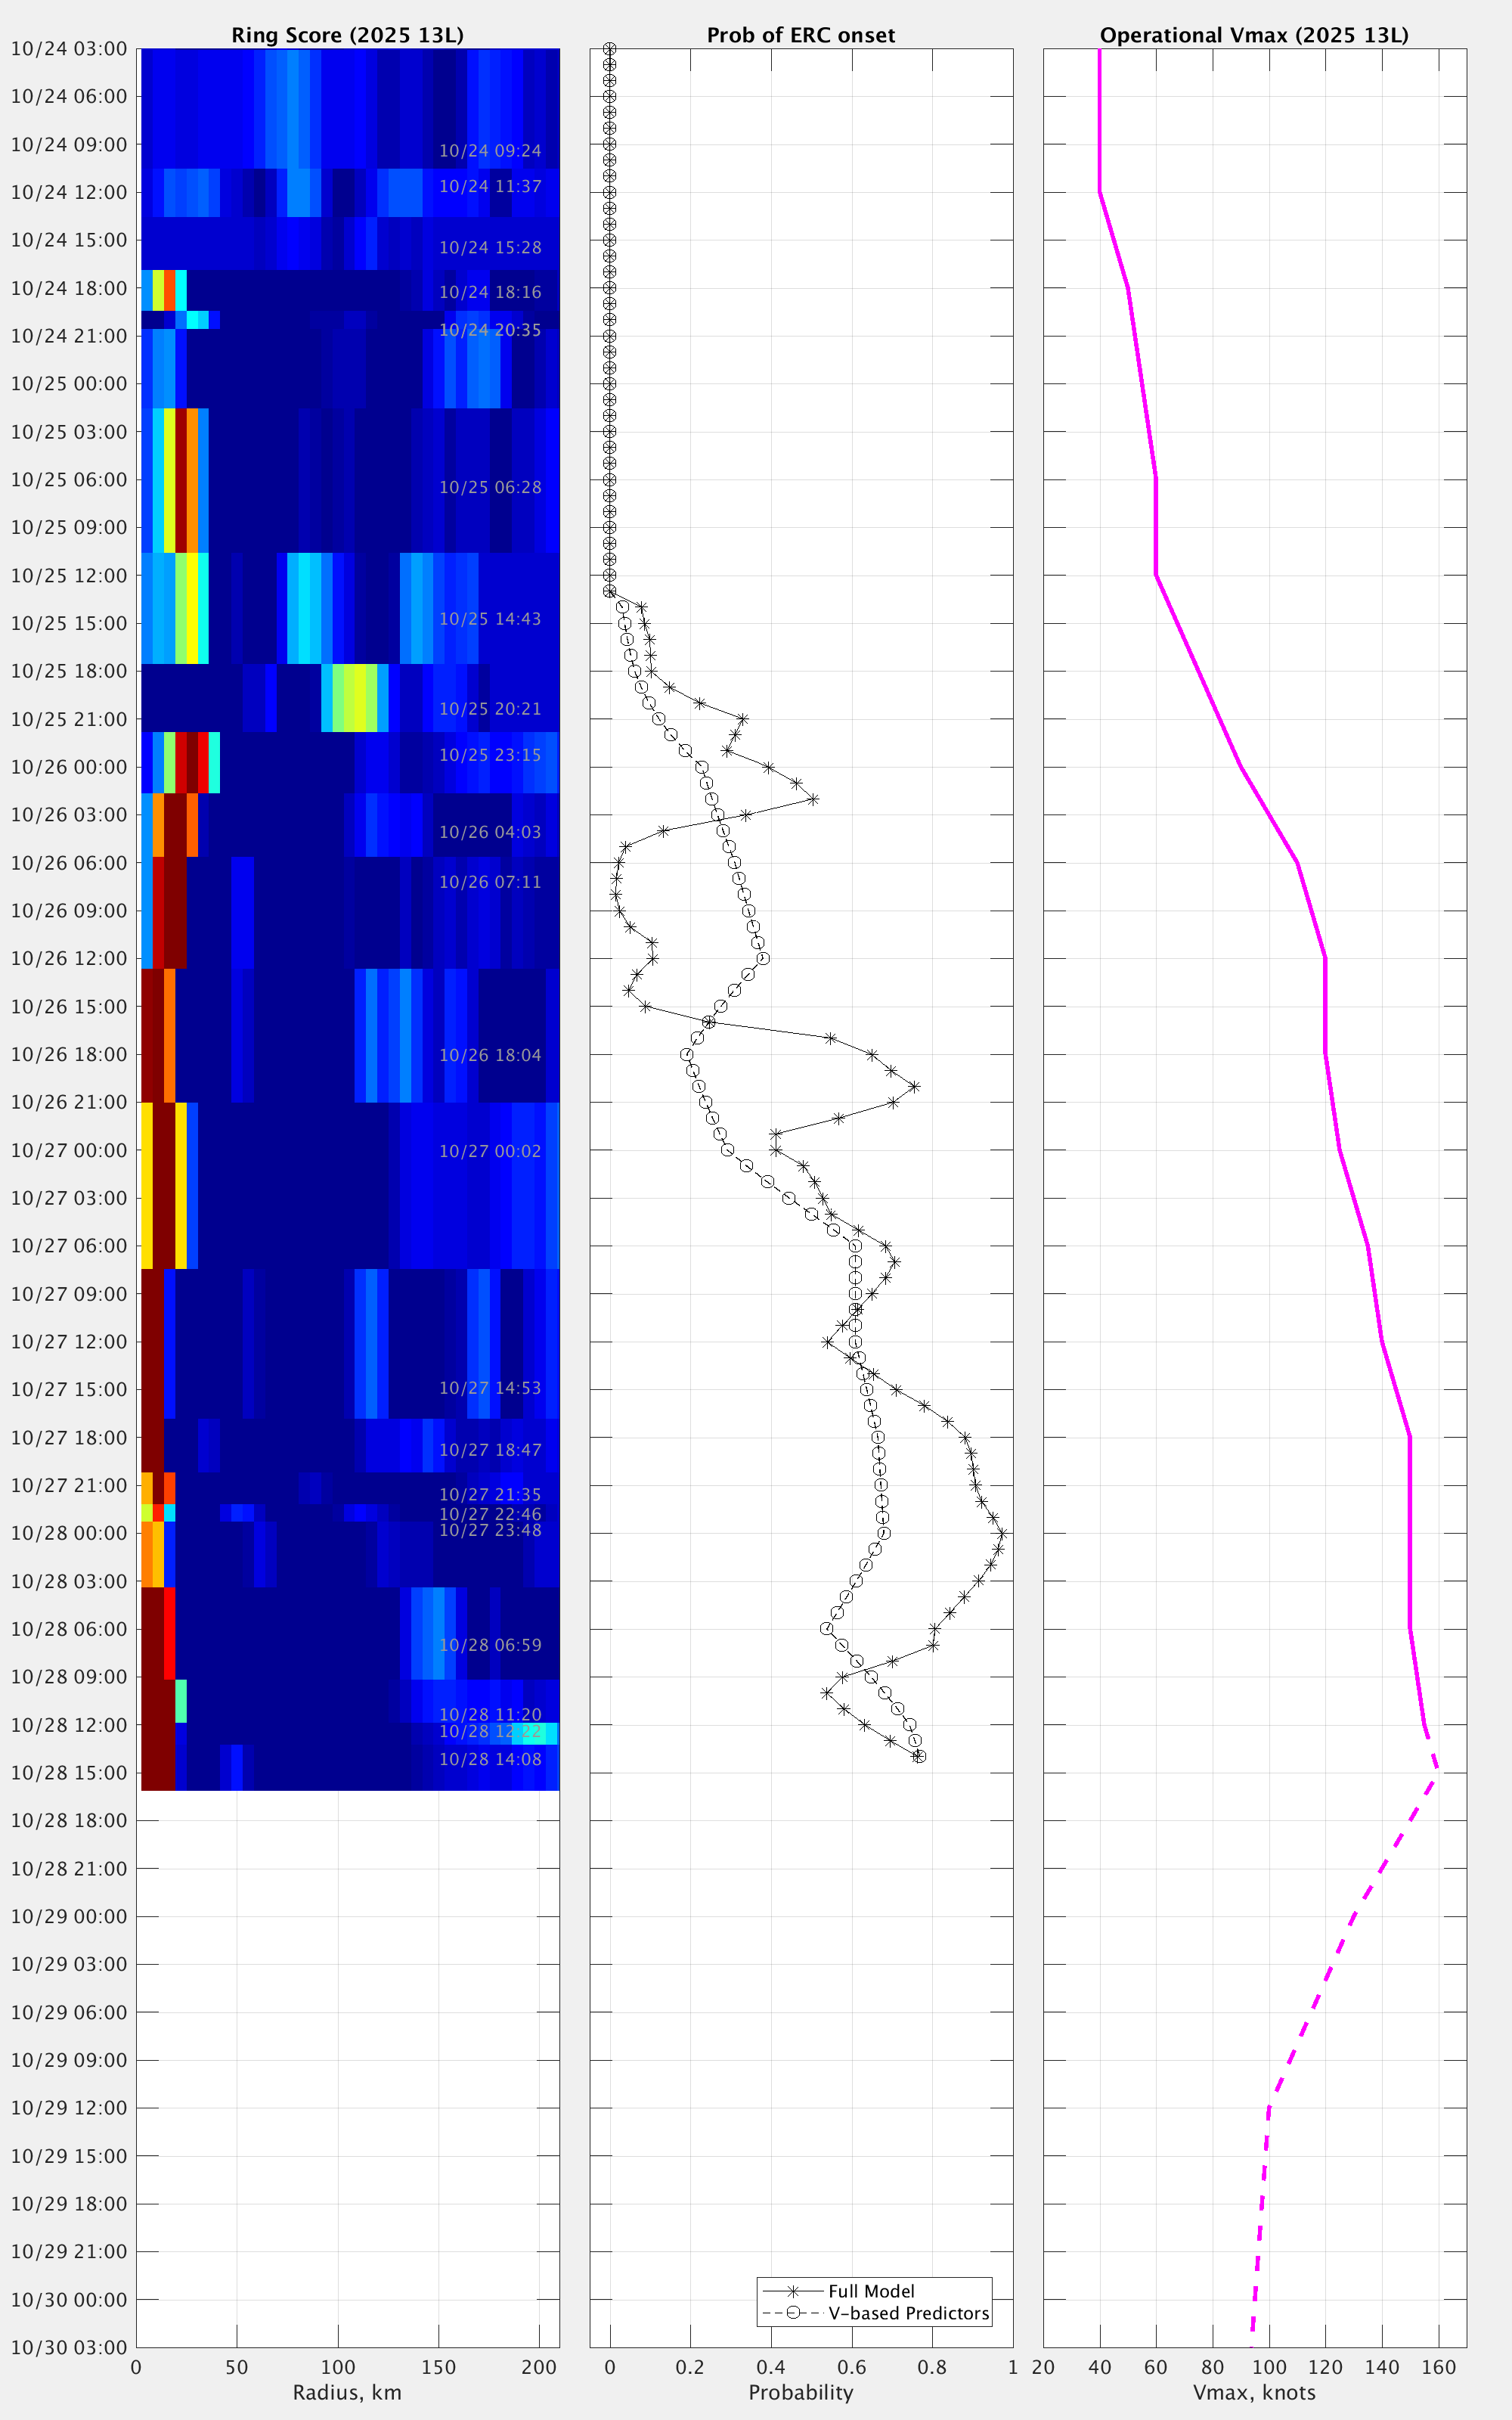
M-PERC for reference:
~ Below I review cyclonicwx and the recon observations.
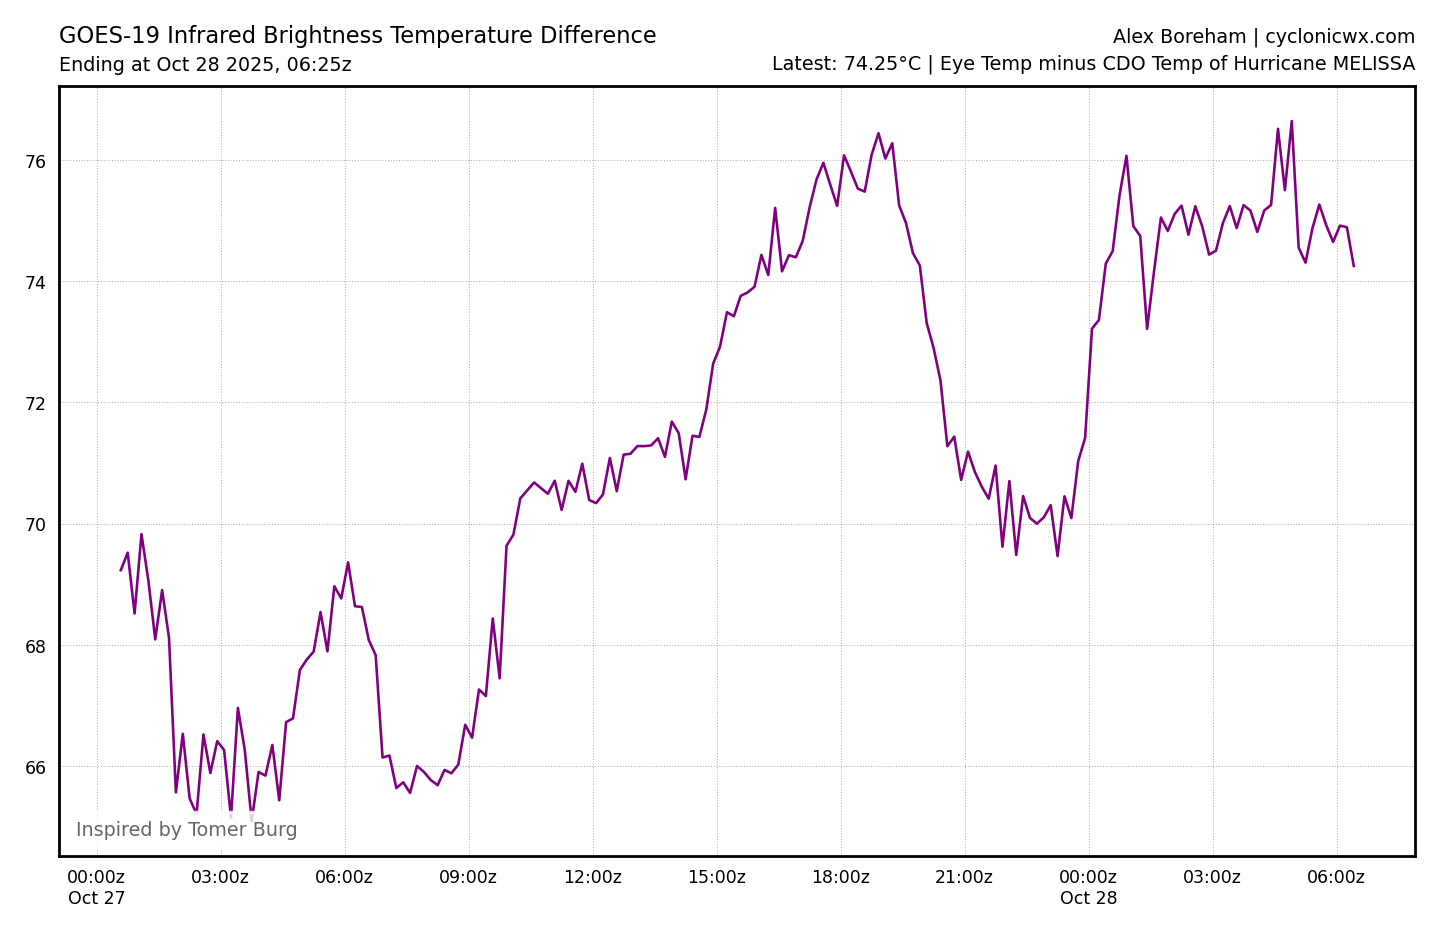
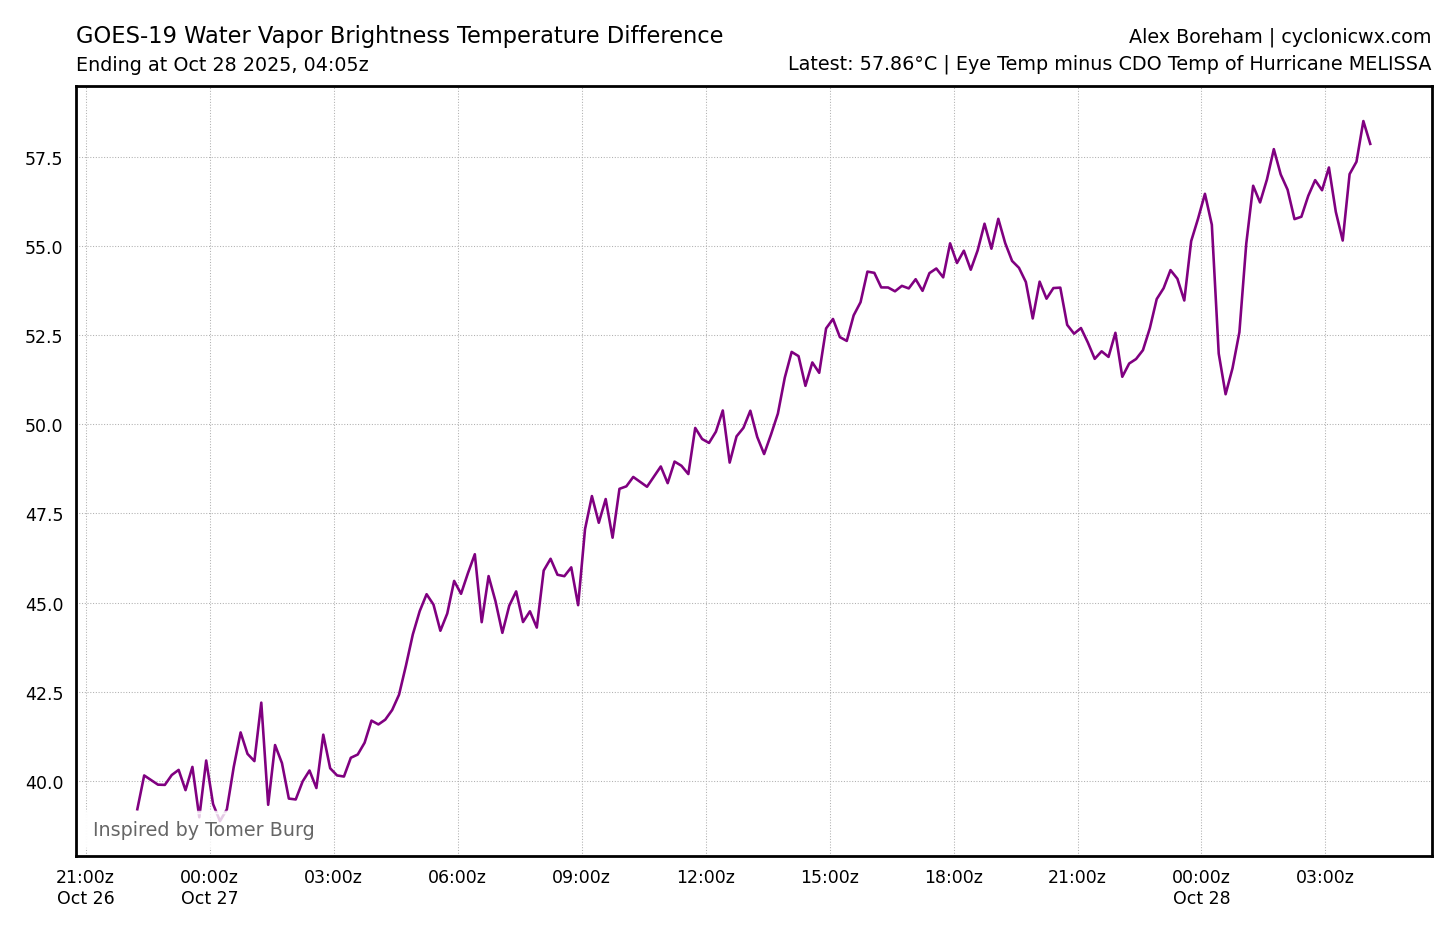
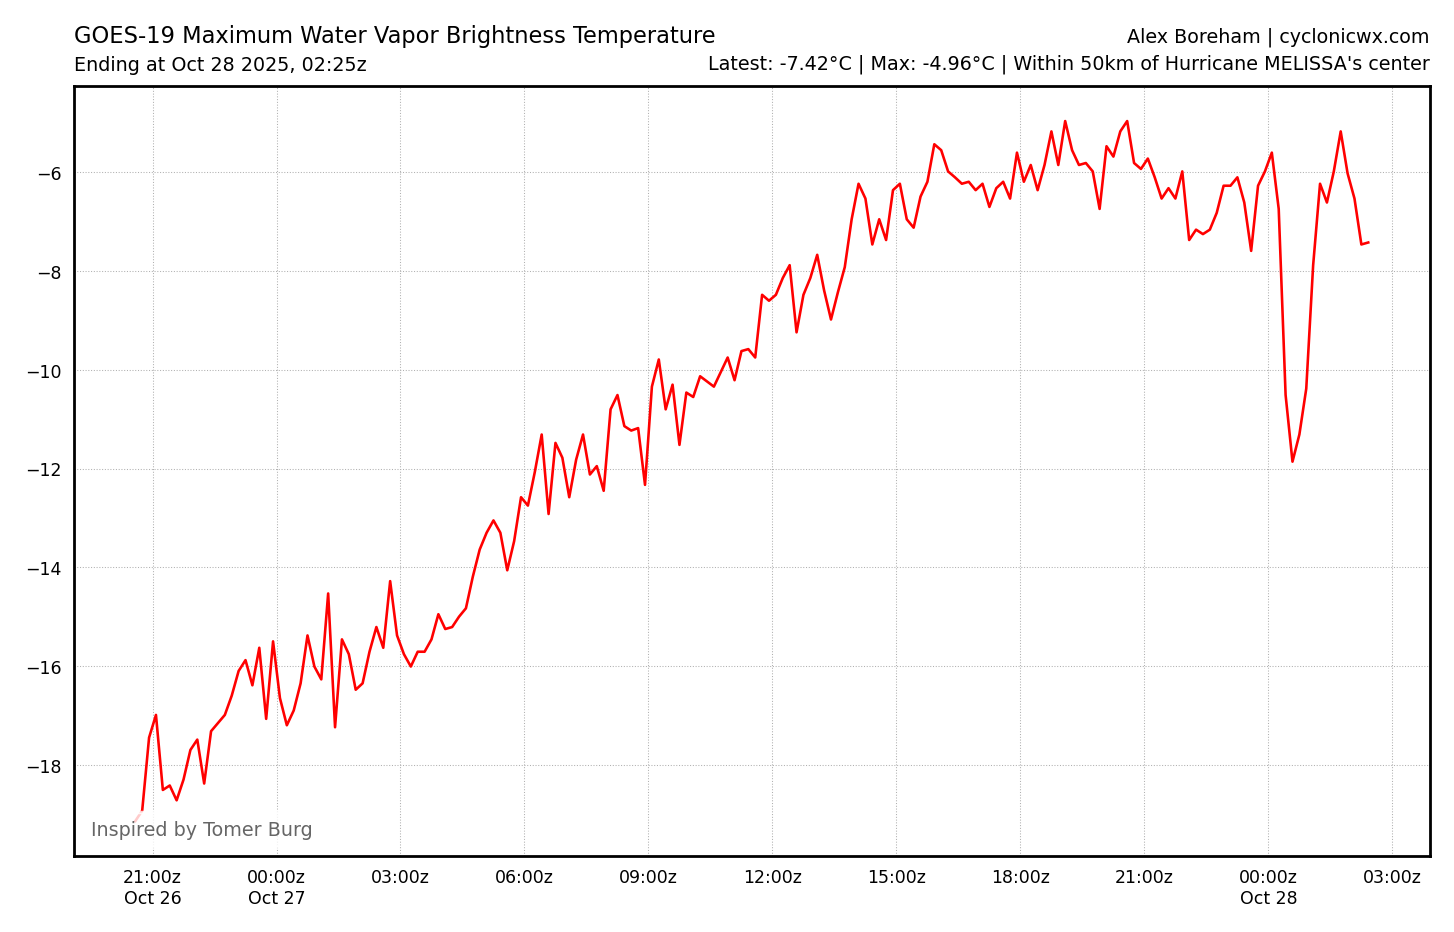
from 19Z-00Z or so there seemed to be a levelling of the strengthening from the charts on cyclonicwx (I guess the broader more vigorous convection prior to this time levelled off as the secondary eyewall closed in, causing the cdo temps to drop first)
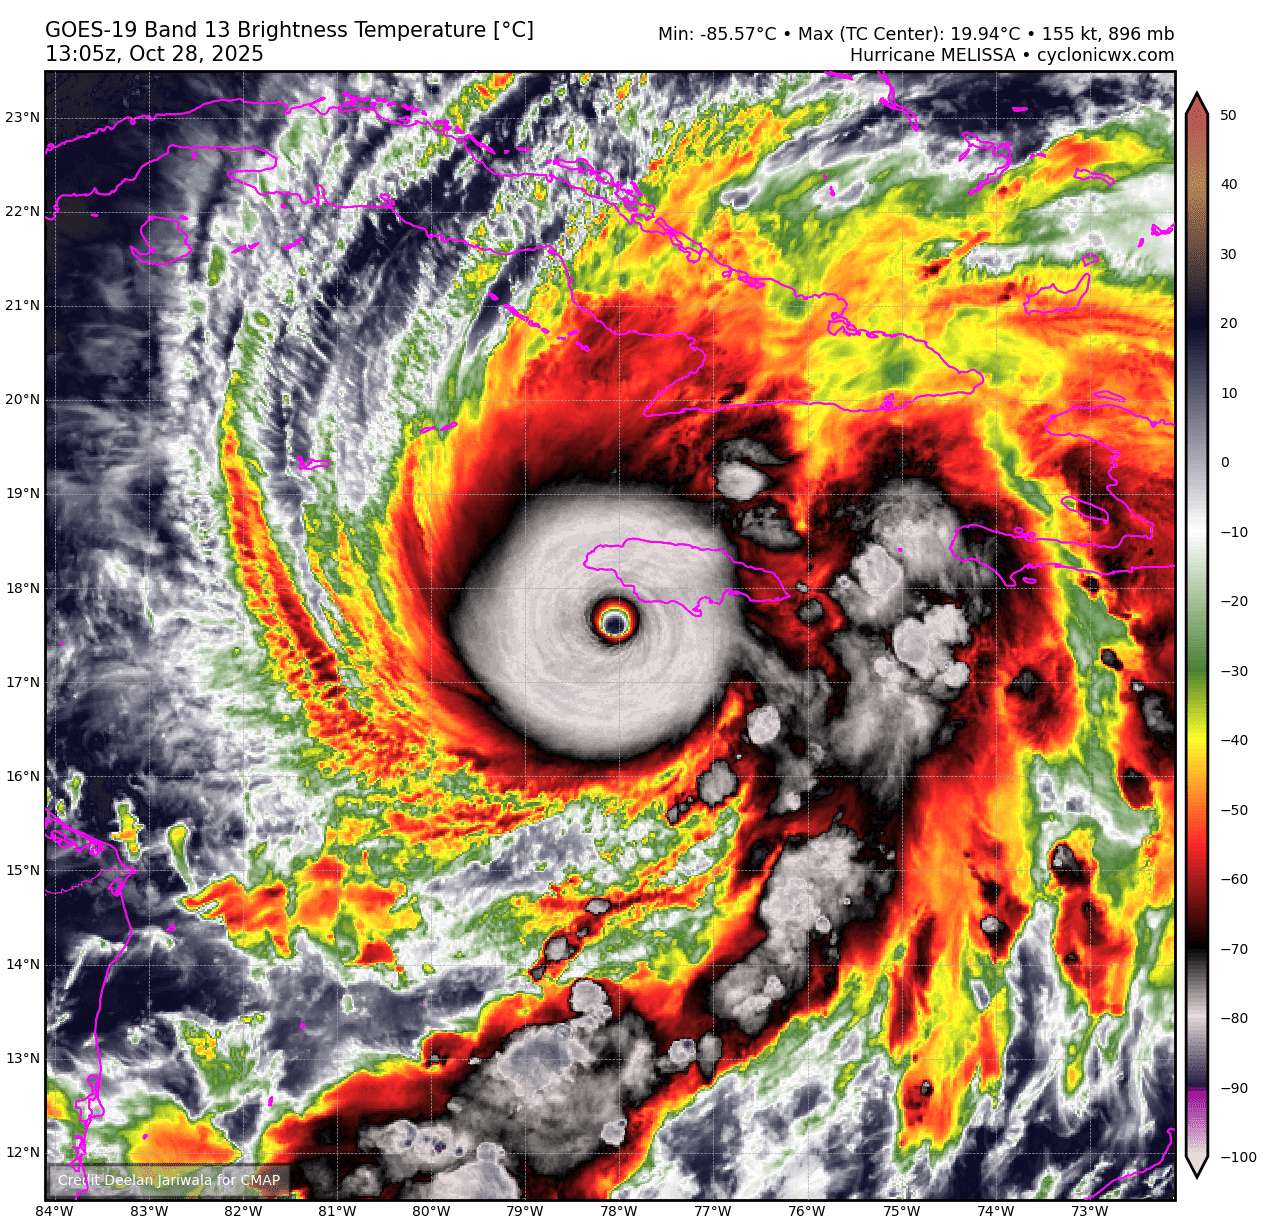
From IR it looked like it was possibly already starting to interact with the eye wall possibly with convective burst in the inner eye wall disrupting the shape temporarily ...
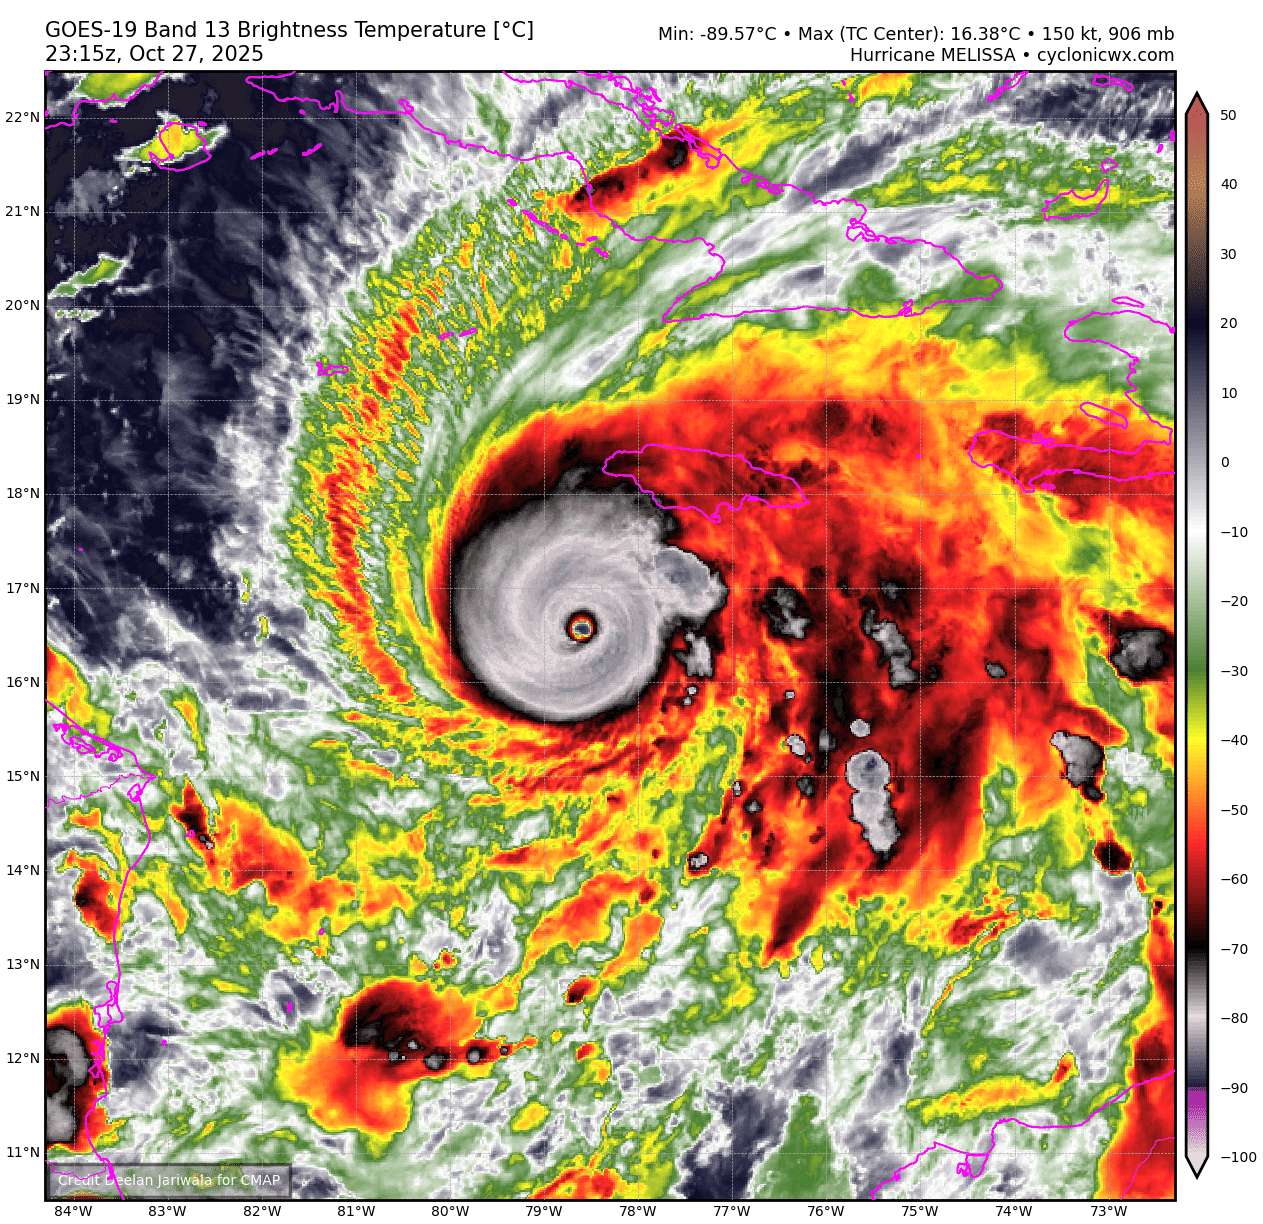
But there was no clear indication on IR at least that the eyewall was being disrupted. Generally I believe it was still strengthening this time (27/19- 28/00Z).
Based on what I saw through 27/00Z I did predict from prior model data (google) around the 27/21Z advisory that we were probably soon near an inflection point and could expect a ERC soon. The M-PERC subsequent analysis of the GCOM-W1 microwave imagery (18Z?) took quite a while longer than this and I could not interpret it myself, but I did predict we would have an ERC around 01Z.
Based on the M-PERC updates (GCOM-W1 and then later subsequent passes) at the time I did predict the ERC would occur around 01Z or so and its clear there was some disruption but nothing too visible on sat imagery that I recall showing the eyewall clearly being replaced, leading me to think it was an aborted / marginal ERC. I also did not seee clear double eye signal in the wind data at the time ...

~
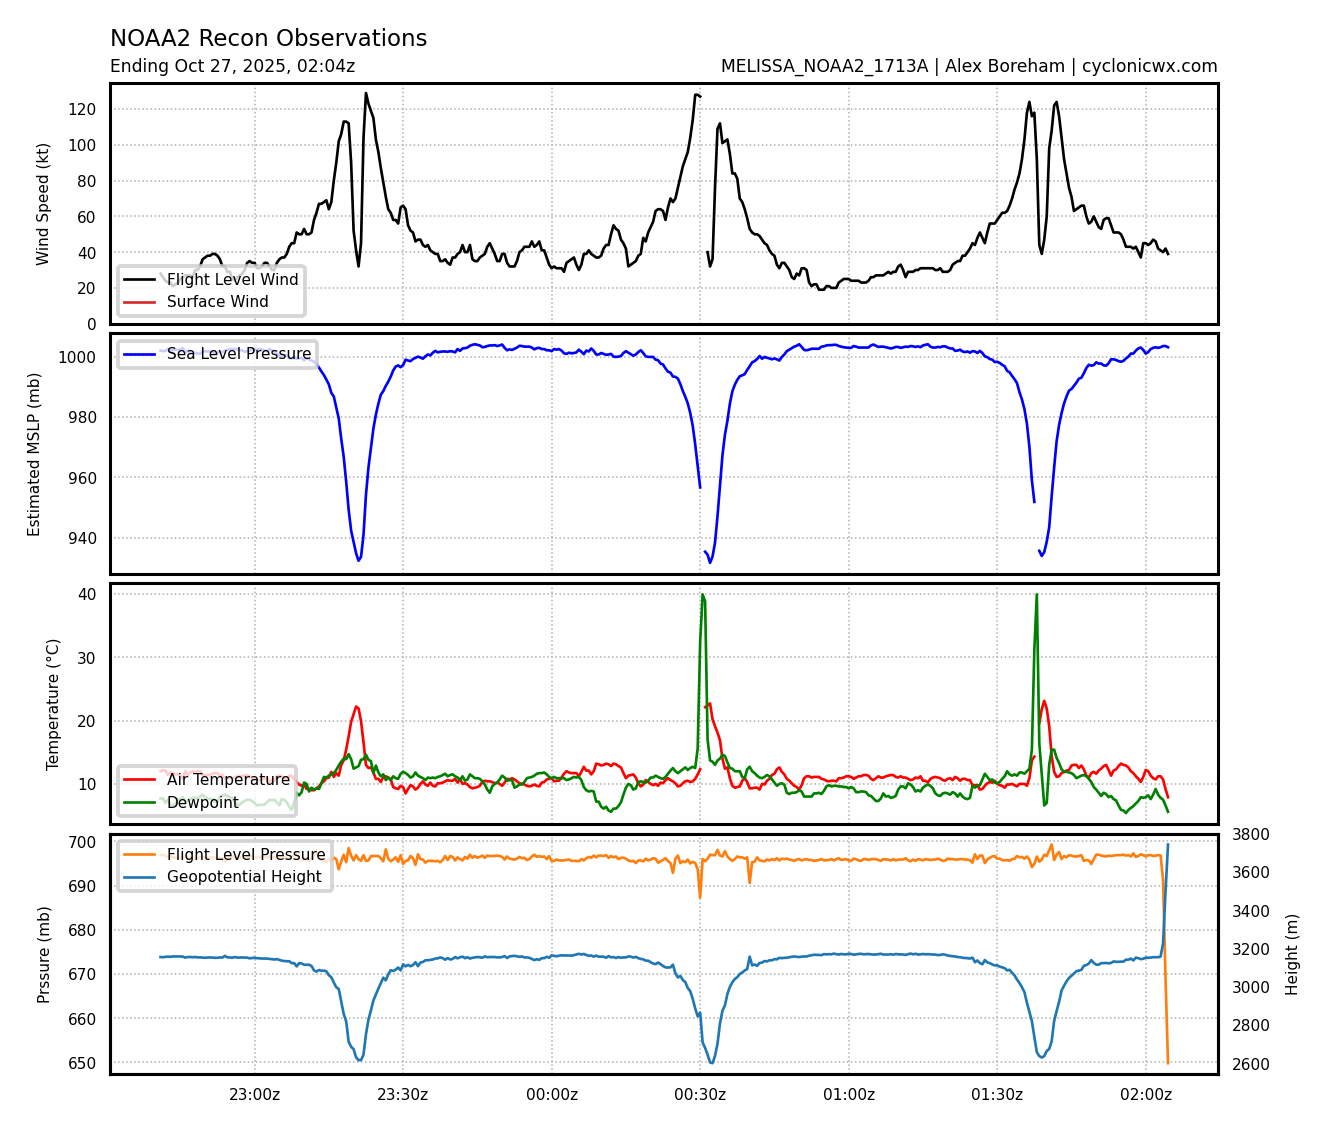
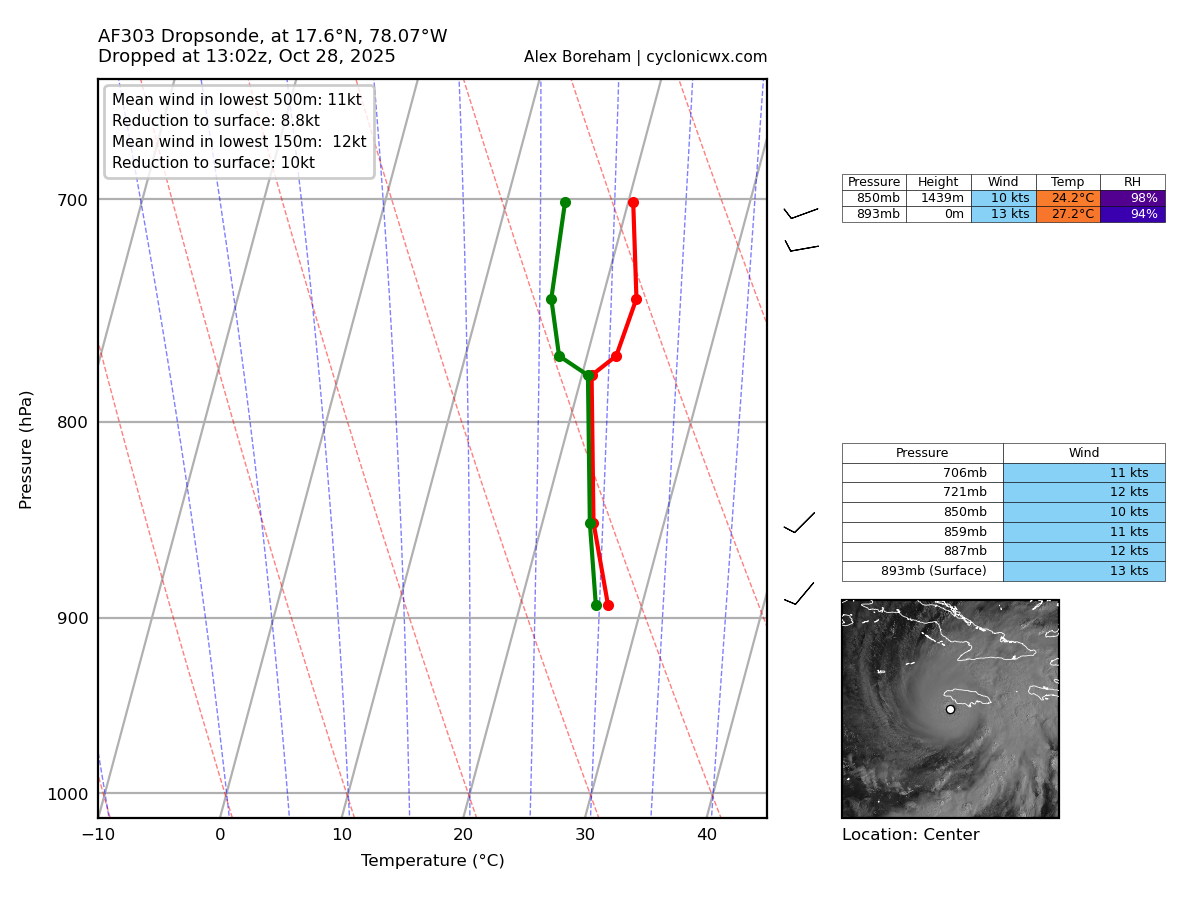
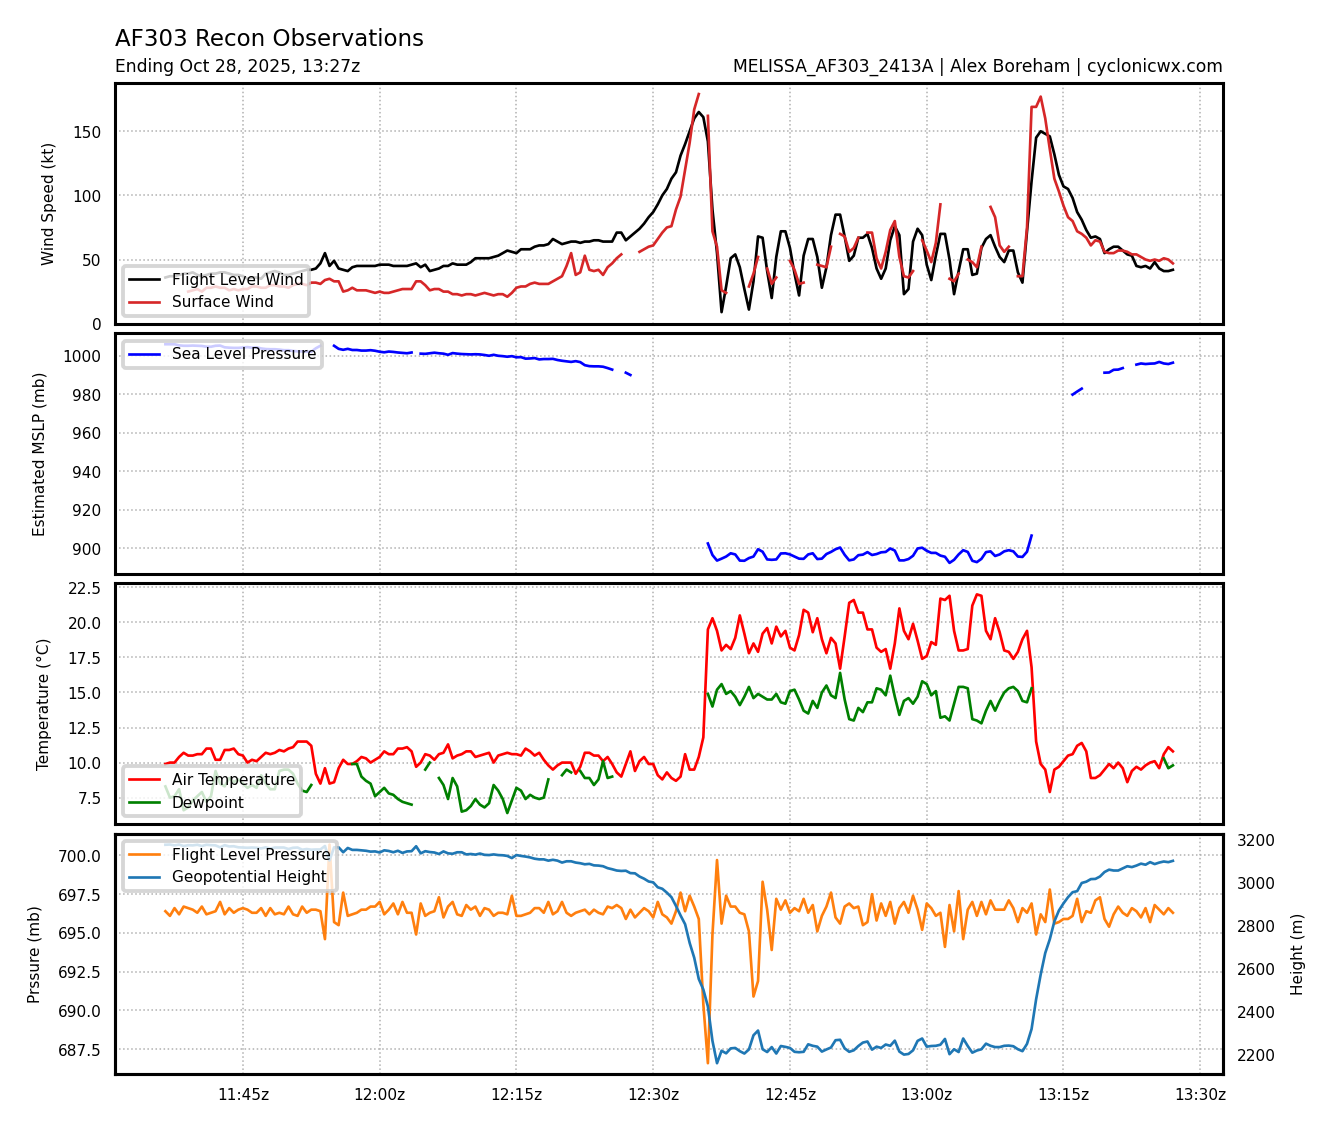
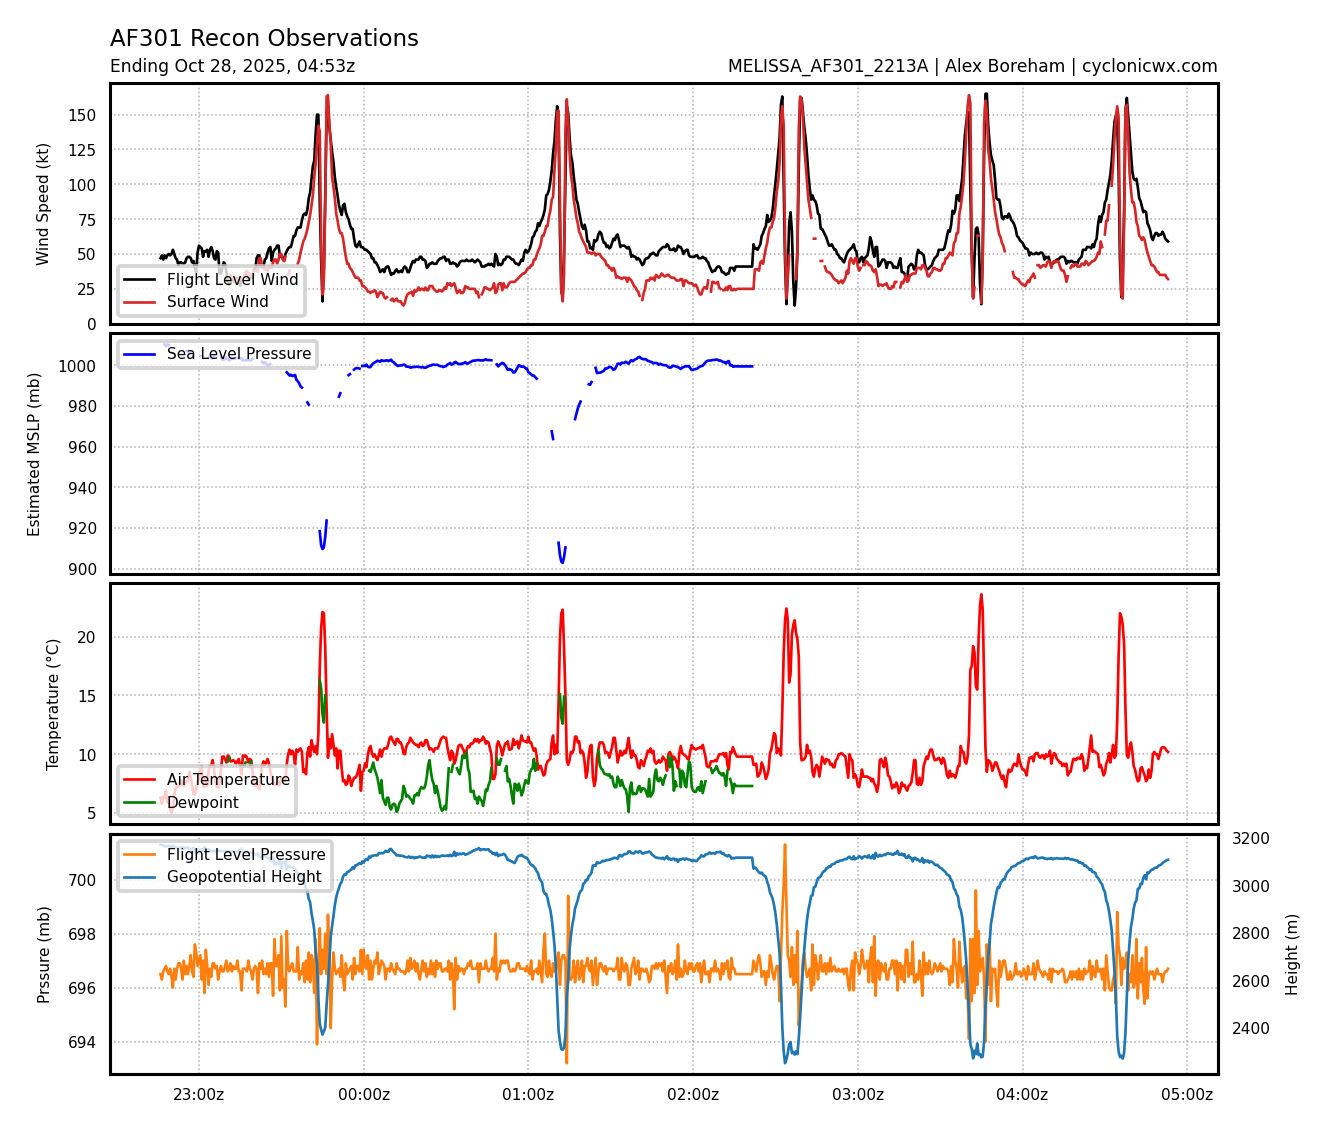
Reviewing the recon now (image above) the increase in dewpoint suggests the inflection point for the marginal ERC, and appears to have been between the first and second recon pass
... in the first wind speed pass you can see a subtle peak on either side of the (marginal) secondary eyewall, and in the second pass you can observe the dewpoint has increased dramatically in the eye (this was also observed in 1-min WV meso near the time but I didd not think much of it then).
At the time of the middle recon center drop around 00:30Z though the center drop had dropped further than the previous one, and an hour with the last pass during this mission the pressure had increased...
So based on all this and the M-PERC / WV chart the inflection point for this marginal ERC should have been between 28/00:00Z and 28/00:30Z ( and more likely just before 00:30Z.
~
Following this last recon ... I speculate what happened in the subsequent hours (spent less time on this and dont have recon for it so its more speculative)...
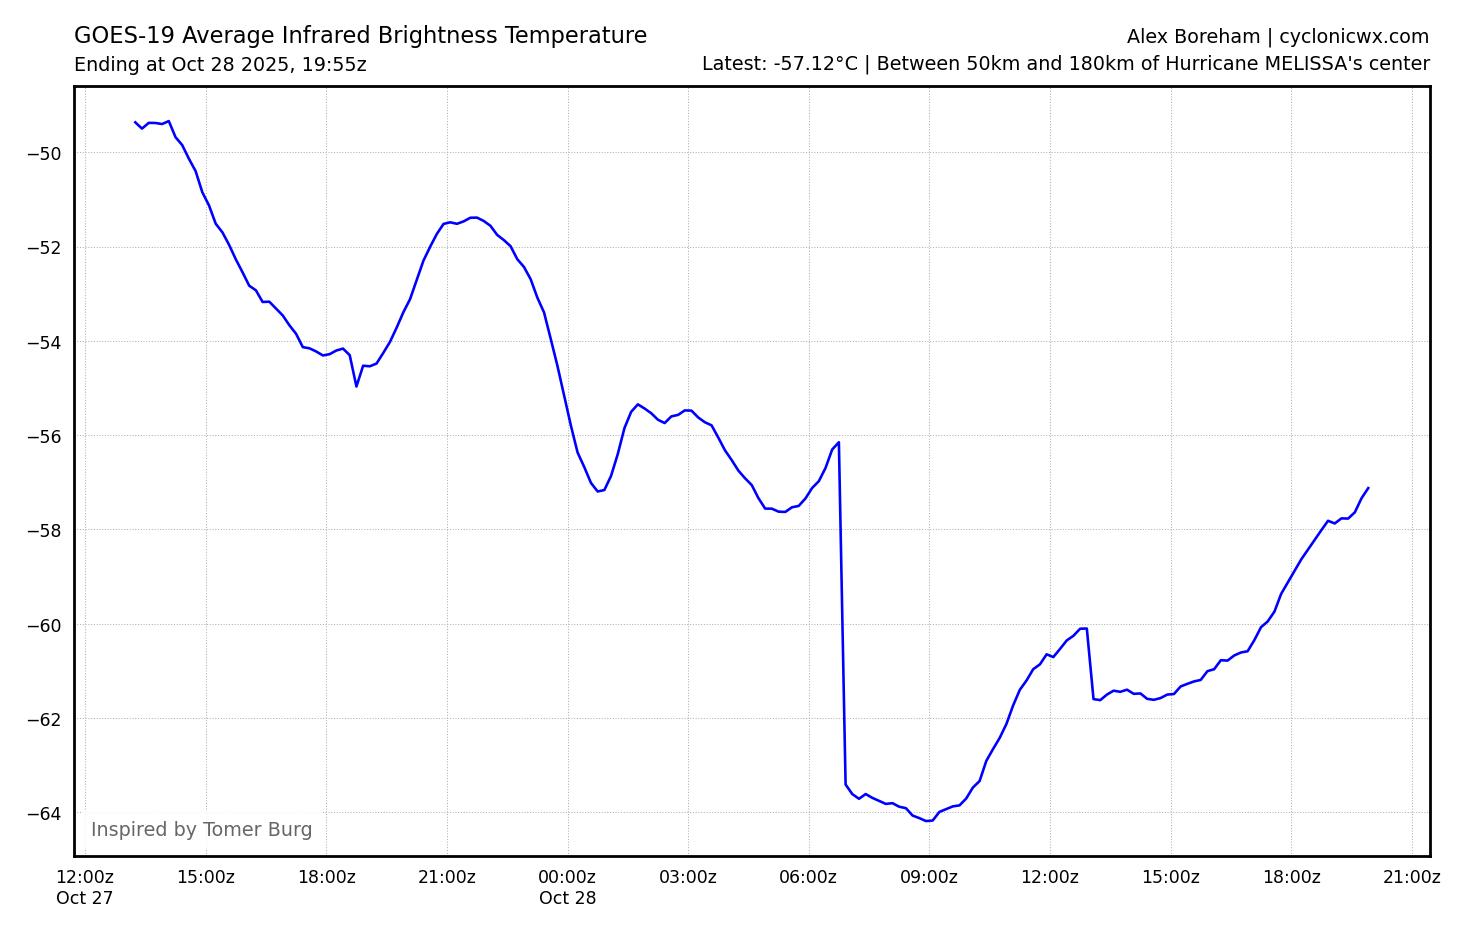
Based on the above chart though it looks like it was possibly weakening to some (unknown) degree for ~ 3 hours subsequent to the 28/00:00-00:30Z inflection point with some minor oscillations (to about 03:00 - 03:30Z).
Convective bursts started in the primary band in IR around 03Z..
and the boundary for the cloud tops of the deepest convection (-80C) expanded around this time of apparent strengthening
before contracting around 06Z...
After which I believe it started to strengthen again deepening further until 05Z. I don't know for sure the chart (avg IR temp) above accounts properly for first light (the sharp drop before 07Z) so I dont know if the warming prior to that around 06Z is from the day/night crossover, so I can't tell for sure if there was another marginal ERC, but its possible there was no weakening and only strengthening during this time.
More speculatively...
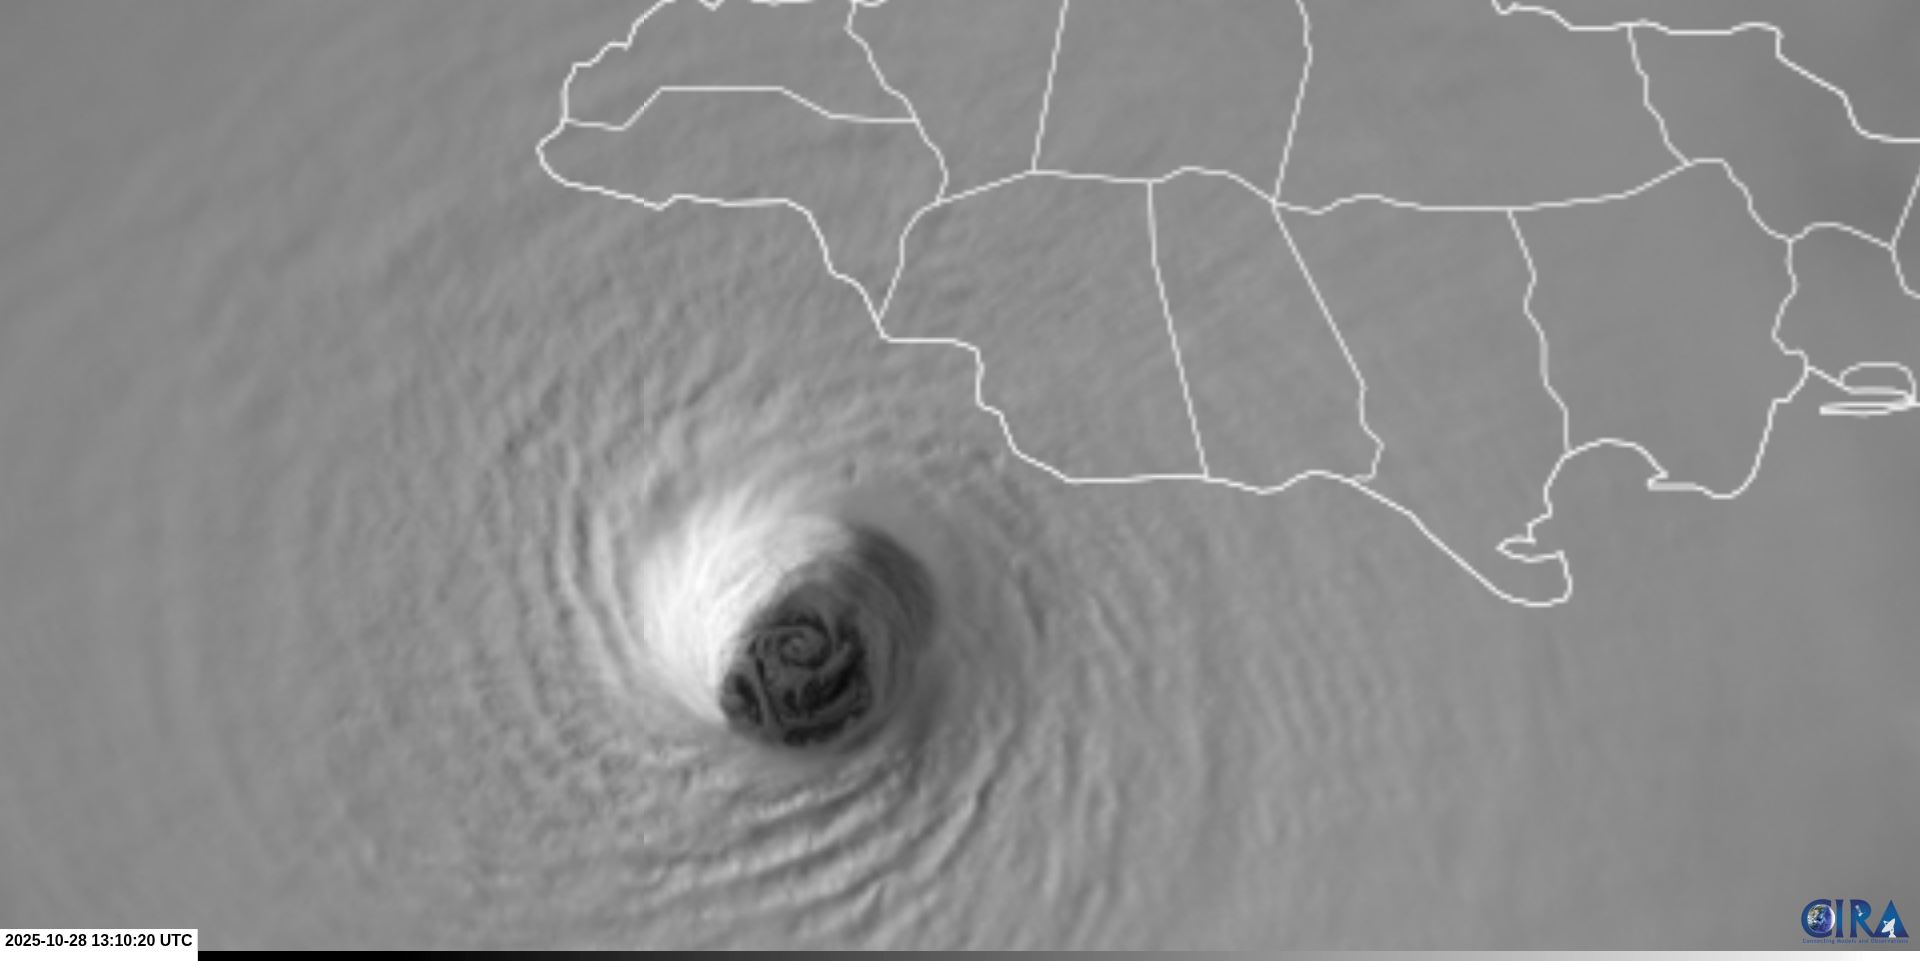
I guess by 09Z or there abouts there was weakening starting as the eye became distorted and started to wobble either from land interactions or shear....
Following that morit appeared to stabilize from 10-13Z IR (the center drop was around 13Z) -- I do not know if it was strengthening at the time or not but IR temperature decreased and the eyewall became circular again, so if it was weakening subsequent to 09Z with the recon pass that means it was much deeper by 09Z than anticipated , or alternatively possibly there was deepening overall from 03Z to 13Z with a brief possible oscillation levelling off or weakening around 06Z before strengthening.
Edited above post with some brief review / amateur analysis from my recollections and reviewing recon/hafs analysis from last day for anyone interested..

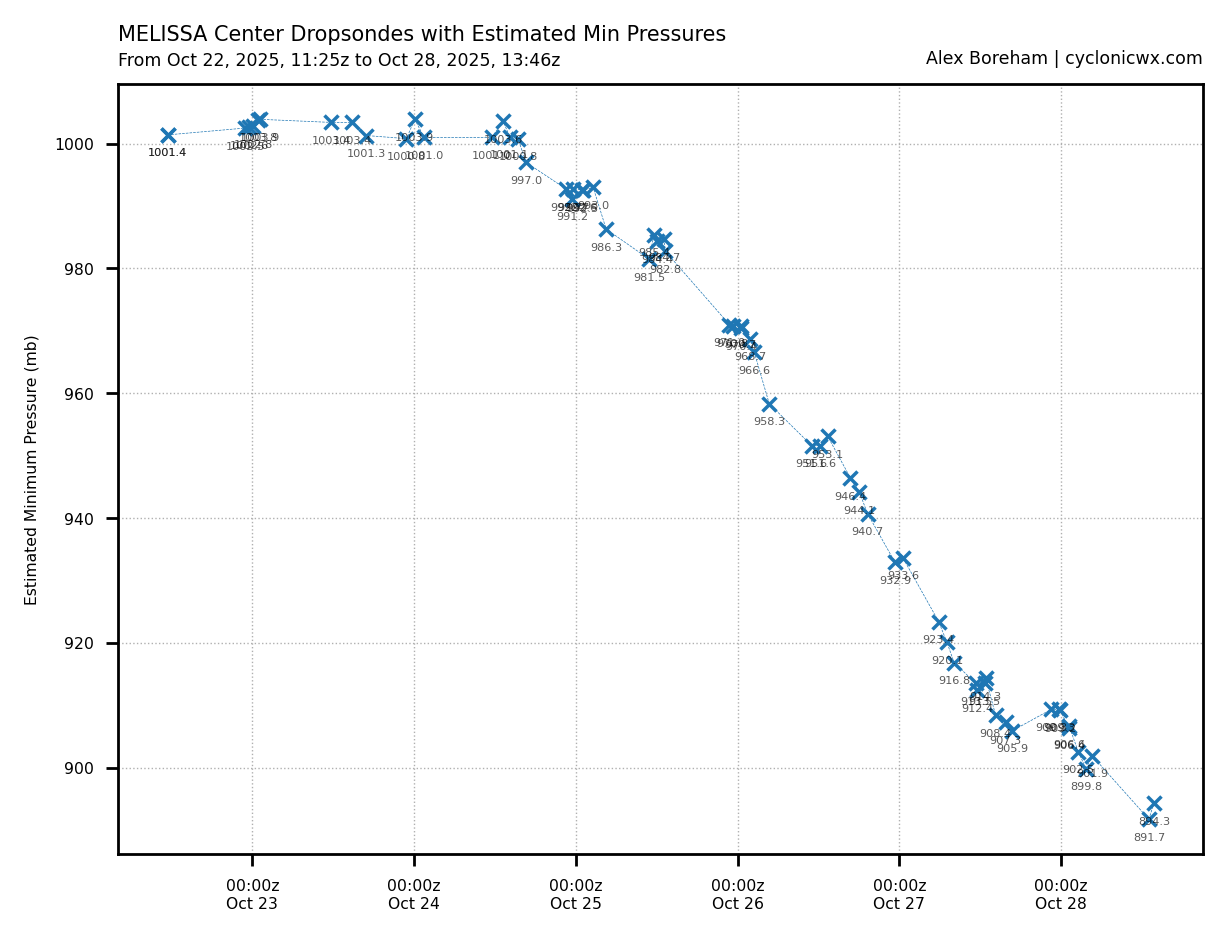
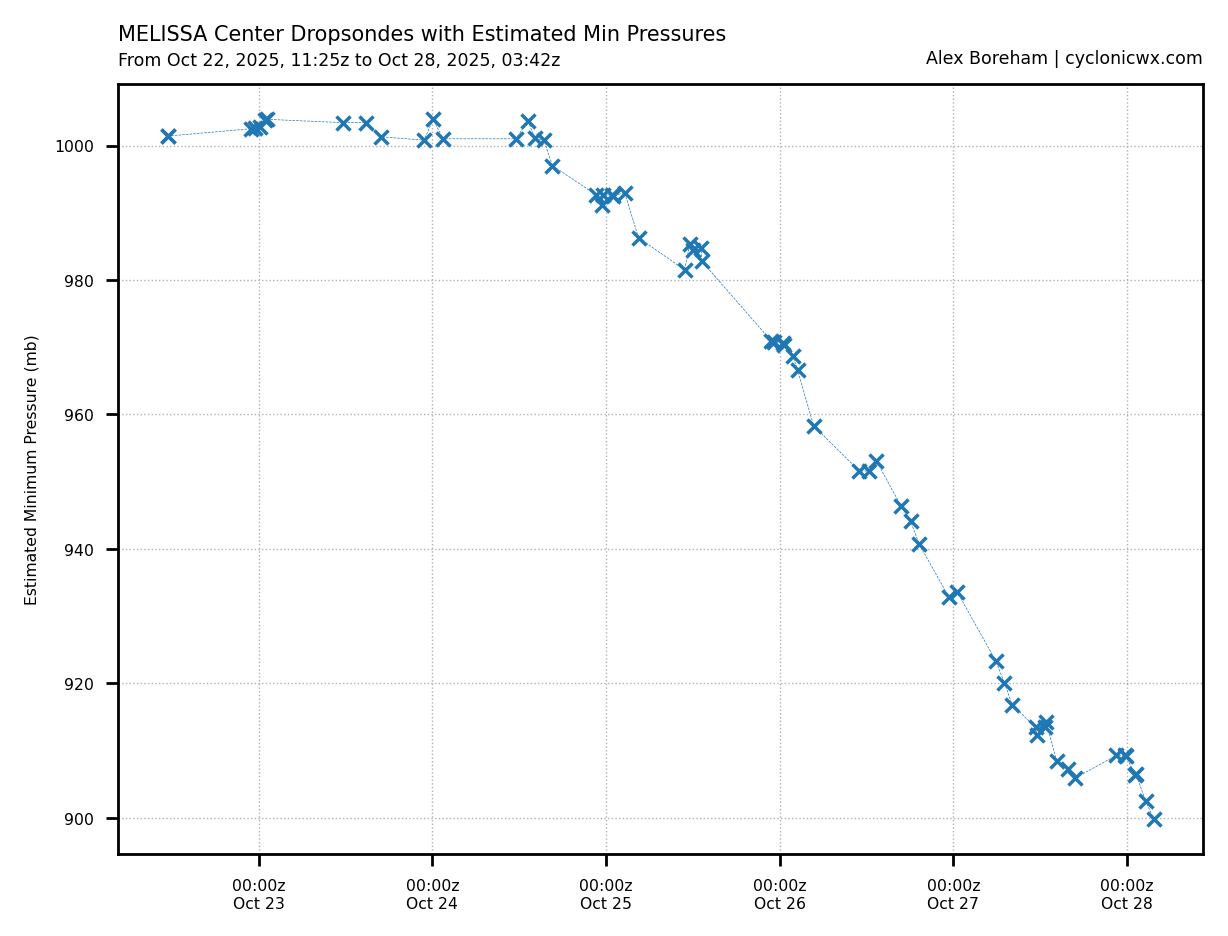
Latest center drop from 40 mins ago, adjusted rounds to 900 mb.
Next recon won’t be for hours but I expect there to be one last center drop for the current recon mission soon
This will likely be the last possible center drop given the exit time to provide support for the 06Z intermediate advisory to drop it below 900… based on the trend I expect it to drop about another 2 mb to 898 mb based on the increase in super cooled water in the primary band in imagery through 04Z and chart below, and the recent trend of about 3 mb every 1.5 hours (the last center pass looking like a shorter turn around).
Looks like I was wrong… core has cooled a bit, FLW winds dropped a bit and latest center drop is 902 mb after adjustment
I don’t have high confidence what ever temporary future strengthening will be caught in recon. Next entry time is 10Z and the last reliable hafsb I liked was the 27/18Z run which looked fairly good but shows strengthening and then weakening between now and next recon, which looks like future recon will miss it…
Looks like there was a marginal ERC earlier that caused some weakness in the storm showing up at the beginning of recon, but as of now it seems the strengthening seems will continue based on WV imagery.
based on hafs b 18 Z expecting some additional strengthening until another more serious ERC which was forecast to onset at 00Z and possibly contribute it to its weakening sometime a few hours before landfall? The shear was forecast to increase in ships but I’m not seeing it yet in cimss analysis.
New advisory and a new drop center should come any minute
Edit 23Z advisory has it at 903 mb
Edit: In short I expect we will likely resolve the market soon. I am expecting we are near the LMI of the storm given a fairly strong ERC seems imminent.
~
I wrote the below observations in the next section before doing a final review of the most recent imagery on CIMSS viewer, and note some asymmetry in the eyewall for SWIR imagery from CIMSS' viewer that is more apparent than what I considered before ( I did observe something like this in the WV imagery at the time but discounted it as part of the strengthening phase )
Following this I reviewed the CIMSS M-PERC page again as I had been waiting for it to evaluate that GCOM-W1 imagery for a while now, and the model now indicates a bit under 80% of a ERC , after more writing, refreshing a few mins later on it increased to 90+%.
Given this and reconsidering what I saw earlier, I think an ERC is soon to happen and that we are at or soon to be near the inflection point already (and expecting the next 6 hours of recon at most will catch the LMI by my guesswork)

Edit: I hallucinated the Extrapolated pressure (read 995 as 895).
~
Next recon flight has already departed and scheduled to enter station in an hour and half from now (22Z). By the time the next advisory comes out there wouldn't have been recon in ~4 hours.
From examining GOES and WV imagery as well as the most recent GCOM-W1 pass I see no indication of ERC but the CIMSS product hasn't updated yeet on this latest pass.
The last recon was around 16:45 Z. I considered meso imagery (WV, IR from CIRA slider) from 16:45 to ~20:00Z (I did look at earlier Lightning products also but not had time to do so recently). I also paid attention to recent microwave imagery and GOES products closely for strong signs of ERC ( I observe none but note that the prob from CIMSS M-PERC has been at 60% for both predictions for multiple hours -- this is less than the 0.7 needed for a more confident prediction on this product alone).
Examining the eye itself it appears to have gotten more symmetric during this time. The primary band of convection has shrunk (less super cooled water though during this time from cyclonicwx WV imagery, but more homogenous and symmetric temps in the WV channel in the primary band after compared to before during this contraction) and the eyewall appears to have strengthened along with it following a convective burst in the eye wall earlier (I can't recall for sure but near 18Z if I remember right) . The eye itself remaining about 7 NM based on vis. imagery during this time but becoming symmetric, but appearing smaller even in WV even if the VIS imagery I got the same measurements (measuring high vis meso imagery samples perpendicular to shear estimates I referenced at the time).
Considering the high intensity and small eye size I would expect an ERC to inevitably start within hours based on my limited understanding of how common it is for the most intense storms. Reviewing the ADT overlaid on Google/12Z and that it appears to have taken a NW turn as of late, and the long forecast shear that was suppose to become slightly more unfavorable around the time of this turn, I would expect more likely than not that we should be nearing the LMI for the storm (based on these old forecasts). I do recall there was some chance of further strengthening as it headed north and NE towards Jamaica in some of the HAFS models so that is possible if the shear is not as bad as forecast and an ERC does not happen (these seem to be a lot of conditonals). Based on this alone subjectively I would not expect much more additional strengthening once the current phase of strengthening levels off (don't know when this will happen -- I would think with sunset we should get a little extra boost in intensity if not for the shear forecast which would seem to make it less than ideal). I do note the mean Google track generally indicates weakening from 12Z onwards, and the HAFS A/B (12Z runs) showed a very brief period of strengthening around 18Z and then weakning afterwards if I recall. Given the contrary observation for the short term I have I am inclined to largely discount the current Google/12Z ensemble, as well as the HAFS A/B to a lesser degree, and instead for model guidance rely more on the trend and environment from memory of the general story told by these many runs for the last few days.
I do note various charts from cyclonicwx indicate a pause in the strengthening around 18Z during the start of the contraction and possibly weakening (before that there was additional strengthening apparent following the last recon). The only explanation I have for this is the story of a combination that it just corresponds to this strengthening phase during 18Z+ and speculatively the eye is being ventilated a bit by the shear (which SHIPS had at 14kt if I recall most recently, increasing from 10kt prior to the pause -- this closing in on less than ideal conditions for strengthening).
For most various satellite derived products I examined during the periood seems indicate weakening, but this could be off for various reasons during this contraction.
In summary, my subjective observations is that there is an ongoing strengthening period (indicated by the cyclonicwx charts to 18Z, and continuing afterwards from my own observations of sat. imagery). This is in contrary to the other satellite-derived intensity estimates indicating otherwise for it.
Next I review the subjective DVTS fixes, which were both at 7.5/7.5 for 18Z (906mb). Remember I did indicate additional ongoing strengthening AFTER 18Z so this might be fine in terms of it not yet translating.
I review the 18Z ships again..its forecasting it becoming neutral (16kt is less than ideal for strengthening) to slightly disfavorable (18kt) at 28/00Z and 06Z respectively (this is in line with many past Google forecasts), with shear as the single largest negative contributor.
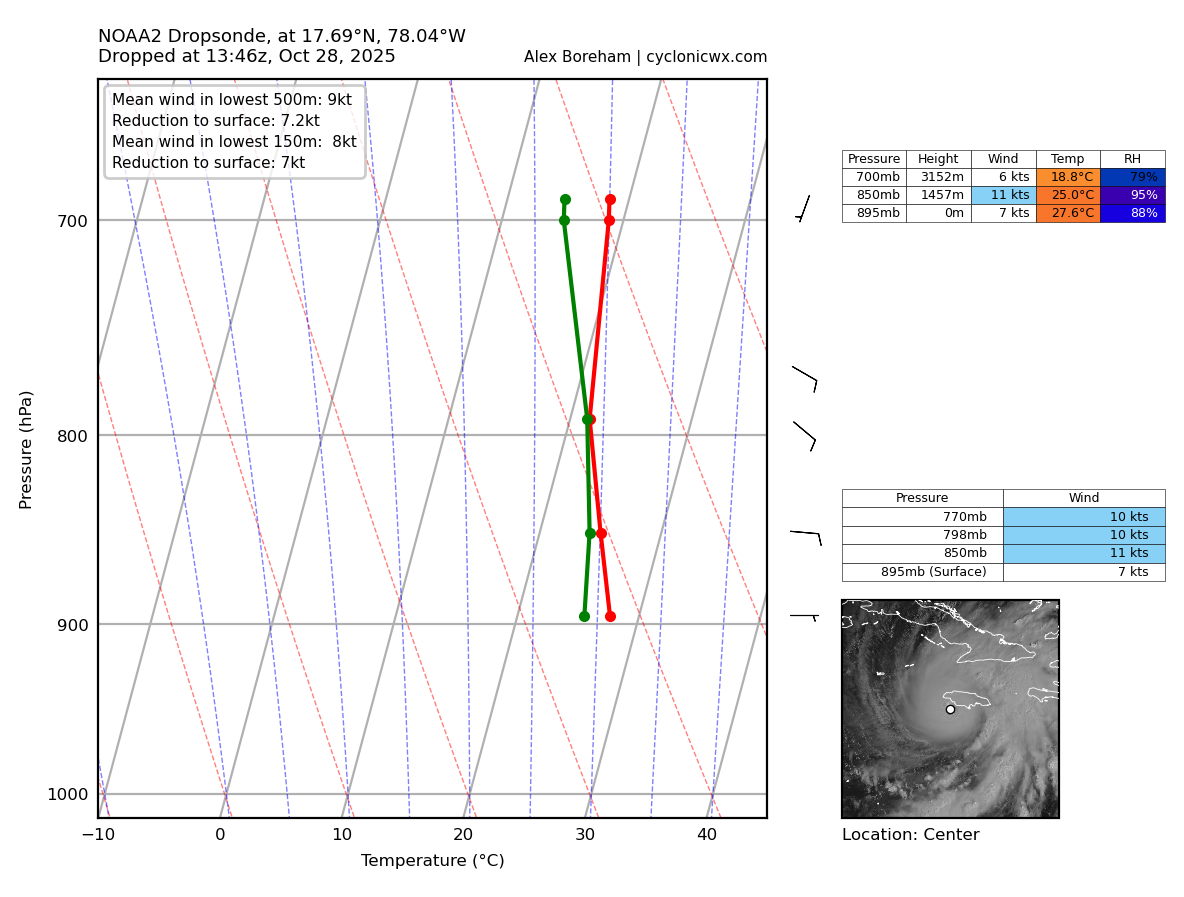
Reached 908.4mb with the latest dropsonde and 15Z advisory
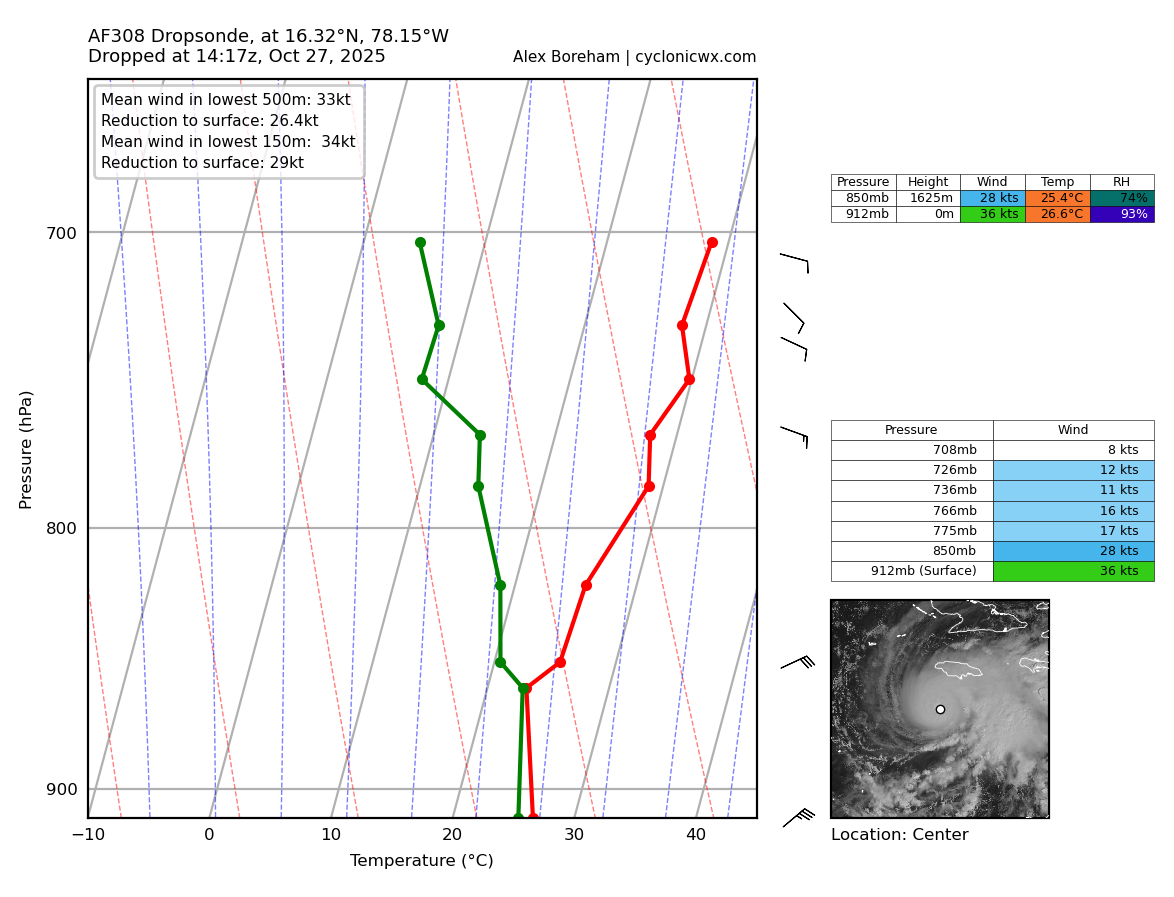
WTNT43 KNHC 271448
TCDAT3
Hurricane Melissa Discussion Number 25
NWS National Hurricane Center Miami FL AL132025
1100 AM EDT Mon Oct 27 2025
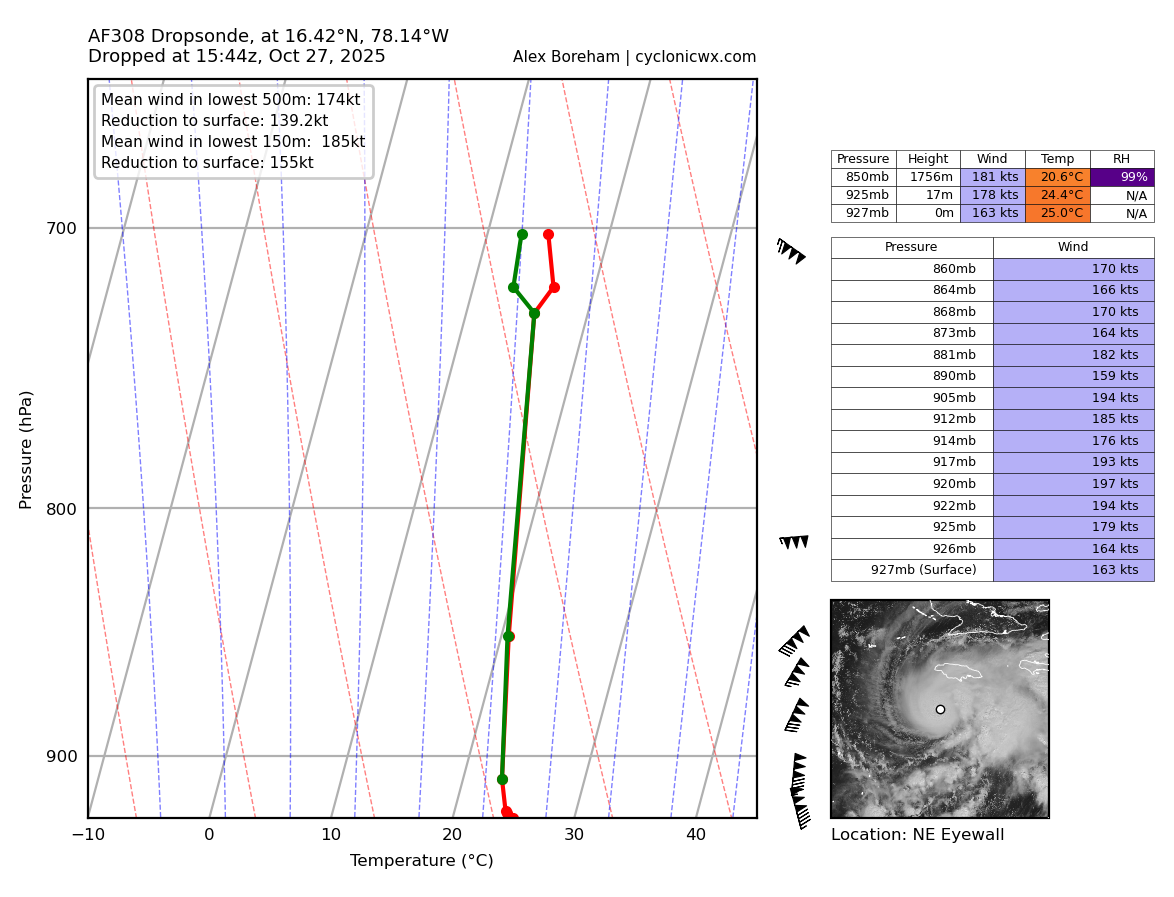
Melissa has the classic strong hurricane appearance in satellite
imagery this morning, with a well-defined 10-nm wide eye embedded
in a central dense overcast with cloud tops colder than -80C. The
hurricane also has a large complex of outer banding over the
eastern semicircle and a circulation that covers most of the
Caribbean west of 70 degrees west longitude. Reports from NOAA and
Air Force Reserve Hurricane Hunter aircraft indicate the central
pressure has fallen to near 908 mb, with both aircraft releasing
dropsondes in the northeastern eyewall that support an initial
intensity of 145 kt. The NOAA aircraft left the storm early after
experiencing severe turbulence in the southwestern eyewall.
The eye is wobbling around due to the slow motion, but the best
estimate of the initial motion is 270/3 kt. The mid-level ridge
north of Melissa is weakening as a deep-layer mid-latitude trough
moves eastward through the southeastern United States. This should
cause the hurricane to turn northward during the next 12 h or so at
a continued slow forward speed. After 24 h, Melissa should turn
northeastward with some increase in forward speed as the
mid-latitude westerly flow becomes the dominant steering
mechanism. This general motion should continue for the rest of the
forecast period. On the forecast track, the center of Melissa will
be near or over Jamaica late tonight or early Tuesday, cross
eastern Cuba Tuesday night or early Wednesday, and then move near
or over the Bahamas and the Turks and Caicos on Wednesday. After
that, the cyclone could reach the vicinity of Bermuda on Thursday
night. The new forecast track has some minor adjustments from the
previous track and is a blend of the HFIP Corrected Consensus, the
Google DeepMind ensemble mean, and the other consensus models.
Some fluctuations in intensity are likely during the next 12-24 h
due to the possibility that Melissa will start an eyewall
replacement cycle. However, this is unlikely to weaken Melissa
significantly, and there is no practical difference in Melissa
making landfall in Jamaica at category 4 or 5 intensity, since both
categories produce catastrophic wind damage. After reaching Jamaica,
a combination of land interaction and increasing southwesterly shear
should cause some weakening, although Melissa is still forecast to
be a major hurricane when it reaches Cuba. Once over the Atlantic,
stronger shear should cause more substantial weakening, and Melissa
is expected to become extratropical by the end of the forecast
period. The new intensity forecast has minor adjustments from the
previous and follows the trend of the intensity consensus.
Key Messages:
1. Jamaica: Do not venture out of your safe shelter. Catastrophic
and life-threatening flash flooding and numerous landslides are
likely today through Tuesday. Catastrophic winds in the eyewall have
the potential to cause total structural failure especially in higher
elevation areas tonight and early Tuesday. This will result in
extensive infrastructural damage, long-lasting power and
communication outages, and isolated communities. Life-threatening
storm surge and damaging waves are expected along the southern coast
through Tuesday.
2. Haiti and the Dominican Republic: Catastrophic and
life-threatening flash flooding and landslides are expected across
southwestern Haiti and southern portions of the Dominican Republic
through midweek. In Haiti, extensive infrastructural damage and
isolation of communities is likely. Tropical storm conditions are
expected late Tuesday and Wednesday.
3. Eastern Cuba: Heavy rainfall with life-threatening and
potentially catastrophic flash flooding and landslides is expected
beginning today. Life-threatening storm surge and damaging winds are
expected late Tuesday and Tuesday night. Preparations should be
rushed to completion.
4. Southeast Bahamas and the Turks and Caicos: Hurricane conditions,
life-threatening storm surge, and heavy rainfall are possible on
Wednesday. Residents should follow advice given by local officials
and be sure to have preparations complete by Tuesday night.
FORECAST POSITIONS AND MAX WINDS
INIT 27/1500Z 16.4N 78.2W 145 KT 165 MPH
12H 28/0000Z 16.9N 78.3W 145 KT 165 MPH
24H 28/1200Z 17.8N 77.9W 140 KT 160 MPH
36H 29/0000Z 19.1N 76.9W 110 KT 125 MPH
48H 29/1200Z 20.8N 75.5W 95 KT 110 MPH
60H 30/0000Z 23.0N 73.7W 85 KT 100 MPH
72H 30/1200Z 25.9N 71.2W 85 KT 100 MPH
96H 31/1200Z 34.3N 63.0W 75 KT 85 MPH
120H 01/1200Z 42.8N 50.0W 60 KT 70 MPH...POST-TROP/EXTRATROP
$$
Forecaster BevenUpdate!...
BULLETIN
Hurricane Melissa Intermediate Advisory Number 23A
NWS National Hurricane Center Miami FL       AL132025
200 AM EDT Mon Oct 27 2025

...HURRICANE CONDITIONS AND DESTRUCTIVE STORM SURGE EXPECTED ON
JAMAICA BY TONIGHT...
...LIFE-THREATENING AND CATASTROPHIC FLASH FLOODING AND LANDSLIDES
IN PORTIONS OF JAMAICA AND SOUTHERN HISPANIOLA ALSO EXPECTED...


SUMMARY OF 200 AM EDT...0600 UTC...INFORMATION
----------------------------------------------
LOCATION...16.3N 77.7W
ABOUT 130 MI...210 KM SSW OF KINGSTON JAMAICA
ABOUT 315 MI...505 KM SSW OF GUANTANAMO CUBA
MAXIMUM SUSTAINED WINDS...150 MPH...240 KM/H
PRESENT MOVEMENT...W OR 270 DEGREES AT 5 MPH...7 KM/H
MINIMUM CENTRAL PRESSURE...926 MB...27.34 INCHES
~
Looks like some significant strengthening from Extrap pressure in last 5 hours (a differrence exceeding what the google mean indicated even)...
Minimum Extrap. Pressure: 931.7mb at 00:32z
Minimum Extrap. Pressure: 923.2mb at 05:50z
Center drop was 923.4 after adjustment
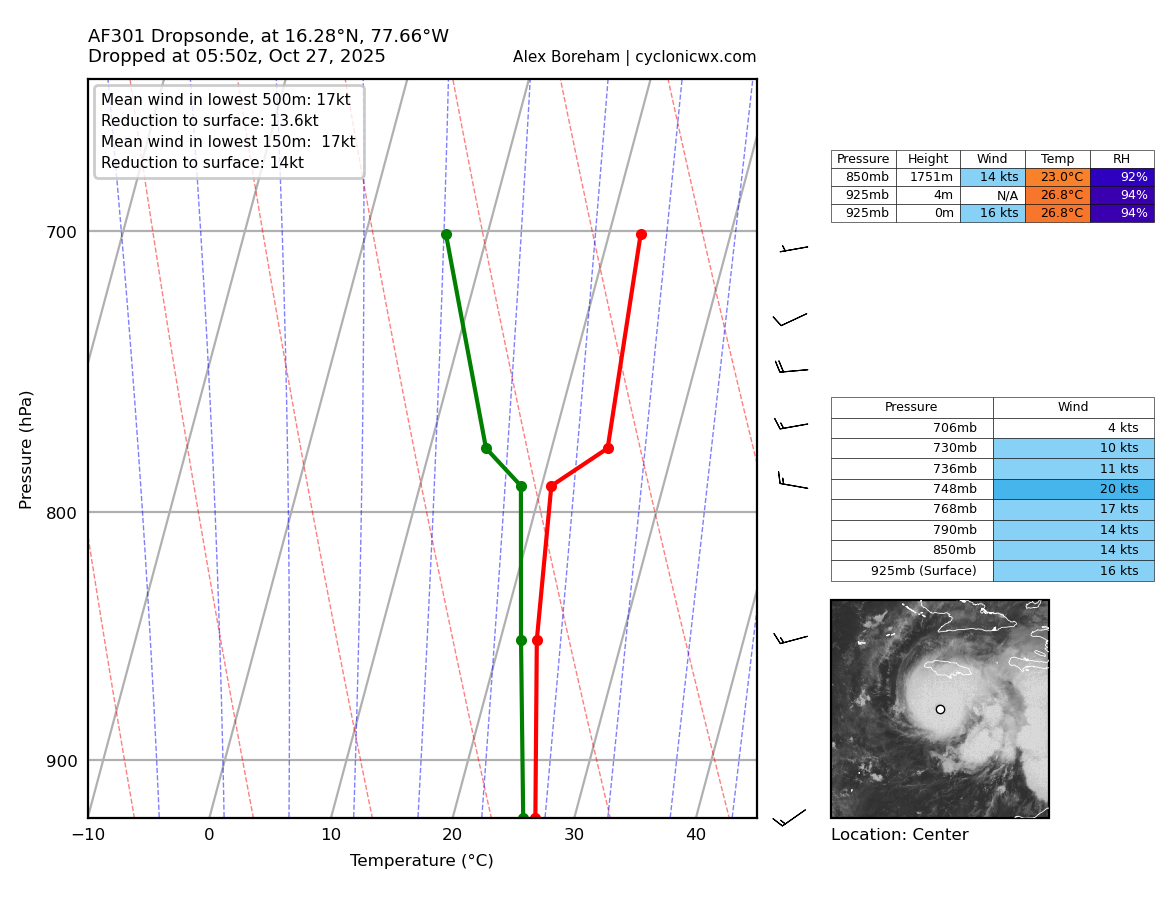
New recon looks to soon enter the storm..
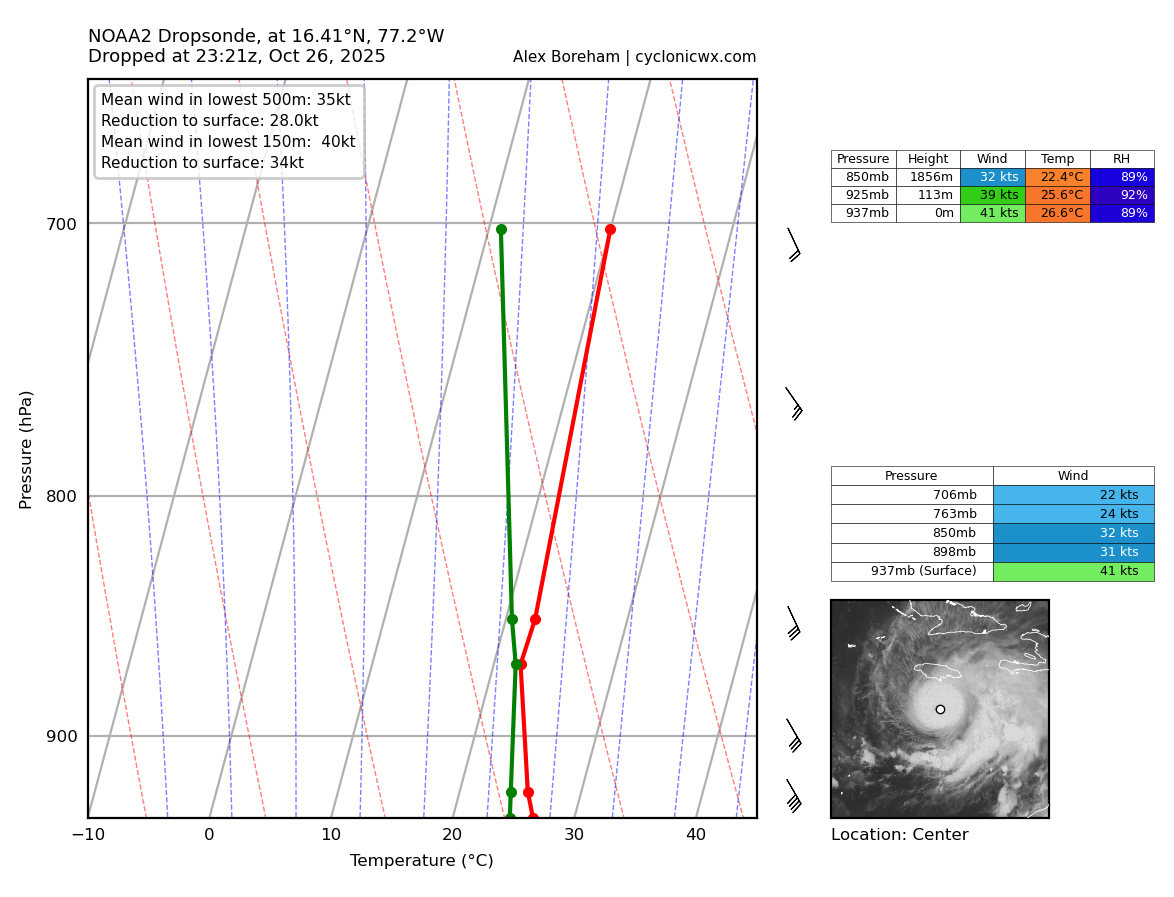
below references earlier NOAA recon (NOAA2 Mission #17 into MELISSA from before the 03Z advisory)
~
The 03Z NHC advisory keeps it at 125 kt, while lowering the pressure in accordance to recon; discussion mentions peak FLW supporting keeping it at 125 kt but I don't see it from the most recent recon.
The highest seems the first pass with a 129 kt peak 700mb wind ...
232230 1623N 07706W 6956 02752 9543 +130 +146 177126 129 /// /// 05
232300 1623N 07704W 6957 02828 9633 +125 +138 174114 123 /// /// 05
Highest drop was (in/near? the east eyewall - unlabeled) supporting 114 kt though.
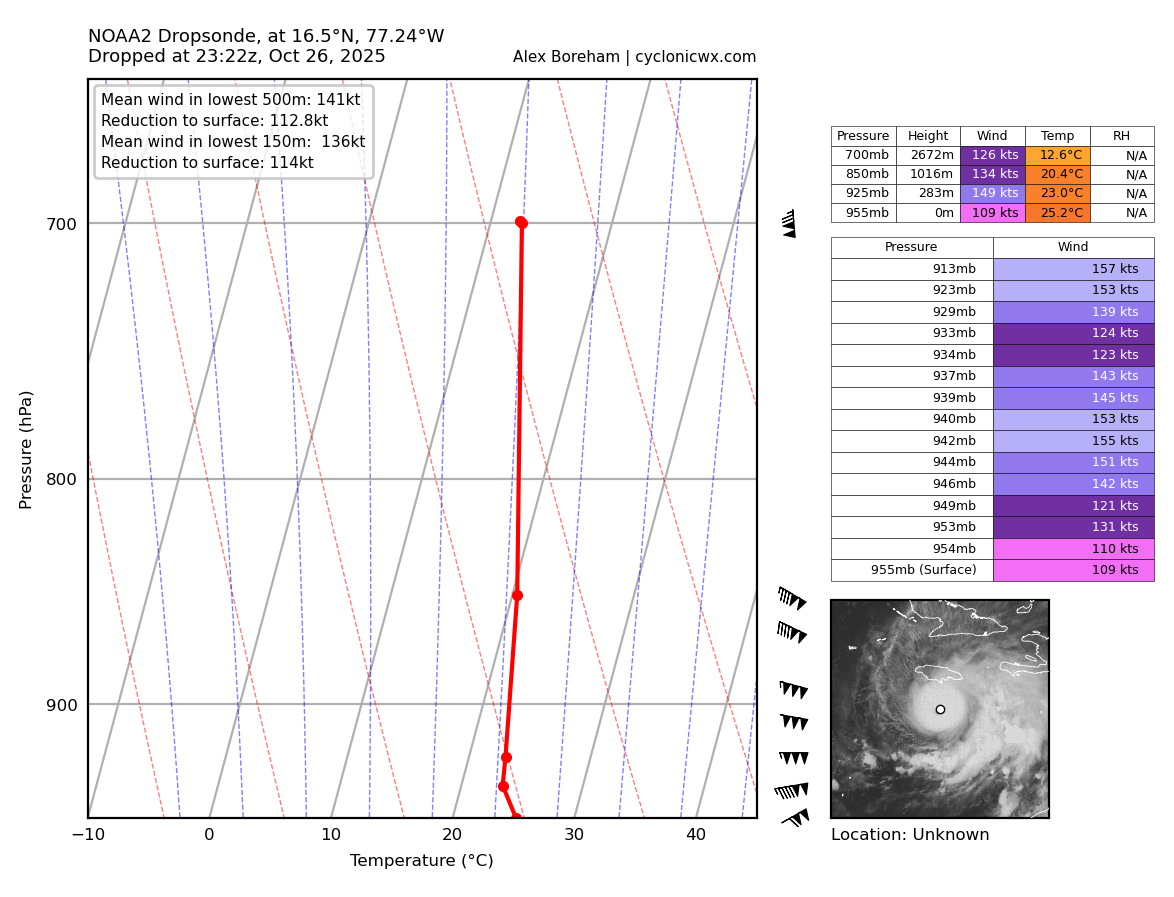
~
Watching meso imagery occasionally I observed a convective burst through the eyewall about a 1/3 the way through recon (between first and second eyewall crossings)... this indicated some additional strengthening should be happening with the western eyewall and core of the hurricane as the WV imagery during this time has cooling tops over the western portion. Also visible in this nice combined obs. chart below from cyclonic wx with the high dewpoint during this event... (although its not the same exact position for each eyewall the FLW appear more symmetric in the last pass although it could be a coincidence). I believe we should also expect strengthening over the next several hours based on this ....
~
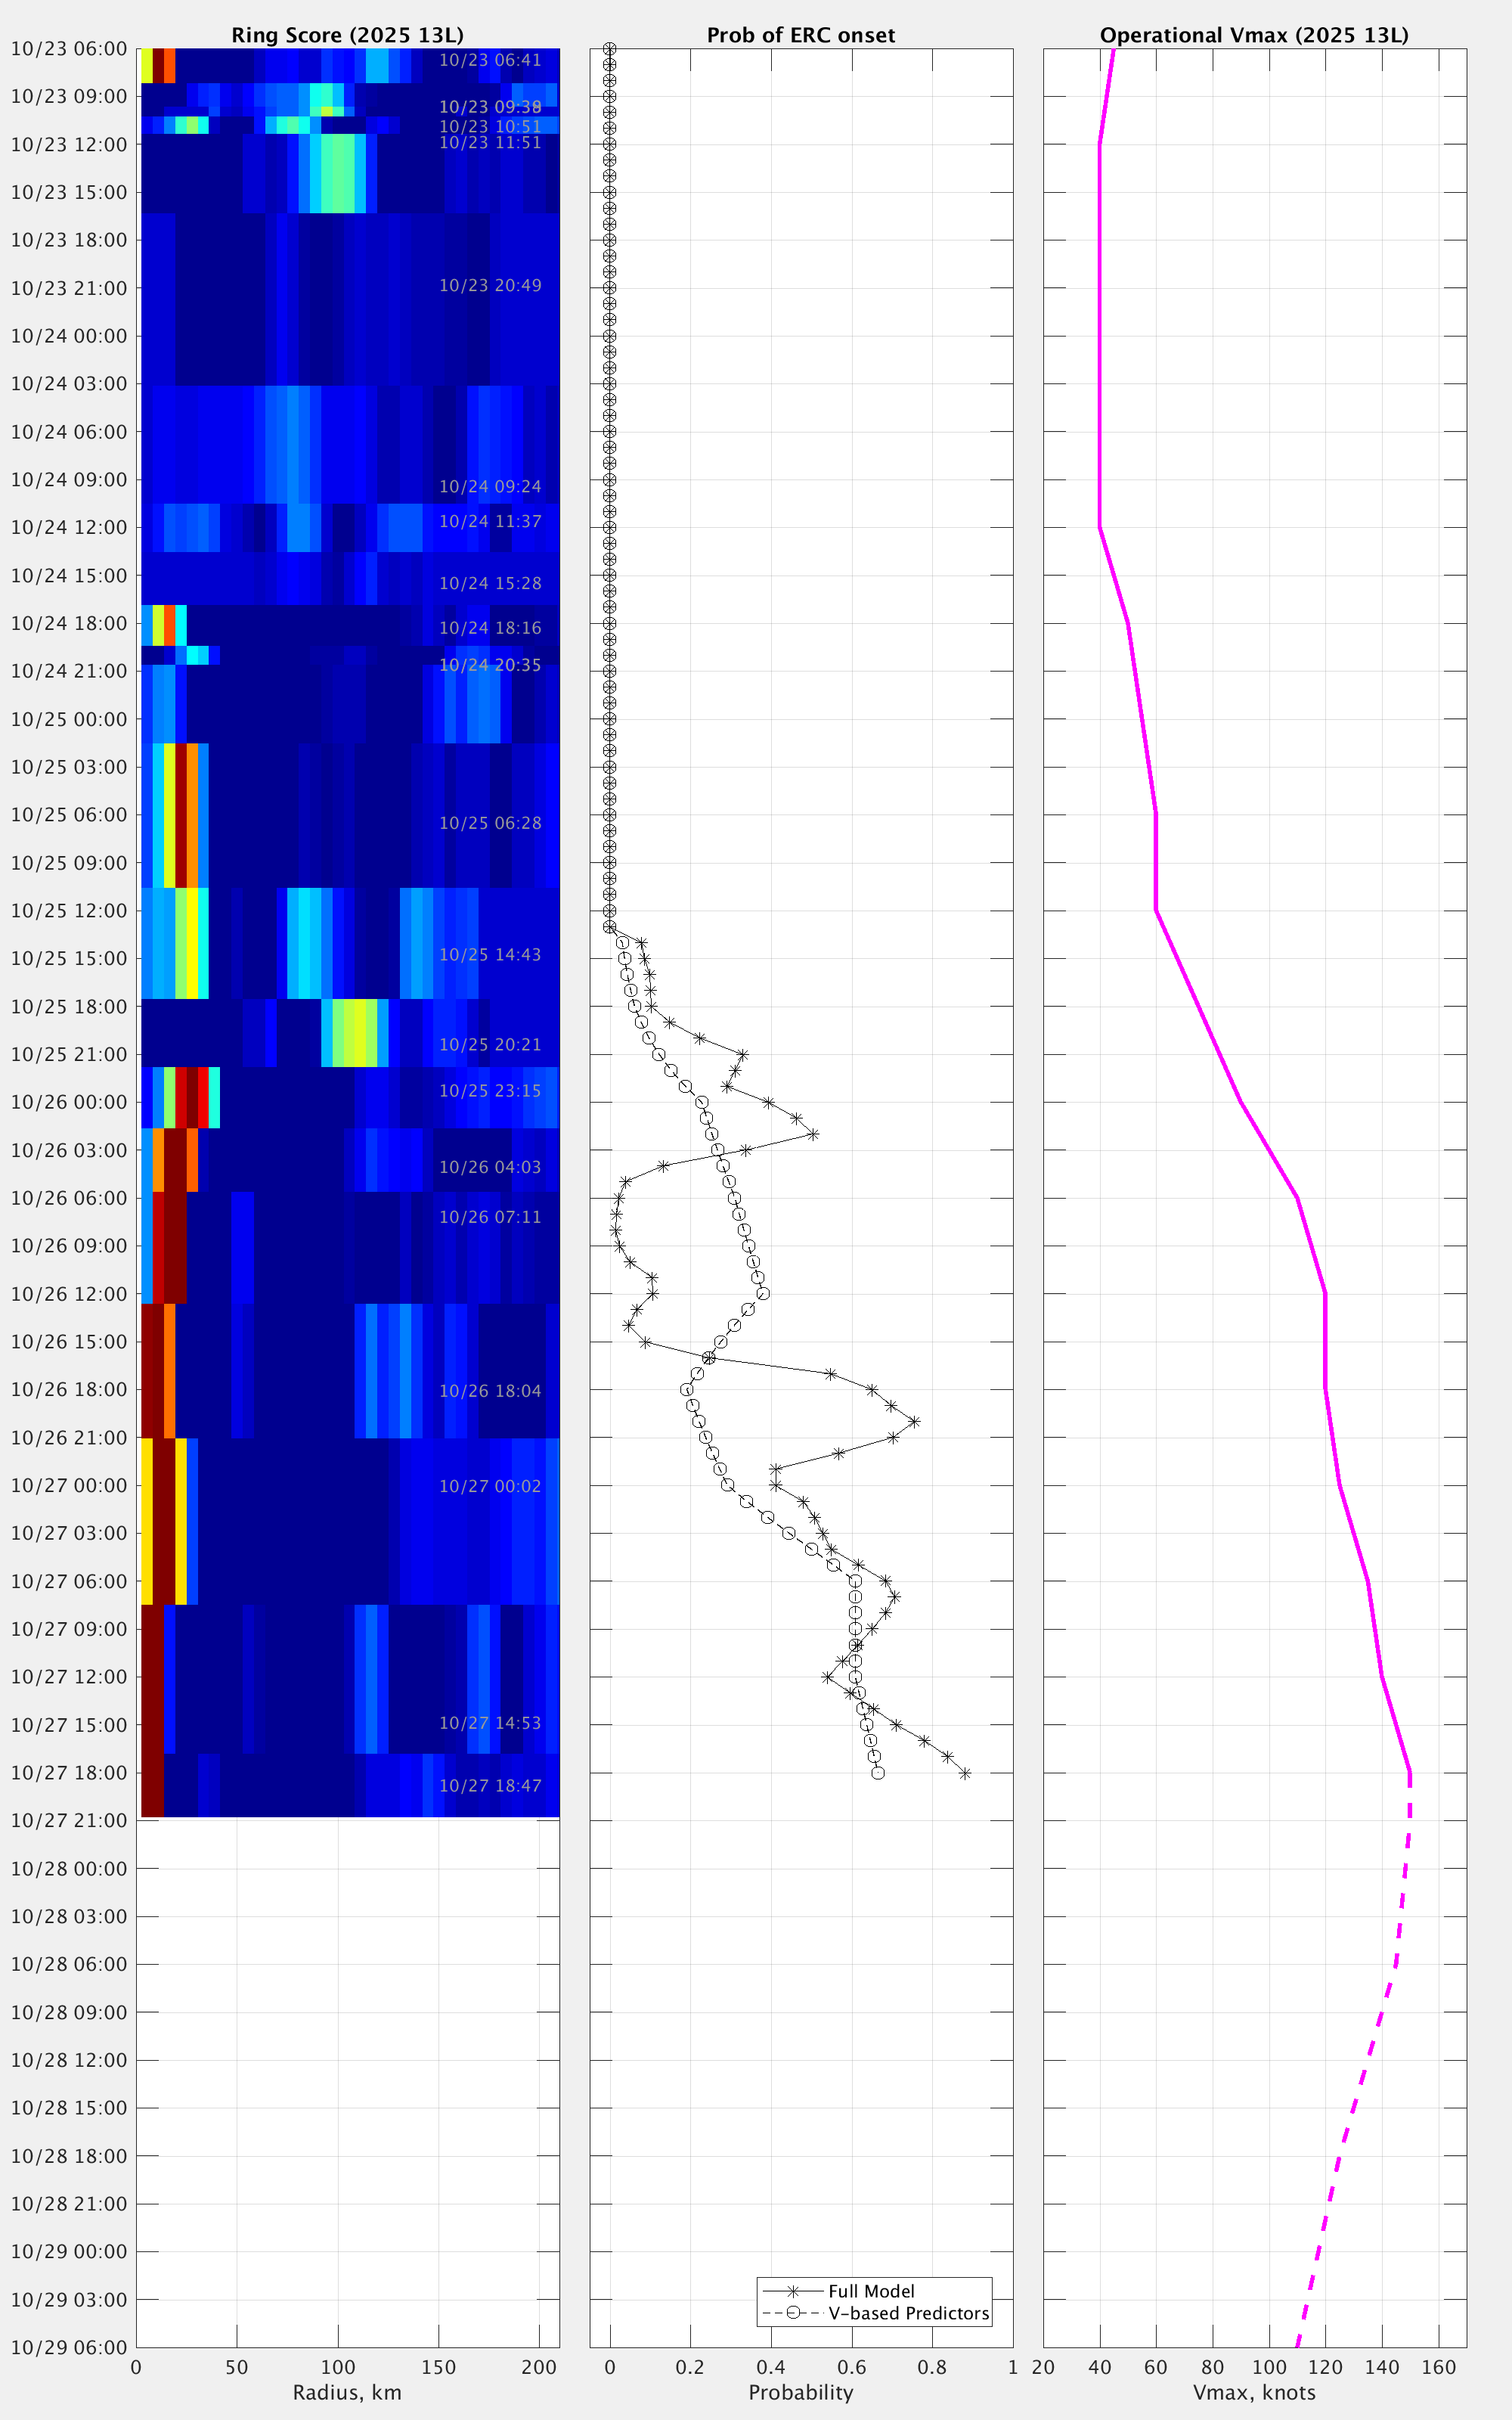
No sign of ERC soon as far as I can tell: there was a 60-65% prediction earlier from M-PERC around 18Z, but it didn't seem plausible looking at the ring product, and a subsequent microwave pass dropped it substantially.
No sign of it from earlier lightning data, but I'm used to referencing CIRA's slider for lightning meso and it is far behind (23:50Z). Referencing cyclonicwx which has 10min lightning, I didn't see any hints
~
chart from cycloncwx:
The first pass is W->E, then NE -> SW, then SE -> NW..


From the VDMs, the eyewall is circular, closed type and reportedly shrunk by about 3 NM during the recon (from 15 to 12 NM) between the first and second pass (an hour apart).
~
For Google/18Z:
In previous runs the LMI in terms of pressure was reached on 28/00Z, but now with the latest run, from examining the mean it looks like 28/06Z (in a few hours) is more likely, but there also seems to be more variation so I am indicating that it is more likely to happen before 28/00Z then previously; this also makes it more likely to deepen rapidly and a subsequent ERC more likely before a Jamaican landfall if it happens early enough (which I mention since I recall from a day ago some of the HAFS models showed further deepening was possible as it approached the Jamaican coast)
For landfall, the naive mean of interpolated track indicates a daytime landfall on 28th but with quite a bit of spread to the point of very early morning to late evening...
(First entry) mean vmax: 124.7, mean valid time: 2025-10-28 16:20 UTC
67% CI vmax: (111.0 kt - 134.7 kt)
95% CI vmax: (101.1 kt - 147.1 kt)
67% CI valid time: (2025-10-28 12:28 UTC - 2025-10-28 20:06 UTC)
95% CI valid time: (2025-10-28 07:45 UTC - 2025-10-28 22:42 UTC)
Given its current cat.4 intensity, from my understanding any ERC then from now on will likely mean that the storm will likely have much less chance for further deepening as the stronger the storm the longer it takes the ERC to complete (if I recall its usually something like a 24 hour event from start to finish for a high end hurricane), and given as of 27/04Z now there are ~ 36 hours to landfall it seems too tight timewise for a scenario where even a ERC that happens now would require significant RI near landfall again to deepen enough again.
So if a ERC becomes likely I would expect the LMI to be whatever it was at the inflection time. Anyway, this is what I interpret Google as possibly suggesting -- where the most likely is intensification soon, after which an ERC becomes more likely)..
~
Lastly checked various satellite estimates:
Noted CIMSS adjusted raw data T are up to 8.2 (hitting 24hr limit constraints now), though not truly reliable lately given recon they do hint I might be correct about the ongoing intensification that Google indicated...
2025OCT27 021021 7.3 911.3 149.0 7.3 7.8 7.8 NO LIMIT OFF OFF OFF OFF 17.82 -77.83 EYE 15 IR 73.8 16.25 77.42 ARCHER GOES19 19.2
2025OCT27 024021 7.4 908.3 152.0 7.4 8.0 8.0 NO LIMIT OFF OFF OFF OFF 19.14 -78.47 EYE 16 IR 73.8 16.25 77.45 ARCHER GOES19 19.2
2025OCT27 031021 7.5 905.1 155.0 7.5 8.1 8.2 3.7T/24hr OFF OFF OFF OFF 18.30 -79.68 EYE 15 IR 73.8 16.25 77.45 ARCHER GOES19 19.2
~
D-MINT also shows strengthening
2025OCT27 0305 16.30 -77.50 TROPICS03 924 142 136 149
~
AiDT up to 152 kt now ..
20251027 034021 161 152 125
~
D-PRINT doesnt show as high numbers as earlier today, but the current official intensity of 125kt is still below the 25th percentile..
2025OCT27 0310 16.25 -77.45 928 137 130 144
2025OCT27 0340 16.28 -77.51 929 137 129 144
~
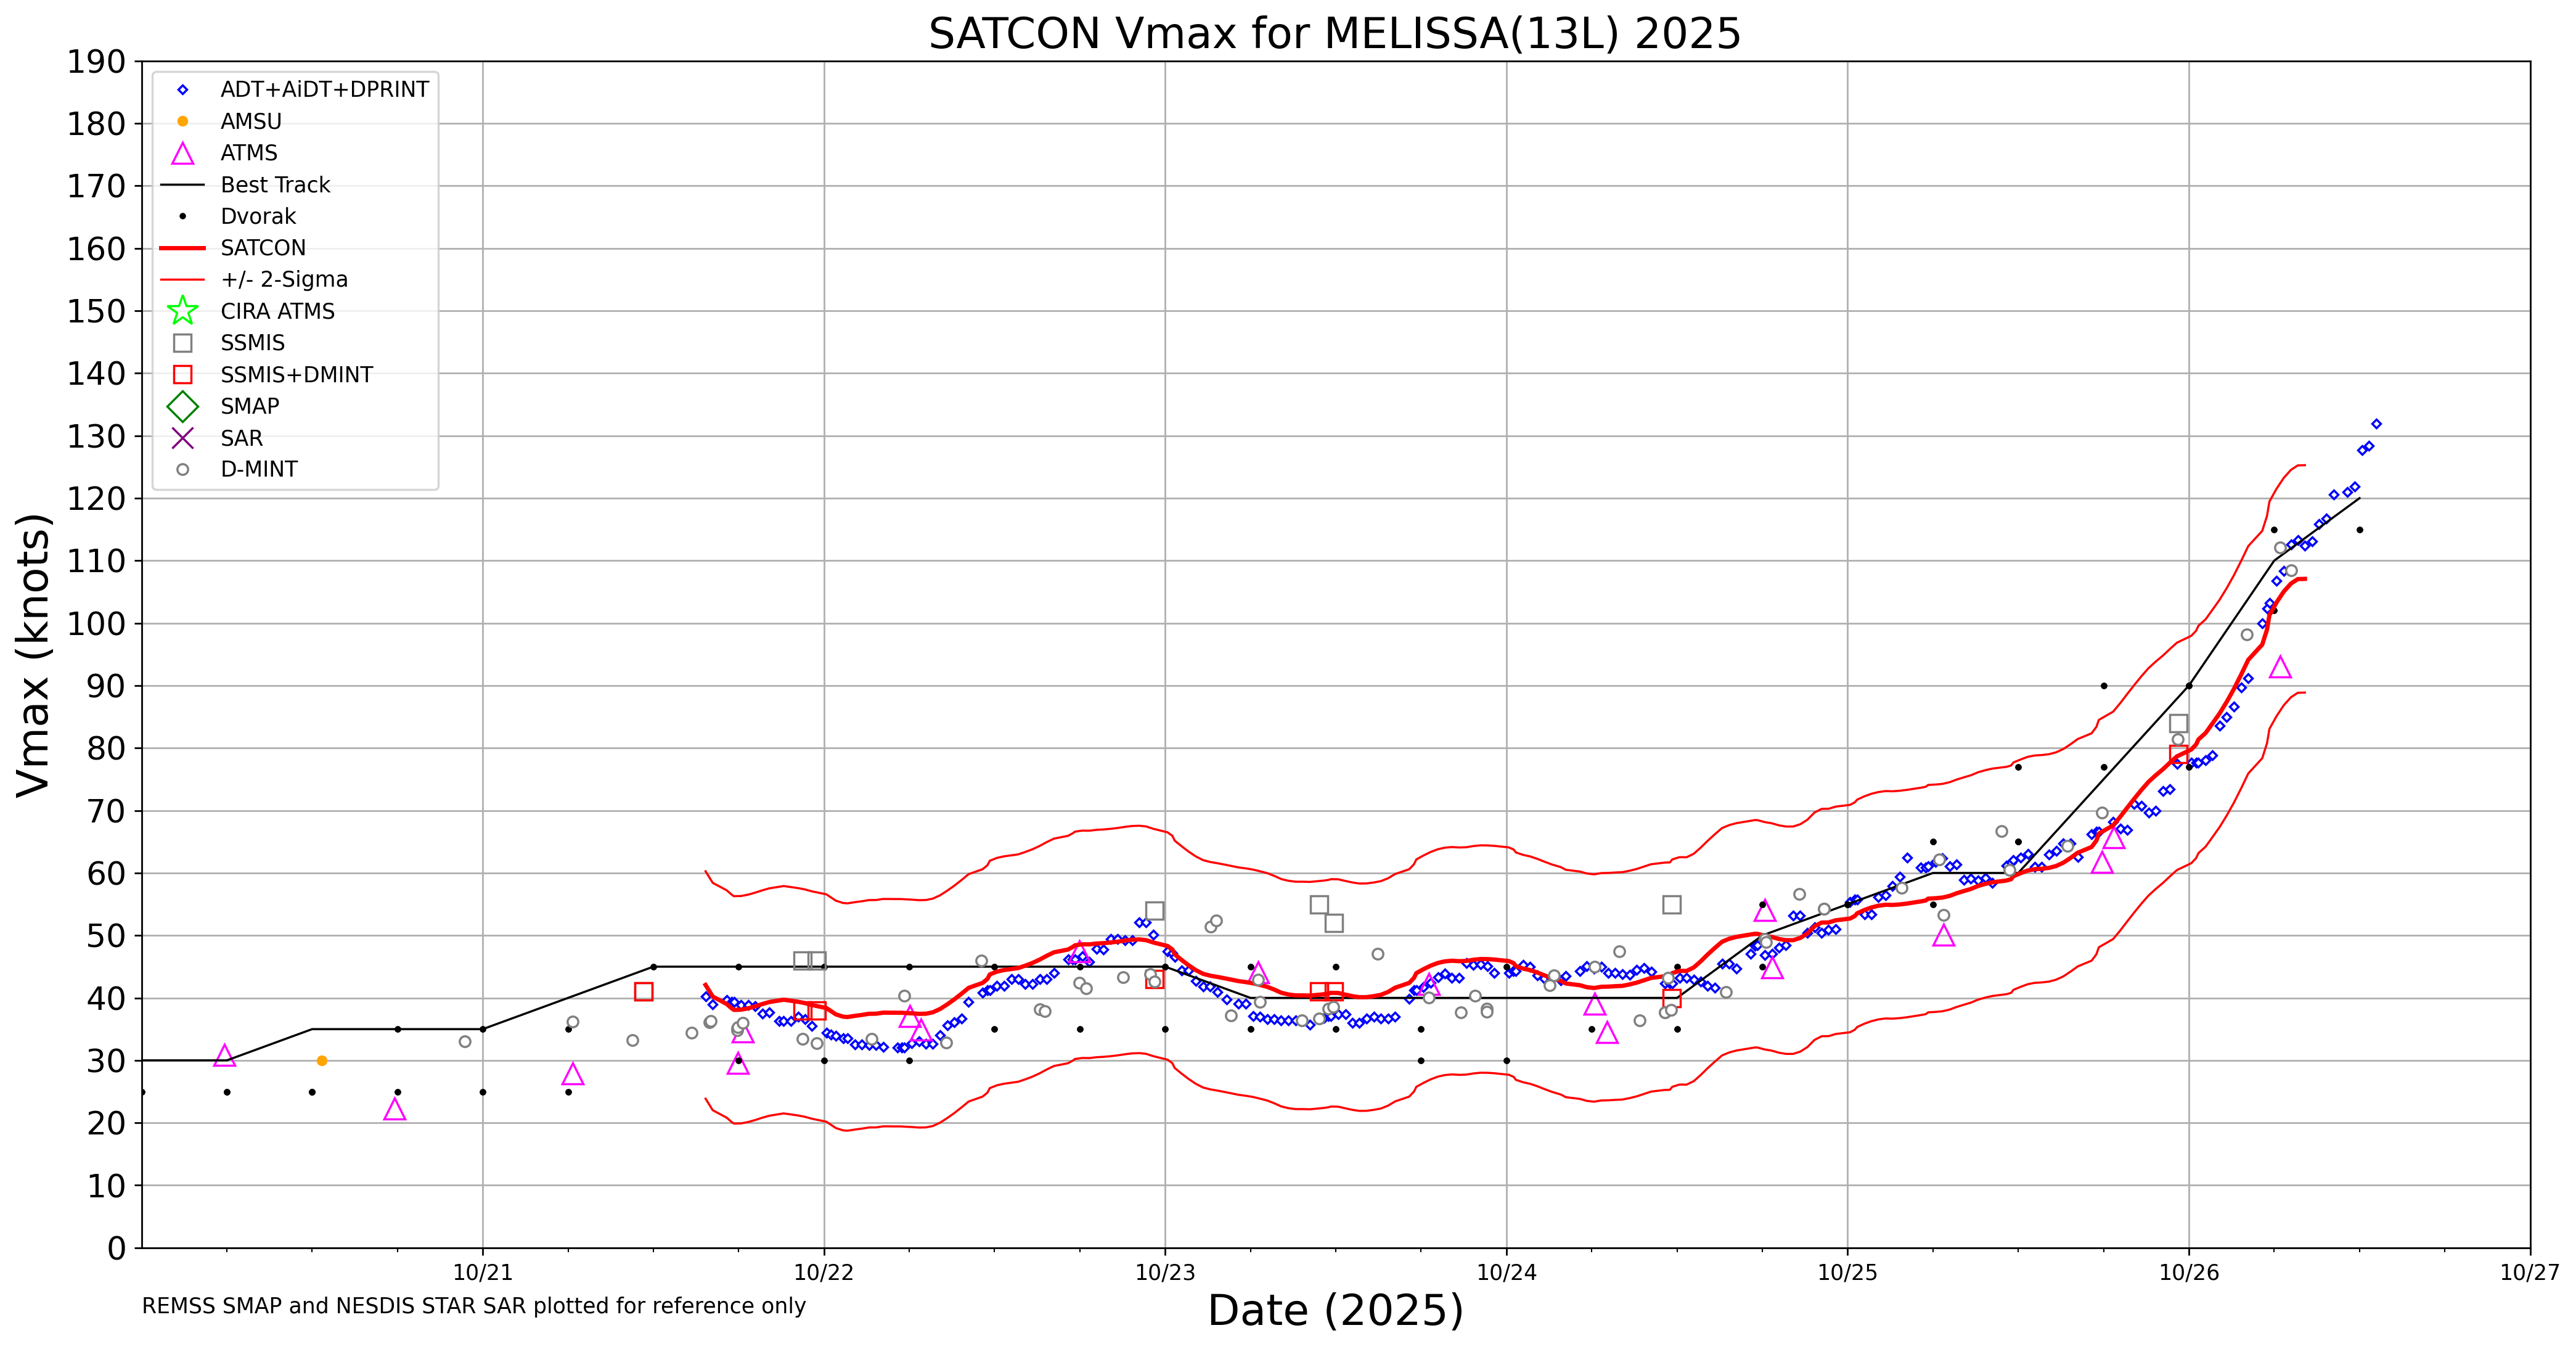
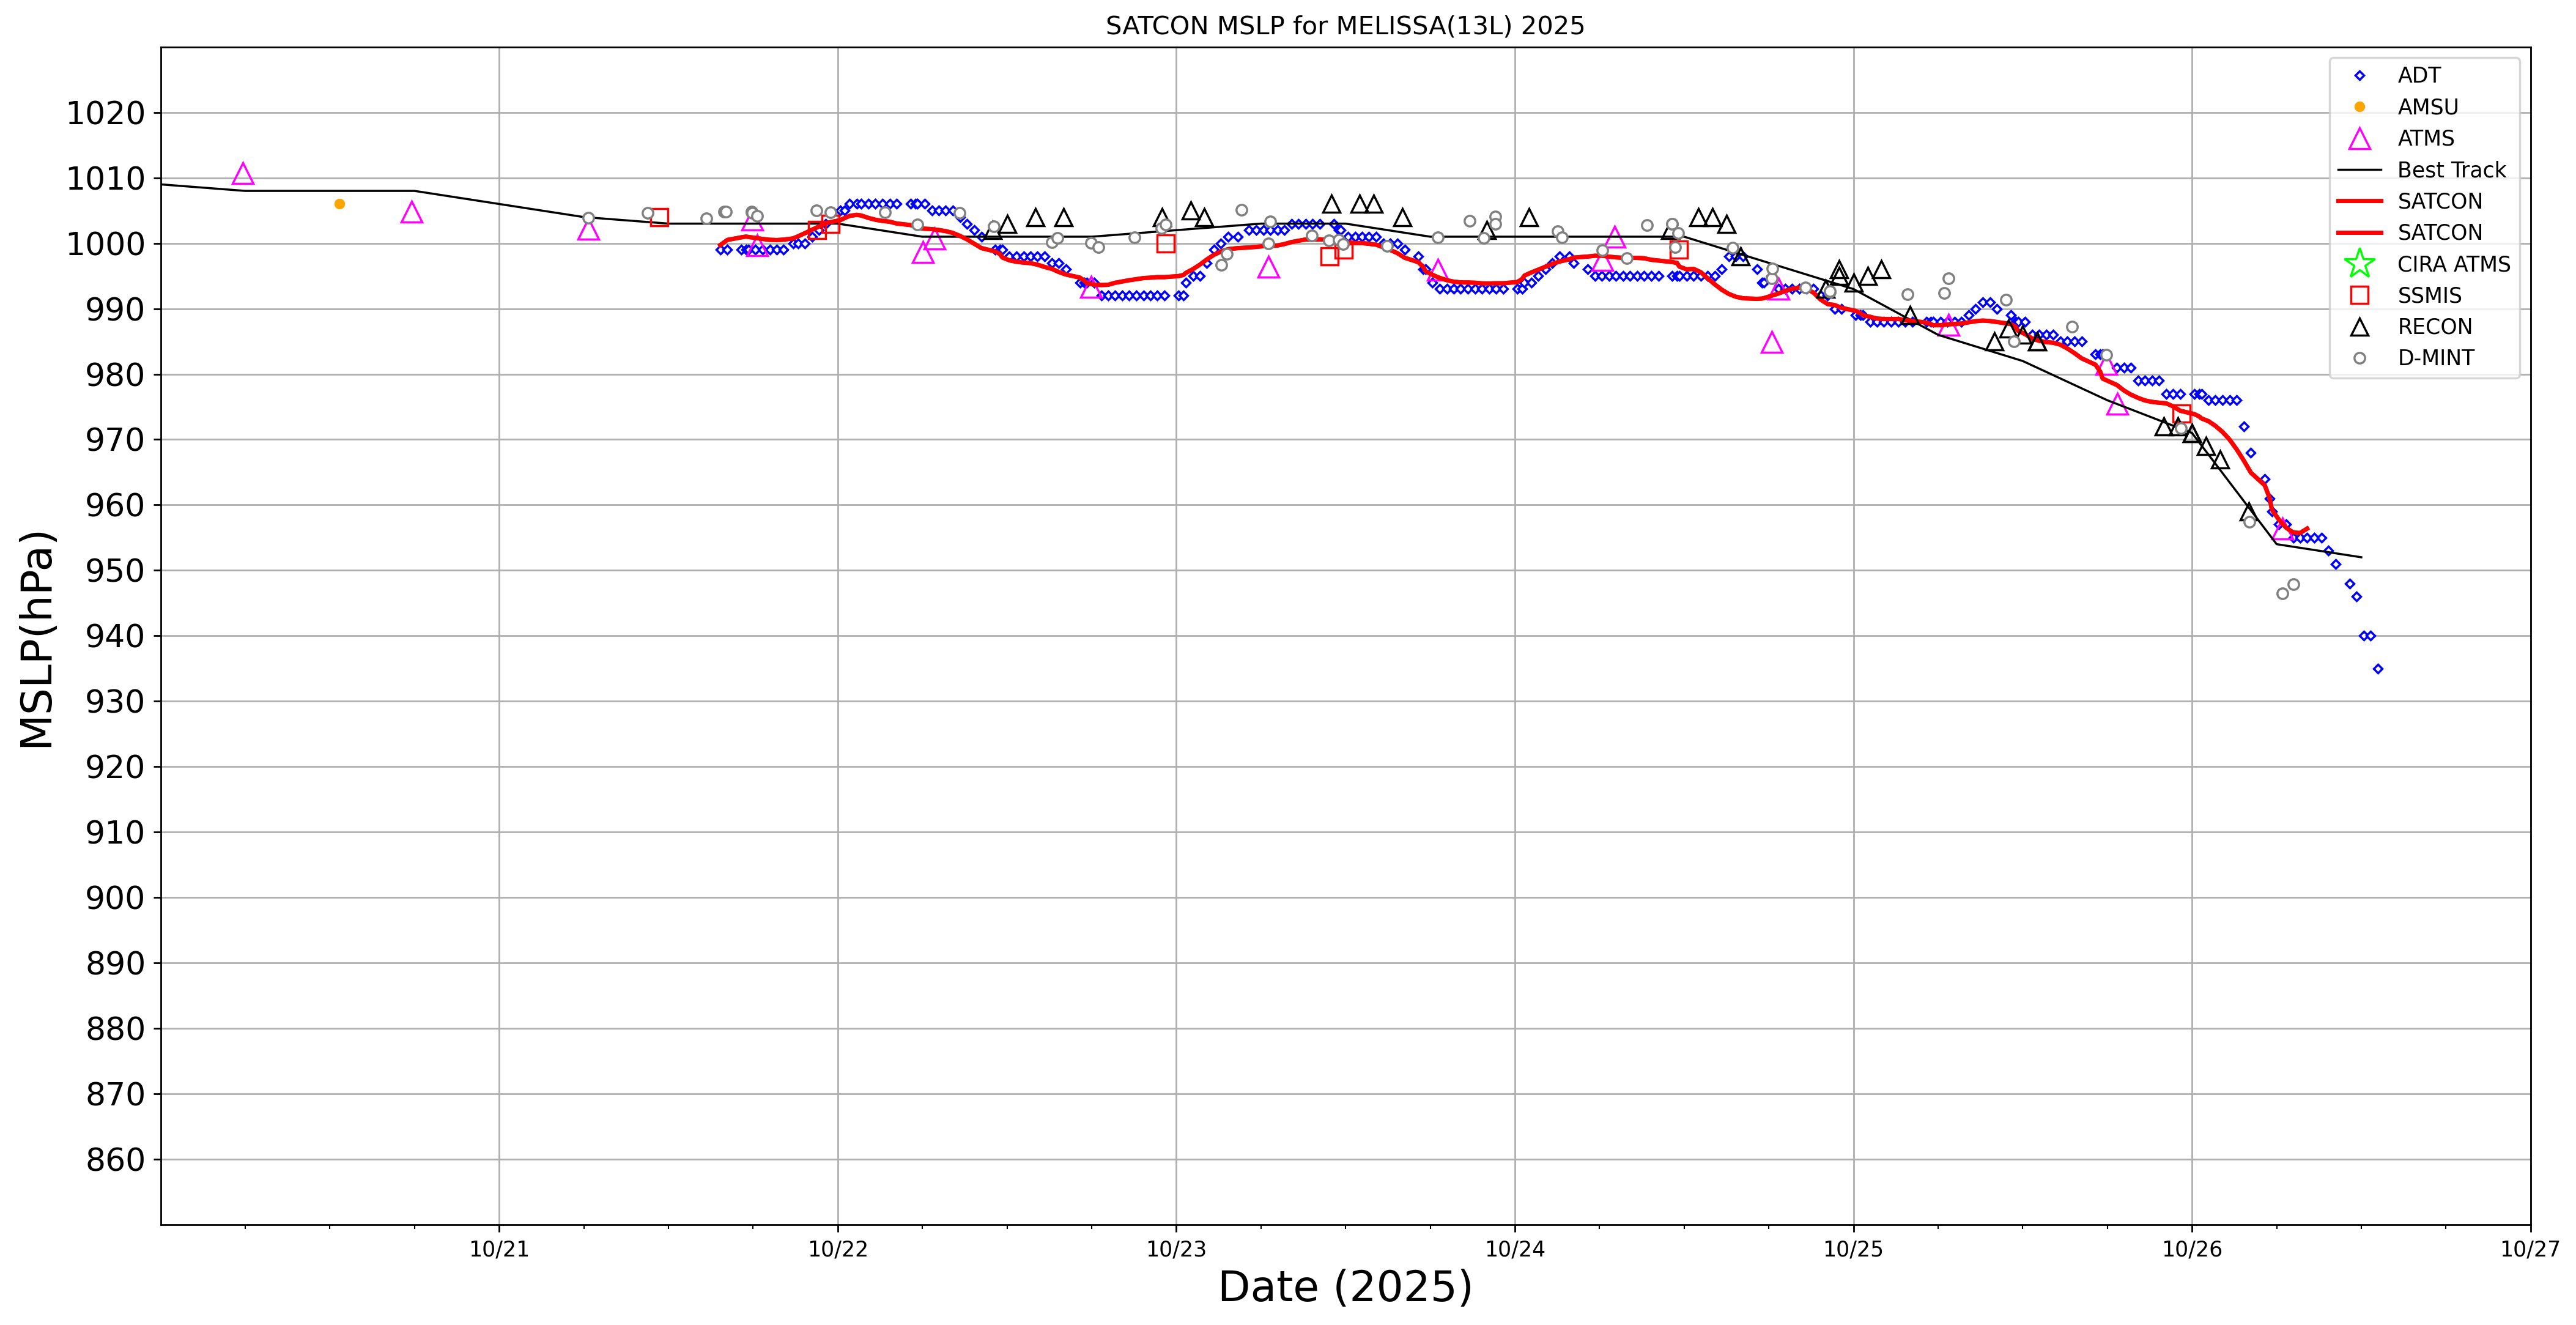
SATCON has steadily increased, now at 149kt, 926mb
2025 AL 13 300.049 2025OCT27 011021 16.28 77.37 2 926 149
~ ~
Based on the above I am going to again reference an adjusted Google/18Z distribution by the last center dropsonde alone (from the earlier 01Z recon -- there is another recon mission going on now that hasn't reached the center yet), and bet aggressively given I still see no evidence yet of an ERC.
I note the lowest end bin now 0% (I did check without an adjustment and 6% (or 3/50) do reach below 900mb), so although betting aggressively I don't go below 1.5% for this bin considering the CDF of the (lowest) 1-sided bin would not be accurately reflected in a 50 member ensemble (taking the 1.5% from the most likely bin)... Additionally I shift the 2% from the 940-950 bin to a bin lower to the current highest logically possible bin (the 933 official min. advisory from 03Z)
Minimum Estimated Dropsonde Pressure: 932.9mb at 23:21z
18Z run Google mean track points:
2510262300 ( +16.37, -77.18) 133.1 932.0
2510270000 ( +16.36, -77.24) 135.6 929.6
interpolating...
932.0 + (932.0-929.6) * (-21/60) = 931.16
932.9 - 931.16 = +1.74 mb adjustment
Unadjusted mean min. mslp: 914.620
Adjusted 1.74 mean min. mslp: 916.360
Total models: 50
MSLP bin distribution (% of models):
< 899.5 : 0.0%
[899.5, 909.5) : 22.0%
[909.5, 919.5) : 46.0%
[919.5, 929.5) : 30.0%
[929.5, 939.5) : 0.0%
[939.5, 949.5) : 2.0%
[949.5, 959.5) : 0.0%
[959.5, 969.5) : 0.0%
[969.5, 979.5) : 0.0%
>= 979.5 : 0.0%
manually adjusting becomes..
< 899.5 : 1.5%
[899.5, 909.5) : 22.0%
[909.5, 919.5) : 44.5%
[919.5, 929.5) : 30.0%
[929.5, 939.5) : 2.0%
[939.5, 949.5) : 0.0%
[949.5, 959.5) : 0.0%
[959.5, 969.5) : 0.0%
[969.5, 979.5) : 0.0%
>= 979.5 : 0.0%
Finally I note before betting, magically the market is at 916.5 mb (where the above estimate is at ~ 916.36)
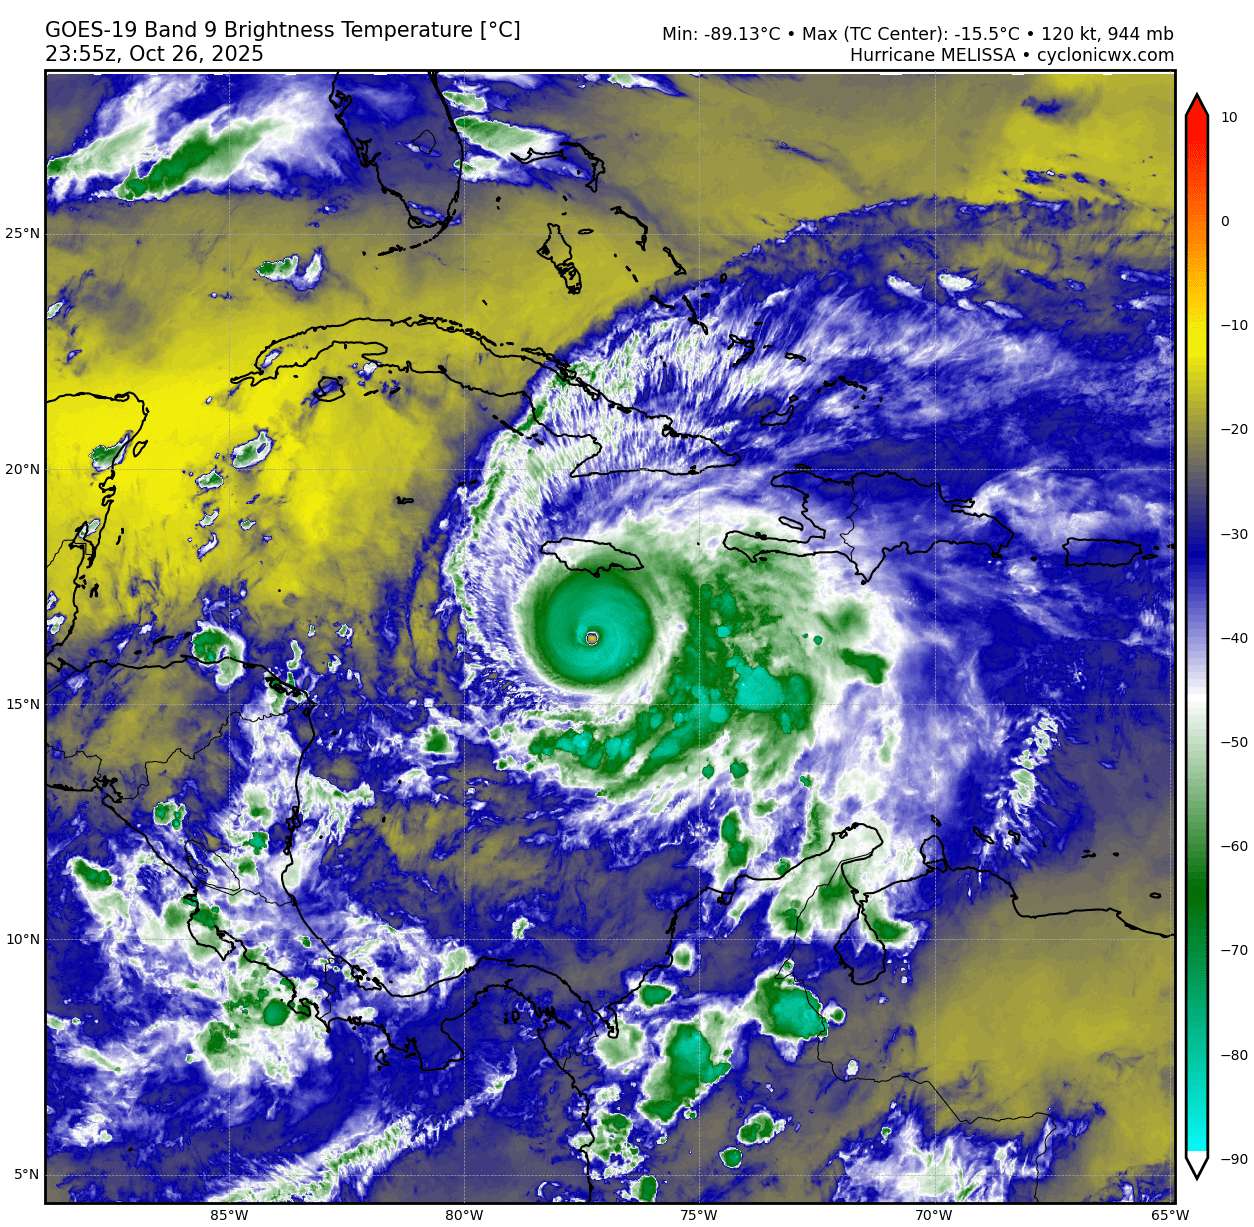
@parhizj If there was no recon this would have been classified as cat 5 based on satellite alone a while ago...both pressure and winds seem to be lagging satellite presentation for some reason?
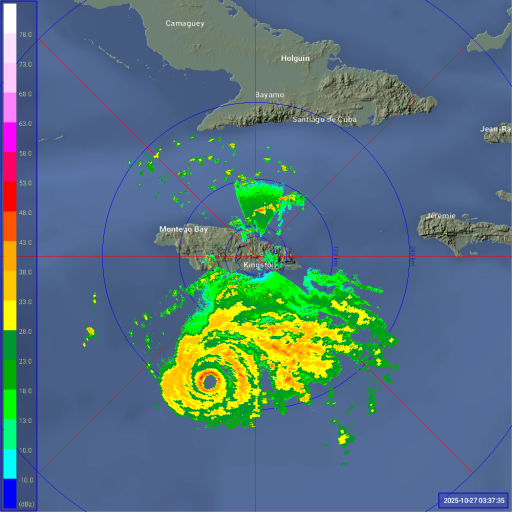
To any traders not aware, you can see the Doppler radar from Kingston here: https://metservice.gov.jm/daily-forecast/radar/
The latest frames seem a bit suggestive of an incoming EWRC to me - the 21z discussion referenced radar showing "hints of a moat forming around the inner eyewall, though without an obvious secondary eyewall formation yet" and to my untrained eye it looks like that pattern has developed further. We should know more soon based on whether recon detects a secondary wind max, which would be strong evidence of an outer eyewall.
recon has started again.. looks like it has strengthened further in terms of minimum pressure but the winds might still have not yet increased ...
Minimum Extrap. Pressure: 932.4mb at 23:21z
The 937mb center drop had fairly high winds (41 kt) but using the standard reduction, its 932.9 mb.
~
(accidentally lost the analysis of what I wrote)...
in short updating on Google/12Z alone again (as it has performed very well so far I think based on track and intensity even if the mean was off on the exact RI periods) using latest recon after reviewing various products, sat imagery, recon, gfs/ships 18Z, google 12Z, 06Z (track error and evaluated last bet's assumptions). (Hard to best aggressively adjusting all the bins...);
quick summary through 19Z ...
over the recent recon (referencing cyclonicwx's site), the 3 last center drops (and min extrap pressure) have been decreasing and based on that, sat imagery (primary band contracting), increase in 18Z best track wind field for all radii, various other products, and timing (getting near sunset, so I expect more convection in the outer most rain band to pick up and improve the RH to near ideal (it has been slightly less so earlier per GFS ships and examining WV imagery -- this is only temporary I believe while the storm strengthens), I believe its going through another intensification phase and expect it won't stop soon...
Given how aggressive they have been so far upgrading this season, I am expecting they will upgrade for the 21Z advisory to at least 130 kt based on one of the eyewall dropsondes and other satellite estimates (despite the MBL/FLW supporting lower numbers)... the satellite estimates though remain high, latest pair of DVTS are 6.5/7.0 and 7.0/7.0, objective ADT , AiDT, D-PRINT, etc are all significantly higher, and even satcon is slightly above 130 kt, possibly they may make it 135kt based on the trend...
~
Adjusting Google 12Z..
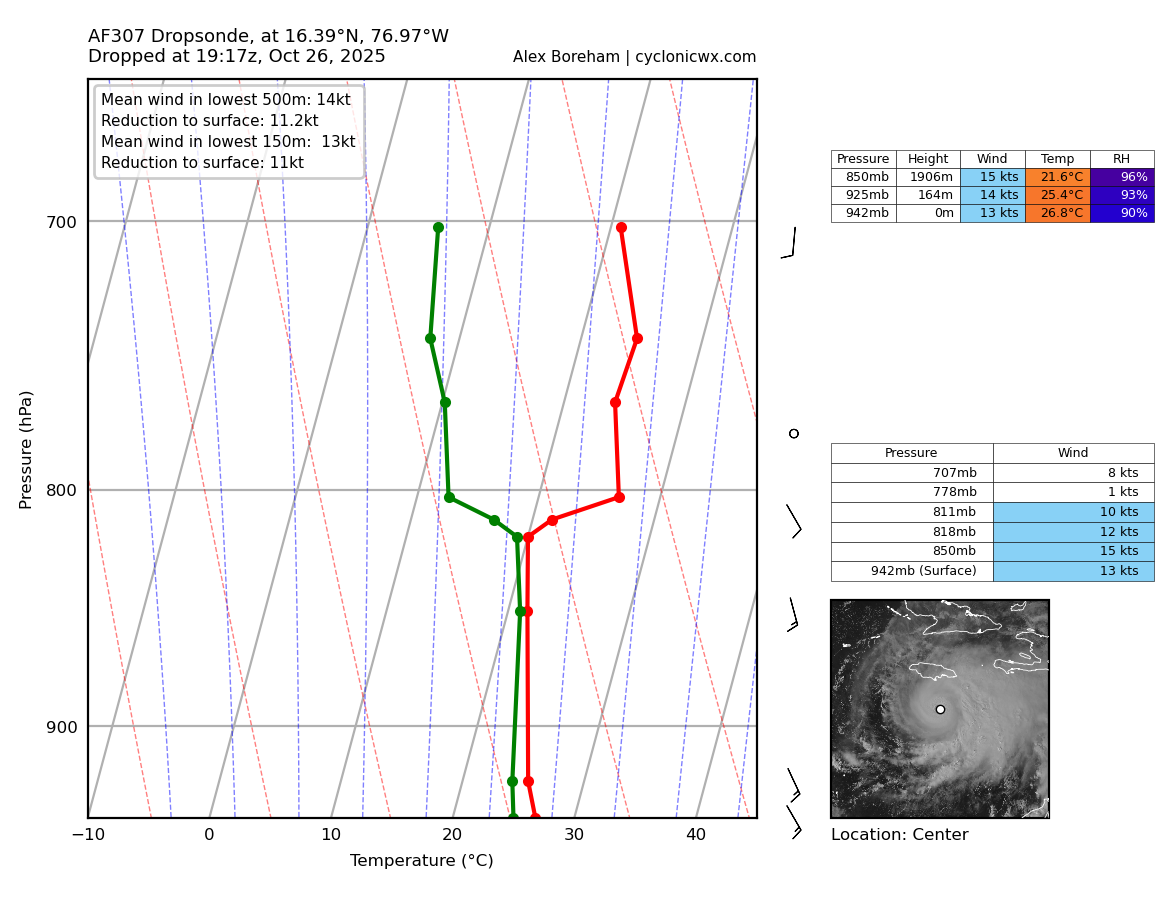
Minimum Extrap. Pressure: 939.9mb at 19:19z
Edit: needed to redo the calculations from a couple of errors (pasted wrong pressure measurement, wrong sign in calculation -- only a tiny difference in %)
Minimum Estimated Dropsonde Pressure: 940.7mb at 19:17z
12Z run Google mean track points:
2510261900 ( +16.50, -76.95) 124.3 940.8
2510262000 ( +16.49, -77.03) 125.5 939.5
interpolating...
940.8 + (940.8-939.5) *(-19 / 60) ~= 940.4
940.7 - 940.4 = +0.3 mb adjustment
Unadjusted mean min. mslp: 914.710
Adjusted 0.3 mean min. mslp: 915.010
Total models: 50
MSLP bin distribution (% of models):
< 899.5 : 4.0%
[899.5, 909.5) : 20.0%
[909.5, 919.5) : 48.0%
[919.5, 929.5) : 24.0%
[929.5, 939.5) : 2.0%
[939.5, 949.5) : 2.0%
[949.5, 959.5) : 0.0%
[959.5, 969.5) : 0.0%
[969.5, 979.5) : 0.0%
>= 979.5 : 0.0%
After being too generous earlier with the previous couple advisories they are now conservative and stick to all of the recon, upgrading it to 125 kt.
Reposting the 21Z discussion
Hurricane Melissa Discussion Number  22
NWS National Hurricane Center Miami FL       AL132025
500 PM EDT Sun Oct 26 2025

After an earlier pause in intensification, this afternoon's Air
Force Reserve reconnaissance mission has found Melissa intensifying
again. The minimum pressure has fallen 12 mb from this morning
NOAA-P3 mission, with the last dropsonde indicating a minimum
pressure of 941 mb, and the plane reported a shrinking eyewall down
to 6 n mi in diameter. In addition to the low pressure, the
satellite presentation of Melissa remains very impressive, with
1-minute visible satellite images from a GOES-19 meso-sector showing
a very clear eye with a stadium effect. The eye temperature on water
vapor imagery has continued to warm, while the thick ring of eyewall
cloud tops remains between -75 to -80 C around the eye. The
presentation of Melissa on radar reflectivity from Kingston, Jamaica
has also improved, though there still appear to be hints of a moat
forming around the inner eyewall, though without an obvious
secondary eyewall formation yet. Subjective Dvorak CI-numbers from
both SAB and TAFB were T7.0/140 kt, with objective satellite
estimates between 132-143 kt. However, Melissa's peak winds from the
last couple of recon missions have been lagging the satellite-based
estimates. The last fix had peak 700 mb flight level winds of only
129 kt, but a dropsonde launched in the north eyewall also reported
a 500 m layer average of 142 kt, with an earlier dropsonde in the NE
eyewall with a surface wind gust of 131 kt. This data is enough to
raise the maximum sustained winds of 125 kt, and given the satellite
presentation, this could be conservative.

Melissa continues to move slowly westward, estimated at 270/4 kt.
The hurricane has been moving a little faster to the west today, and
this motion will likely continue for another 12-18 hours while the
narrow mid-level ridge to the north remains in place. Soon, a
short-wave trough will be moving into the SE United States, and this
feature should create a weakness that Melissa will turn
sharply northeast into, as it gradually accelerates. The track
guidance has shifted a little westward again this cycle, and the NHC
track forecast was nudged a little west again, but still shows
landfall on Tuesday morning along the south coast of Jamaica. There
remain some timing differences thereafter, but a second landfall is
anticipated along the southeastern Cuba coast by Tuesday night or
early Wednesday morning. As Melissa then accelerates into the
southwestern Atlantic, it will move through the Bahamas and
potentially approach Bermuda by the day 4-5 time frame, with a
reinforcing trough helping to kick it farther out to sea. The latest
NHC track forecast is a little west in the first 24-60 h, but falls
back near the previous forecast track thereafter. The track is
roughly a blend of the reliable HFIP Corrected Consensus Approach
(HCCA) and Google Deep Mind ensemble mean (GDMI).

Now that Melissa is intensifying again, it seems more clear that the
earlier pause in intensification was a temporary oscillation, and
the hurricane now appears poised to intensify more in the
short-term. The latest NHC intensity forecast shows a little more
intensification in 12 h, but continues to show a peak intensity of
140 kt, which is supported by HAFS-B which shows landfall of Melissa
as a catastrophic Category 5 hurricane. The Google DeepMind ensemble
members also continue to indicate this peak, with now 48/50 members
reaching this lofty intensity. However, inner-core processes like
ERCs could occur at any time, and the current small eye of Melissa
likely suggests an ERC could begin in the next 24 hours or so,
though it is very difficult to predict these occurrences with much
skill. After landfall in Jamaica, Melissa will likely weaken some
due to the interaction with that Island's high terrain, but it is
still expected to be a major hurricane when crossing the Cuba
coastline on Tuesday night. After emerging into the southwestern
Atlantic Ocean, increasing vertical wind shear should continue
gradual weakening through the end of the forecast, with the
possibility that Melissa could start extratropical transition by day
5. The NHC intensity forecast continues to be on the high side of
the guidance, but falls closer to the HCCA and IVCN aids towards the
end of the forecast period.

Key Messages:

1. Jamaica:  Seek shelter now.  Damaging winds and heavy rainfall
tonight and Monday will cause catastrophic and life-threatening
flash flooding and numerous landslides before potentially
devastating winds arrive Monday night and Tuesday morning.
Extensive infrastructural damage, long-duration power and
communication outages, and isolation of communities are expected.
Life-threatening storm surge and damaging waves are expected along
portions of the southern coast Monday night and Tuesday morning.

2. Haiti and the Dominican Republic:  Catastrophic and
life-threatening flash flooding and landslides are expected across
southwestern Haiti and southern portions of the Dominican Republic
through midweek.  In Haiti, extensive infrastructural damage and
isolation of communities is likely. Although winds have temporarily
decreased on the Tiburon peninsula, they are likely to increase
again across much of western Haiti on Tuesday.

3. Eastern Cuba:  Life-threatening storm surge is expected along
portions of the southern coast of eastern Cuba late Tuesday and
Tuesday night.  Damaging winds and heavy rainfall with
life-threatening and potentially catastrophic flash flooding and
landslides are also expected beginning on Monday.  Preparations
should be rushed to completion.

4. Southeast Bahamas and the Turks and Caicos: Monitor Melissa
closely.  There is an increasing risk of a significant storm surge,
damaging winds, and heavy rainfall Tuesday and Wednesday.  Watches
will likely be required early Monday.

FORECAST POSITIONS AND MAX WINDS

INIT  26/2100Z 16.4N  77.2W  125 KT 145 MPH
 12H  27/0600Z 16.4N  77.7W  135 KT 155 MPH
 24H  27/1800Z 16.6N  78.2W  140 KT 160 MPH
 36H  28/0600Z 17.2N  78.2W  140 KT 160 MPH
 48H  28/1800Z 18.4N  77.5W  115 KT 130 MPH...INLAND OVER JAMAICA
 60H  29/0600Z 20.0N  76.1W  105 KT 120 MPH...ON THE SE CUBA COAST
 72H  29/1800Z 22.1N  74.4W   90 KT 105 MPH...OVER WATER
 96H  30/1800Z 28.0N  69.5W   80 KT  90 MPH
120H  31/1800Z 37.0N  60.0W   70 KT  80 MPH

$$
Forecaster Papin
Latest 15Z NHC advisory keeps it at 953mb, 120 kt. I updated with center drop from 11Z and adjust from google/06Z alone (+8.5 mb) not using NHC 15Z.
ggl pnt:
2510261100 ( +16.32, -76.44) 122.1 943.1
~
written <15Z - Long thread with intermediate reanalysis of the 06 tcvitals and 09Z advisory
~
The NHC raised it to a cat. 4 with the 09Z advisory (944mb 120kt) based on AI satellite-derived estimates - CIMSS D-PRINT, AiDT
Recent recon data seems to indicate that might possibly have been an overestimate at the time (at least in terms of pressure). Don't knowwhat support they used for the current best track 12Z wind speed of 120kt...seems a bit on the high end for 952mb based on the recon data (it is a small sample of dropsondes so might there be undersampling, or not great samples of the eyewall); other satellite derived estimates are higher though, and some recent estimates from satellite data put it at cat 5 now.
DVTS from SAB (7.0/7.0), D-PRINT ( operational (OSPO) ADT/AiDT:
(OSPO ADT/AiDT):
Date Time ADT AIDT Best
20251026 131021 137 137 120
20251026 135021 143 139 120
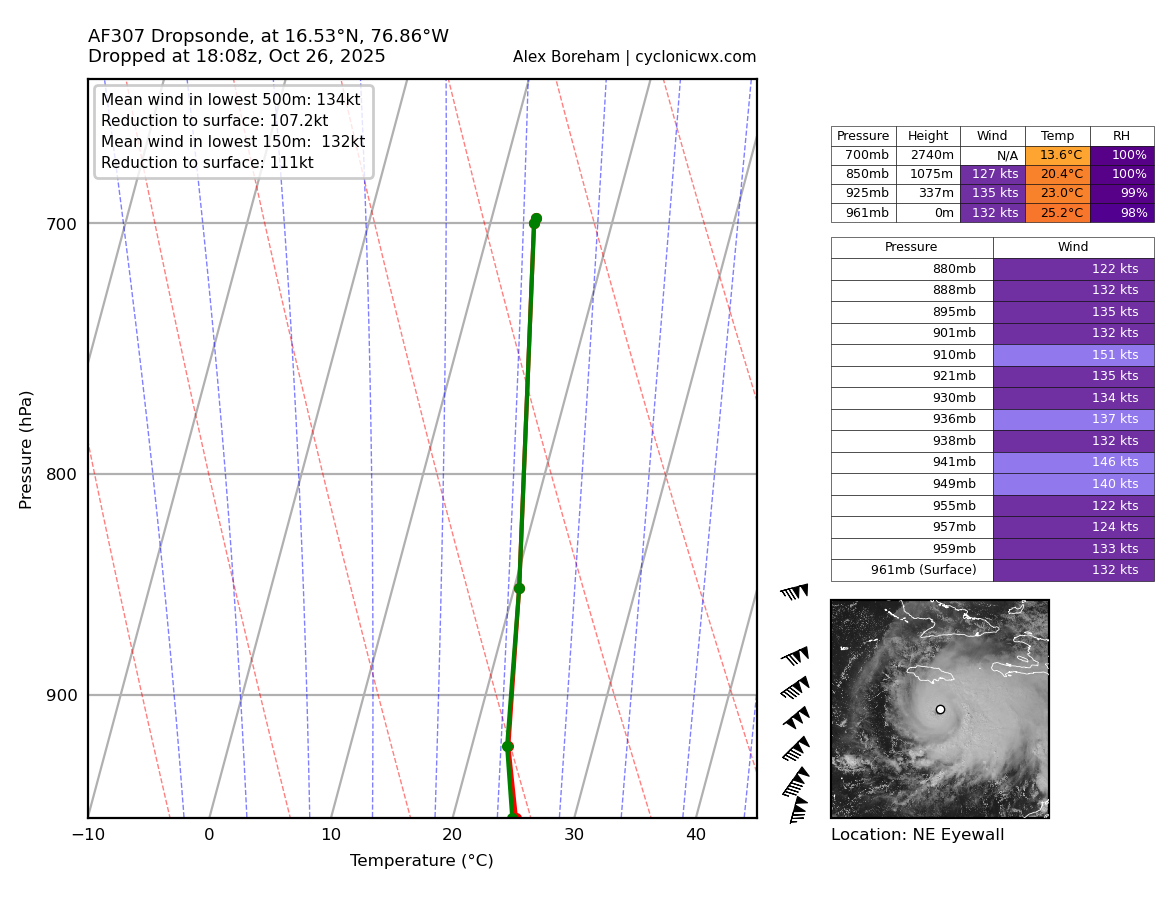
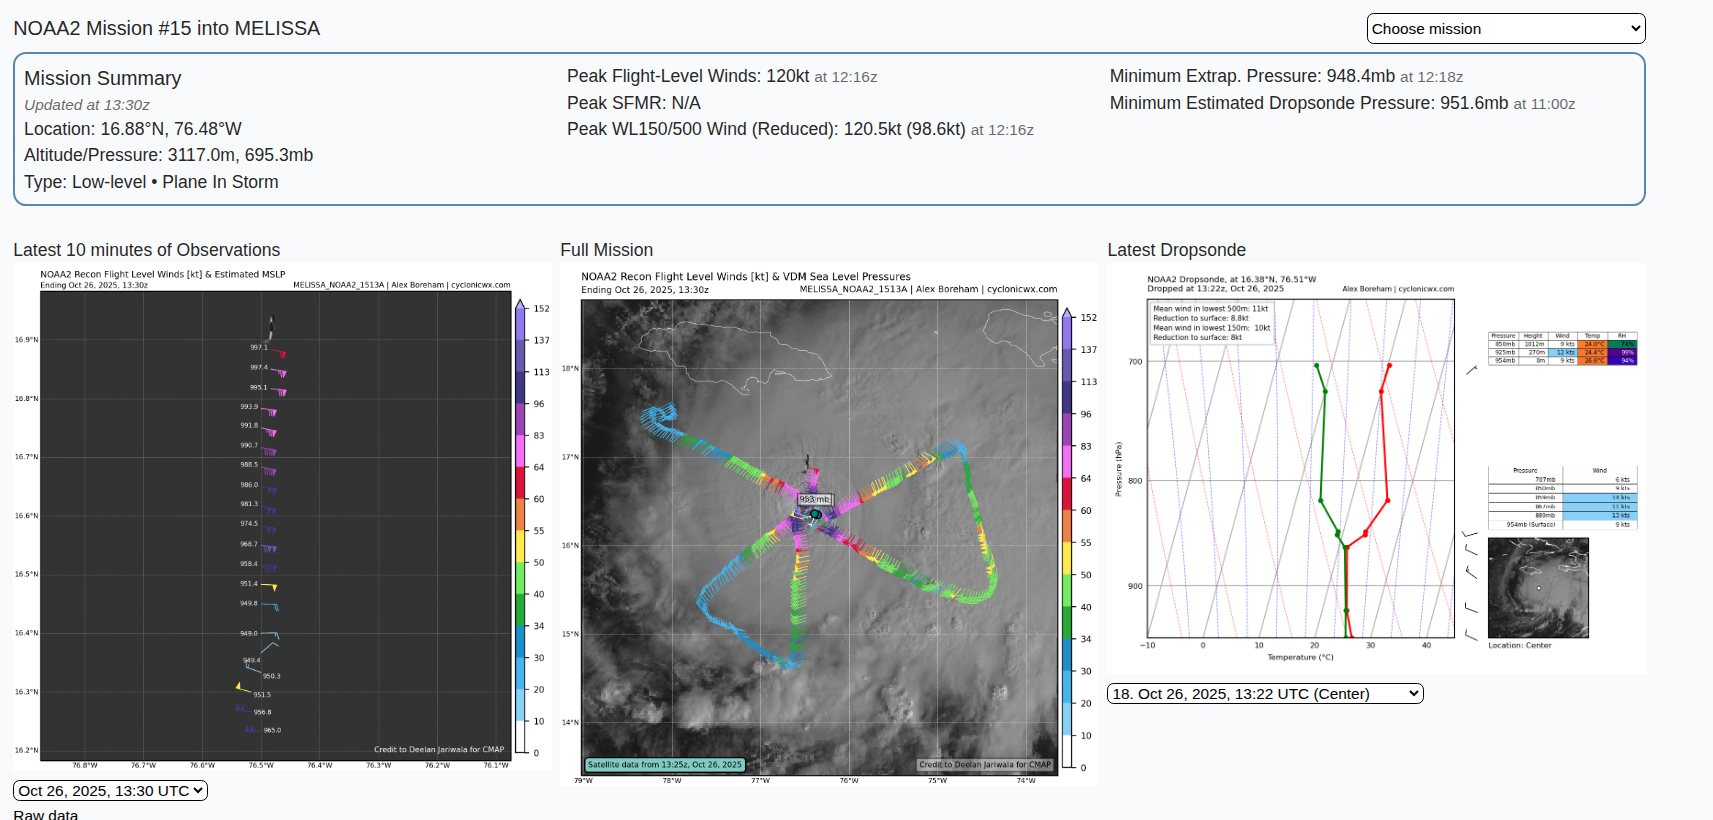
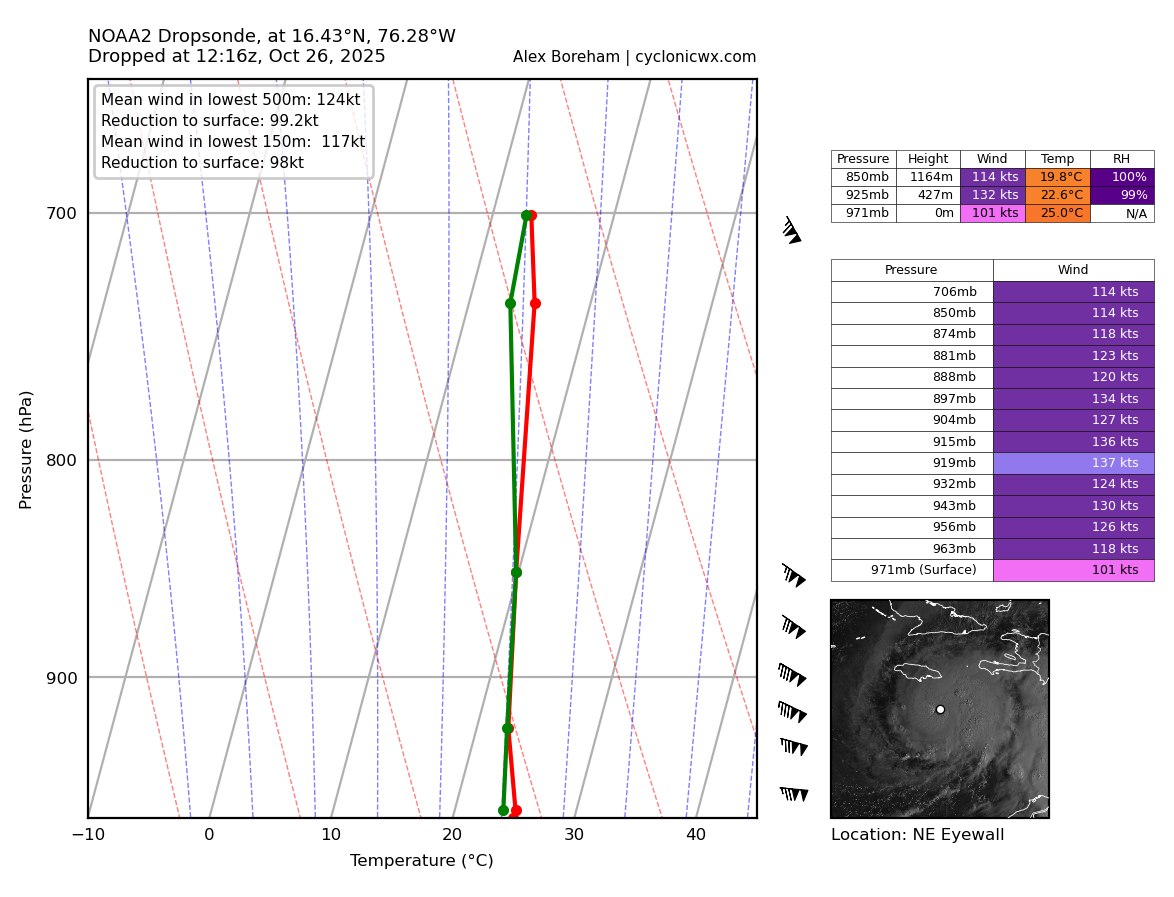
Recent recon (referencing cyclonicwx excellent recon charts):
from ~10:30-13:30Z
Minimum Estimated Dropsonde Pressure: 951.6mb at 11:00z
Minimum Extrap. Pressure: 948.4mb at 12:18z
~
Recent (CIMSS) D-PRINT:
Date Time TC_Lat TC_Lon MSLP VMAX VMAX_25percentile VMAX_75percentile
20251026 055021 94 104 90
20251026 062021 104 111 110
20251026 063021 104 112 110
20251026 072021 112 116 110
20251026 075021 112 119 110
20251026 080021 115 120 110
20251026 083021 115 123 110
20251026 092021 117 124 110
20251026 094021 117 126 110
20251026 102021 119 127 110
20251026 104021 119 128 110
20251026 112021 124 130 110
20251026 115021 127 132 110
20251026 121021 129 133 120
20251026 124021 134 135 120
20251026 131021 137 137 120
20251026 135021 143 139 120
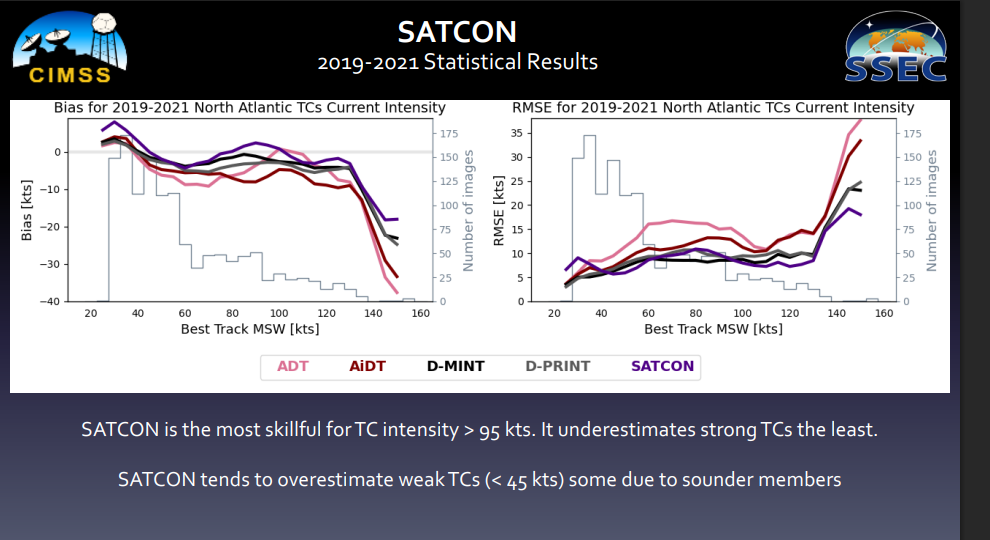
D-PRINT verification chart:
~
Restrospectively based on the above and below data, it looks like the 06Z initializations for the models were too strong (looking at the tcvitals archive) and the 09Z advisory which had it at 944 mb also seems too strong; before 06Z it still hadn't yet cleared out an eye (looks like the eye was a bit chaotic as it did so) but it did clear it out before 09Z, and since then to 13Z there hasn't been any reorganization apparent); regardless for the 09Z advisory they relied on AiDT and D-PRINT - both AI models based on sat imagery with lower RMSE generally compared to other satellite estimates (~10 kt), but the verification statistics for major hurricanes, D-PRINT for instance, might be a bit sparse (eyeballing their chart for 2019-2021 looks like ~200 cases for major hurricanes), and although they had negative bias, the current recon indicates ADT,AiDT,D-PRINT are over-estimating the current intensity from recon. The dropsondes accuracy is +- 0.5 mb, while the RMSE for D-PRINT is generally 10kt.
The CIMSS SATCON product which is supposed to reduce these biases... as of last update supported only 956 mb, 109 kt for 06Z (this has data not available to the previous advisory of course)
D-MINT (which only recently became available) supports 110 kt for 06Z:
 2025OCT26  0626   16.40   -76.09   ATMS-N21   946   112          106                119
 2025OCT26  0712   16.30   -76.18     AMSR2    948   108          102                115
DVTS fixes:
AL, 13, 202510260600,  10, DVTS,         CI,  , 1630N,  7620W,      , 1, 115, 2,     ,  ,     ,    ,     ,     ,     ,     ,     ,  ,  ,  ,  ,  ,    ,    , L,   SAB,  SL,   IM, 1, 6060 /////,      ,   , GOES19, LLCC, T, DT=6.5 BO EYE  MET=5.0 PT=5.5 FTBO CON
AL, 13, 202510260600,  10, DVTS,         CI,  , 1640N,  7610W,      , 1, 102, 2,  960, 2, DVRK,    ,     ,     ,     ,     ,     ,  ,  ,  ,  ,  ,    ,    , L,  TAFB,  EC,    I, 1, 5555 /////,      ,   , GOES19,  CSC, T, Clear cut Data T = 6.0 via eye pattern
AL, 13, 202510261200, 10, DVTS, CI, , 1640N, 7640W, , 1, 115, 2, 948, 2, DVRK, , , , , , , , , , , , , , L, TAFB, EA, VI, 1, 6060 /////, , , GOES19, CSC, T, Constrained by Dvorak rules (12 h). Data T clear cutOSPO DVTS (note DT of 6.5 and 7.0 for 06Z and 12Z):
TXNT28 KNES 260639
TCSNTL
A. 13L (MELISSA)
B. 26/0600Z
C. 16.3N
D. 76.2W
E. ONE/GOES-E
F. T6.0/6.0
G. IR/EIR/SWIR
H. REMARKS...OW EYE SURROUNDED BY CMG AND EMBEDDED IN W RESULTS IN AN E#
OF 6.0 WITH AN EADJ OF 0.5 FOR A DT OF 6.5. THE 6-HOUR AVG GIVES 6.1 SO
THIS DOES NOT JUSTIFY BREAKING CONSTRAINTS AT THIS TIME. THE MET EQUALS
5.0 BASED ON A RAPIDLY DEVELOPING 24-HOUR TREND AND THE PT EQUALS 5.5. THE
FT IS BASED ON CONSTRAINTS DUE TO THE LIMIT OF 1.0 T-NUMBER CHANGE IN
6 HOURS.
I. ADDL POSITIONS
NIL
...LINER
TXNT28 KNES 261220
TCSNTL
A. 13L (MELISSA)
B. 26/1200Z
C. 16.4N
D. 76.4W
E. ONE/GOES-E
F. T7.0/7.0
G. IR/EIR/VIS
H. REMARKS...SYSTEM CHARACTERIZED BY A WMG EYE SURROUNDED BY W AND
EMBEDDED IN W FOR A DT=7.0 MET=6.0 PT=6.5. THE FT IS BASED ON THE 6 HOUR
AVERAGE DT OF 6.8 WHICH JUSTIFIES BREAKING TRADITIONAL DVORAK CONSTRAINTS.
I. ADDL POSITIONS
NIL
...FISHER
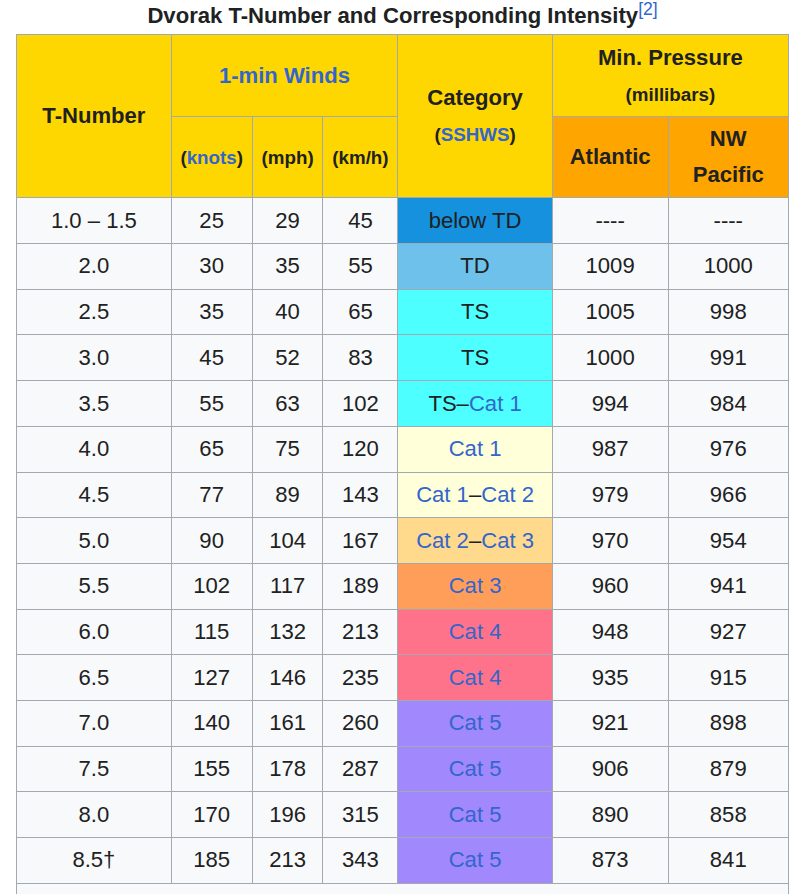
Thus, the subjective dvorak for 12Z are mixed at 6.0/6.0 and 7.0/7.0 (SAB breaking constraints and TAFB not); blending them puts it at a cat 4 (935mb, 127kt).
(wikipedia chart:)
recent CIMSS ADT for reference:
2025OCT26 054021 5.3 958.9 97.2 5.3 5.6 7.4 1.3T/6hr OFF OFF OFF OFF -24.05 -77.67 EYE -99 IR 80.3 16.22 76.05 ARCHER GOES19 19.0
2025OCT26 061021 5.4 957.0 99.6 5.4 5.6 7.2 1.3T/6hr OFF OFF OFF OFF -28.36 -77.17 EYE -99 IR 80.3 16.22 76.08 ARCHER GOES19 19.0
2025OCT26 064021 5.5 957.0 102.0 5.5 5.6 7.5 1.3T/6hr OFF OFF OFF OFF -10.11 -77.30 EYE -99 IR 80.3 16.22 76.11 ARCHER GOES19 19.0
2025OCT26 071021 5.6 954.9 104.6 5.6 5.7 7.7 1.3T/6hr OFF OFF OFF OFF 6.15 -77.44 EYE 13 IR 80.3 16.33 76.12 ARCHER GOES19 19.2
2025OCT26 074021 5.6 954.9 104.6 5.6 5.7 7.6 1.3T/6hr OFF OFF OFF OFF 9.52 -76.78 EYE 15 IR 62.0 16.33 76.15 ARCHER GOES19 19.2
2025OCT26 081021 5.6 954.9 104.6 5.6 5.7 7.6 1.3T/6hr OFF OFF OFF OFF 8.45 -76.98 EYE 17 IR 62.0 16.30 76.23 ARCHER GOES19 19.1
2025OCT26 084021 5.6 954.9 104.6 5.6 5.7 7.4 1.3T/6hr OFF OFF OFF OFF -0.11 -76.40 EYE 12 IR 62.0 16.28 76.23 ARCHER GOES19 19.1
2025OCT26 091021 5.6 954.9 104.6 5.6 5.7 7.2 1.3T/6hr OFF OFF OFF OFF 4.69 -75.23 EYE 14 IR 62.0 16.30 76.25 ARCHER GOES19 19.1
2025OCT26 094021 5.7 952.7 107.2 5.7 5.9 7.3 1.3T/6hr OFF OFF OFF OFF 12.77 -75.03 EYE 15 IR 62.0 16.30 76.26 ARCHER GOES19 19.1
2025OCT26 101021 5.8 950.6 109.8 5.8 6.1 7.5 1.3T/6hr OFF OFF OFF OFF 15.67 -76.13 EYE 15 IR 62.0 16.35 76.31 ARCHER GOES19 19.2
2025OCT26 111021 5.9 948.4 112.4 5.9 6.3 7.7 1.3T/6hr OFF OFF OFF OFF 16.56 -76.78 EYE 15 IR 62.0 16.32 76.40 ARCHER GOES19 19.2
2025OCT26 114021 6.0 946.2 115.0 6.0 6.5 7.2 1.3T/6hr OFF OFF OFF OFF 3.92 -74.85 EYE -99 IR 62.0 16.30 76.15 ARCHER GOES19 19.1
2025OCT26 121021 6.3 939.9 122.2 6.3 6.7 7.5 1.3T/6hr OFF OFF OFF OFF 17.11 -76.13 EYE 14 IR 62.0 16.30 76.46 ARCHER GOES19 19.1
2025OCT26 124021 6.3 939.7 122.2 6.3 6.8 7.4 1.3T/6hr OFF OFF OFF OFF 16.90 -75.30 EYE 16 IR 62.0 16.35 76.44 ARCHER GOES19 19.2
2025OCT26 131021 6.5 935.3 127.0 6.5 6.9 7.3 1.3T/6hr OFF OFF OFF OFF 14.95 -74.81 EYE 15 IR 62.0 16.37 76.47 ARCHER GOES19 19.2
CIMSS SATCON (hasn't been updated past 08Z):
2025 AL 13 299.007 2025OCT26 001021 16.68 75.63 2 974 80
2025 AL 13 299.021 2025OCT26 003021 16.68 75.63 2 973 82
2025 AL 13 299.028 2025OCT26 004021 16.68 75.66 2 973 82
2025 AL 13 299.049 2025OCT26 011021 16.64 75.74 2 972 85
2025 AL 13 299.069 2025OCT26 014021 16.65 75.76 2 970 87
2025 AL 13 299.090 2025OCT26 021021 16.65 75.77 2 970 90
2025 AL 13 299.111 2025OCT26 024021 16.41 75.88 2 969 93
2025 AL 13 299.132 2025OCT26 031021 16.40 75.91 2 970 91
2025 AL 13 299.153 2025OCT26 034021 16.39 75.94 2 966 95
2025 AL 13 299.174 2025OCT26 041021 16.22 75.97 2 964 97
2025 AL 13 299.215 2025OCT26 051021 16.22 76.02 2 960 104
2025 AL 13 299.229 2025OCT26 053021 16.22 76.02 2 958 106
2025 AL 13 299.236 2025OCT26 054021 16.22 76.05 2 957 107
2025 AL 13 299.257 2025OCT26 061021 16.22 76.08 2 956 109
2025 AL 13 299.278 2025OCT26 064021 16.22 76.11 2 954 112
2025 AL 13 299.299 2025OCT26 071021 16.33 76.12 2 953 114
2025 AL 13 299.319 2025OCT26 074021 16.33 76.15 2 953 115
2025 AL 13 299.340 2025OCT26 081021 16.30 76.23 2 953 114
~
I do note there was a very high SAR winds estimate for last night 25/23Z supporting 100 kt for 00Z (this was far above everything else at the time though, including on-going recon with a center-drop during that time)
Profile from OSPO (non-operational version) (OSPO operational version is also 100 kt though)
Platform: RCM-1
Acquisition Date: 2025-10-25 23:16:47 UTC
Storm Name: AL132025 / MELISSA
Storm ID: AL13
Storm Center Longitude: -75.706
Storm Center Latitude: 16.431
Incidence Angle (Degrees): 48.024
Quadrant 1 NE VMax (kts): 99.56
Quadrant 2 SE VMax (kts): 93.17
Quadrant 3 SW VMax (kts): 94.11
Quadrant 4 NW VMax (kts): 102.95
RMax (nmi): 10.00 - 15.00
AL, 13, 202510252315, 50, AIRC, CI, , 1641N, 7568W, , 2, 79, 2, 972, 1, , , , , , , , , , , , , , , , KNHC, NHC, , 700, 2869, 85, 298, 16, 44, 88, 304, 24, 972, 10, 17, 10, , , CI, , 28, , , 10, 14, CNTR DROP 210/12
AL, 13, 202510252316, 30, SAR, C, , 1647N, 7570W, , 3, , , , 3, , , , , , , , , , , , 3, , , , KNHC, LAK, , , , , , , , , RCM-1, , , , , , , , , , , , , , , , , , , 3, (Not sure why the fix file doesn't include the wind speed other than they possibly have eliminated it?
Couldn't edit it properly since I hit max char length, forgot to include tcvitals for 06Z:
NHC 13L MELISSA 20251026 0600 163N 0761W 250 021 0954 1008 0445 57 019 0278 0204 0093 0148 D 0056 0056 0037 0056 72 194N 761W 0037 0028 0028 0037
(satcon was +2 mb compared to this for 06Z)