 1,000
1,000🏅 Top traders
| # | Trader | Total profit |
|---|---|---|
| 1 | Ṁ309 | |
| 2 | Ṁ146 | |
| 3 | Ṁ80 | |
| 4 | Ṁ70 | |
| 5 | Ṁ42 |
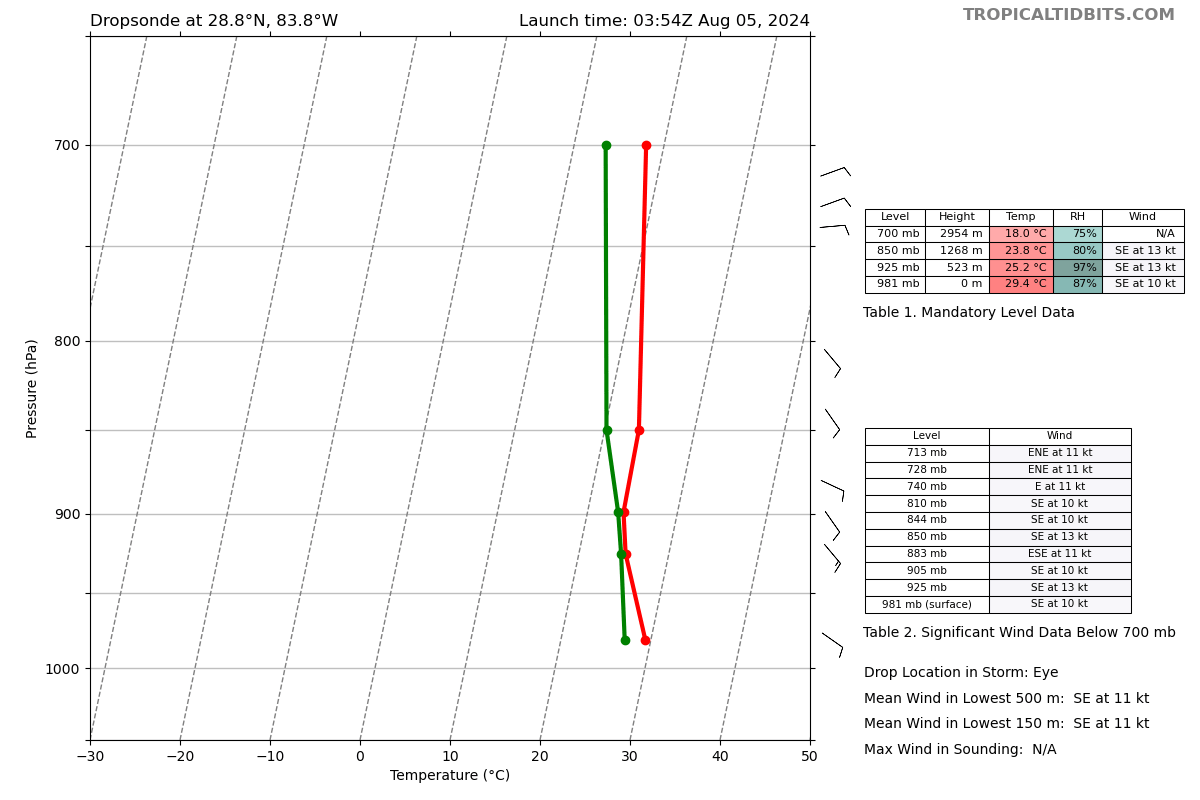
Made landfall as a cat. 1 (at ~ 11Z), 979 mb. Peak intensity in advisories was 70 kt...
https://www.nhc.noaa.gov/archive/2024/al04/al042024.update.08051056.shtml
Looks like it didn't strengthen since that dropsonde near 04Z of 979mb.
Officially hurricane Debby now per 11pm advisory:
"
...DEBBY BECOMES A HURRICANE AS IT APPROACHES THE NORTHEASTERN GULF COAST... ...WILL BRING A MAJOR FLOOD THREAT TO THE SOUTHEASTERN UNITED STATES THIS WEEK...
"
https://www.nhc.noaa.gov/text/refresh/MIATCDAT4+shtml/050255.shtml
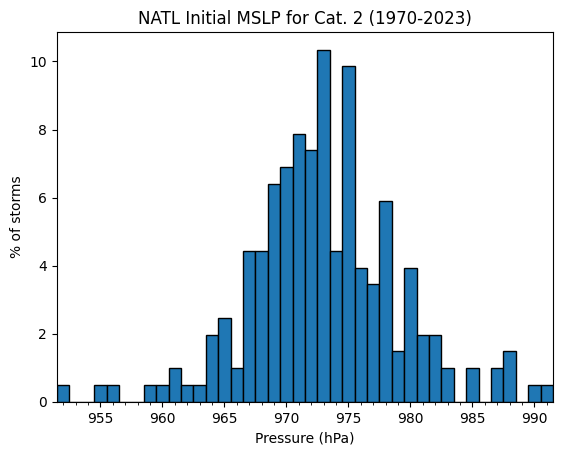
Climatology from my notebook for landfalling cat1,2 FL hurricanes >= 1970
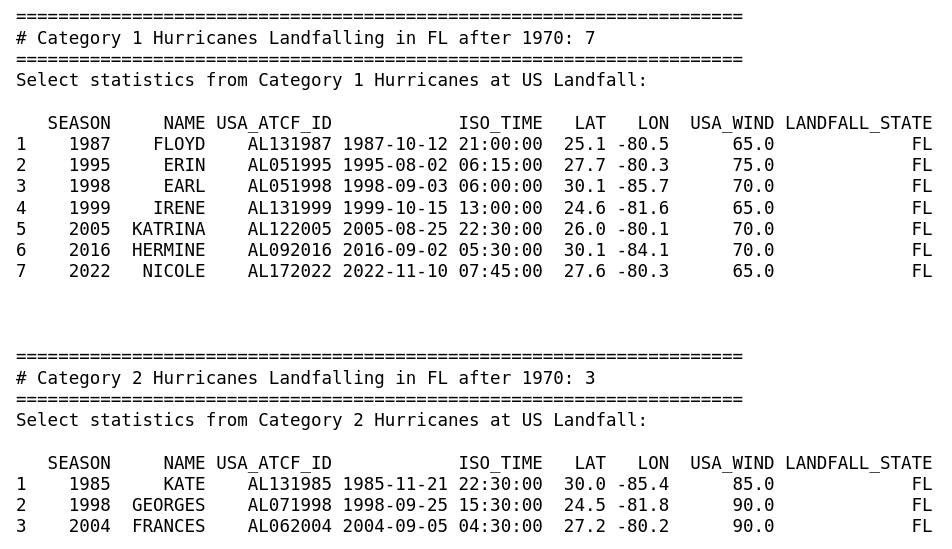
For cat. 2's:
Kate was the closest (in terms of curvature in GOM and landfall area) recent Cat. 2 analog: but it weakened to cat.2 in the GoM and landed further west.
(Georges was a stronger storm, landfalling in Key West as a Cat. 2 (it made several landfalls), Frances made it's first FL landfall on the east coast of FL as a Cat. 2)
For cat. 1's further west (might be missing a closer analog if they had multiple landfalls in FL), only looked at Hermine and Earl, and it looks like Hurricane Hermine is the closest by landfall area:
NHC 04L DEBBY 20240805 0600 292N 0837W 015 051 0981 1010 0278 36 037 0111 0222 0074 0111 D 0074 0130 -999 0056 72 321N 798W 0037 0037 -999 -999 Market has closed...
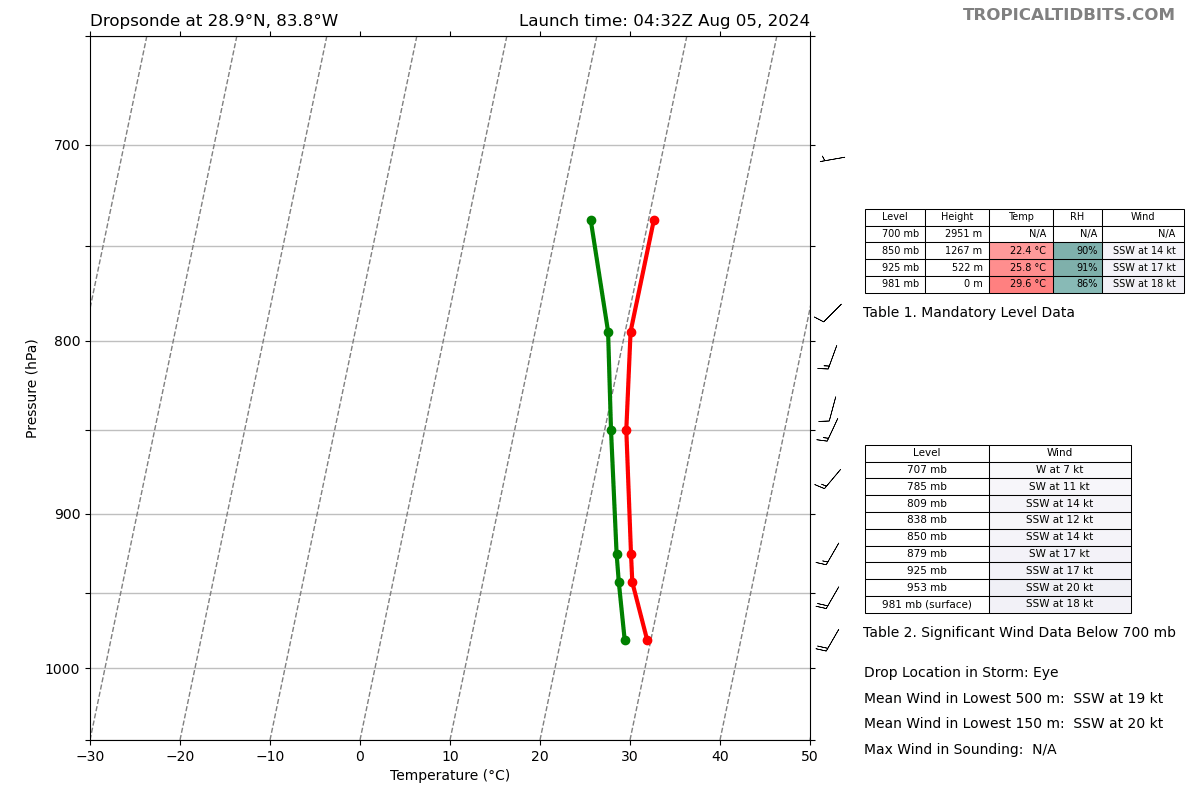
Latest tcvitals put it at 981 MSLP ( 70kt). Most recent dropsondes (3-4 hours ago) from support a bit lower (between 979 to 980 (a 1 mb reduction / 10kt at surface).
At 979mb, that puts it in the 85% percentile (85% of cat 2 storms were initially categorized at MSLP less than that):
Another hurricane hunter has launched that will likely be doing fixes until landfall... with a fix time near estimated landfall time):
       FLIGHT THREE - TEAL 71
       A. 05/0830Z,1130Z,1430Z
       B. AFXXX 0804A CYCLONE
       C. 05/0715Z
       D. 29.5N 83.9W
       E. 05/0800Z TO 05/1430Z
       F. SFC TO 10,000 FT (CORRECTION)
       G. FIX
H. WRA ACTIVATIONLooks like Debby is a hurricane now ... waiting on NHC to update officially once more recon comes in...
Latest recon supports a MSLP between 986 (extrapolated) and 988 (vortex data message): https://cyclonicwx.com/recon/mission/DEBBY_AF302_0704A/
TCVITALS has it 987 MSLP (tcvitals)
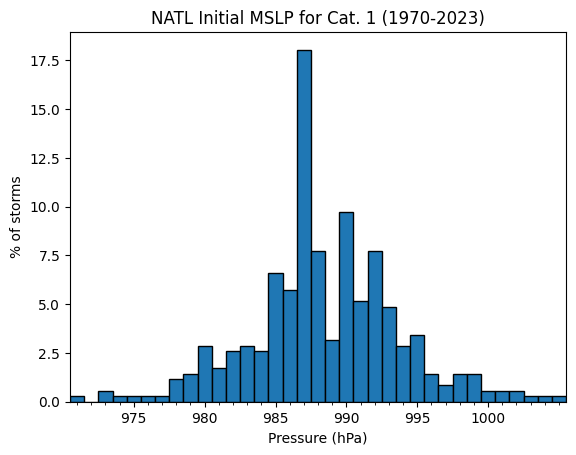
NHC 04L DEBBY 20240805 0000 282N 0840W 360 051 0987 1010 0278 31 056 0167 0222 0074 0111 D 0111 0130 -999 -999 72 319N 805W -999 -999 -999 -999 This puts it between the 24 to 48% percentiles for CAT1 NATL hurricanes in terms of pressures
At 987mb this is the 30% percentile, i.e. ~ 70% of storms were initially classified as hurricanes at pressures higher than this):
(Edit3: fixed plot.x axis =( )
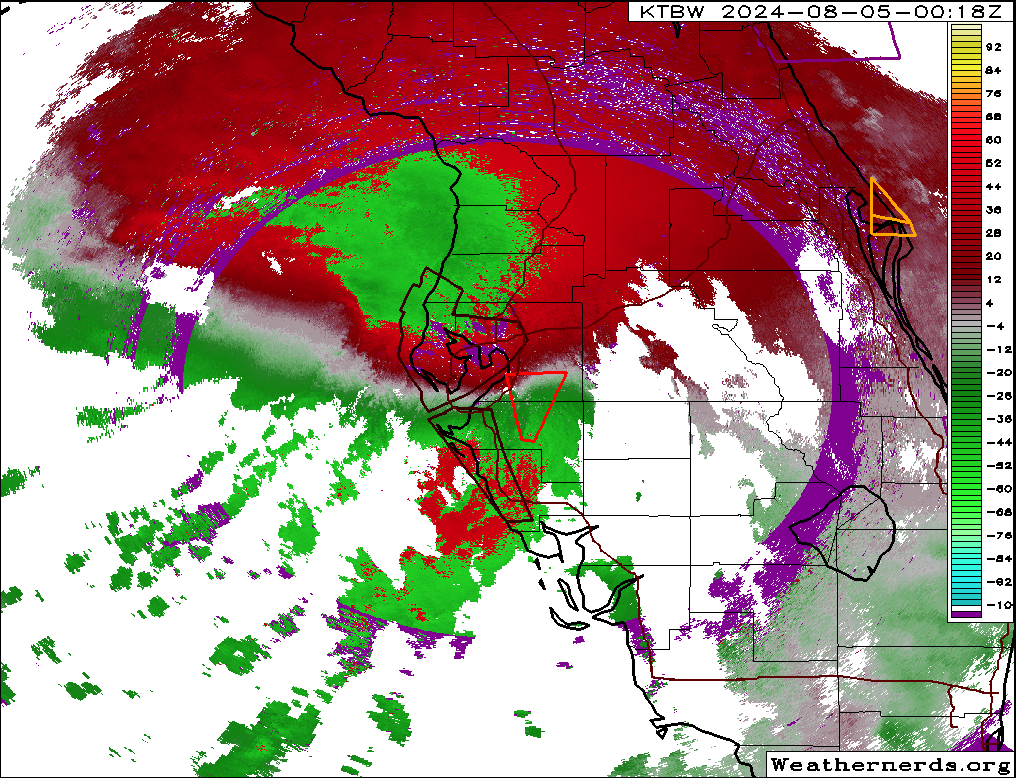
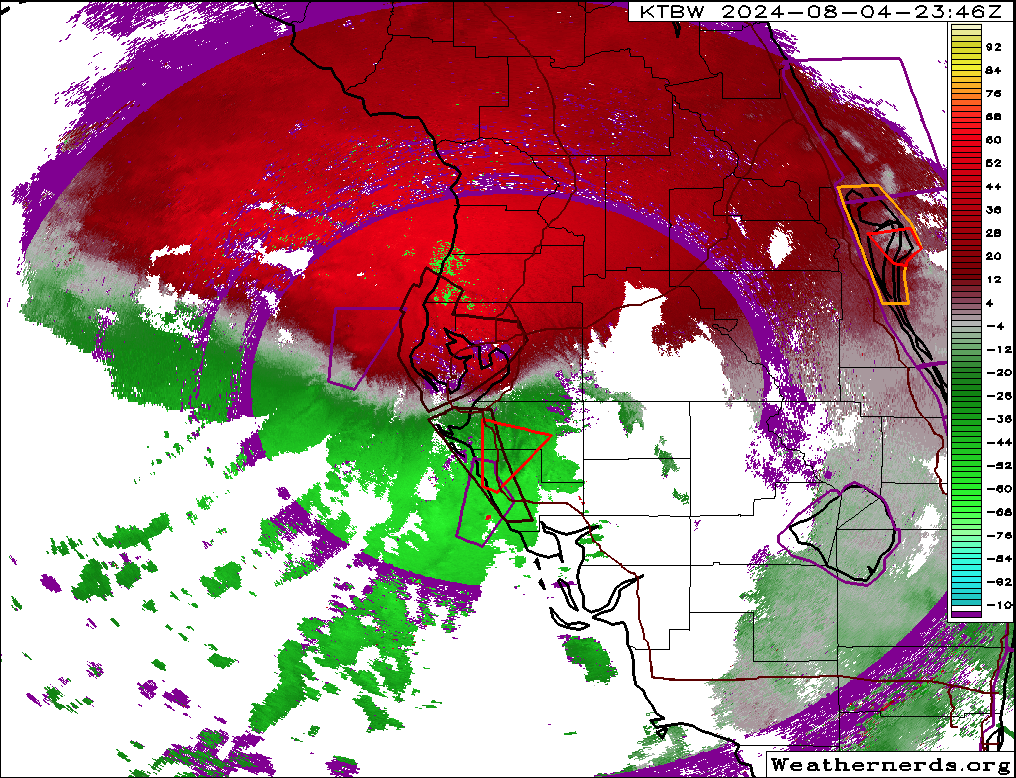
Also, it looks like a hurricane from radar:
004000 2811N 08253W 6959 03156 0069 +073 //// 186075 077 042 012 01
004030 2813N 08252W 6973 03141 0074 +073 //// 181073 075 036 014 01
004100 2815N 08251W 6968 03146 //// +075 //// 177072 075 032 020 01
004130 2818N 08251W 6975 03138 //// +071 //// 175071 072 031 024 01
Extrapolated 30s average flight level winds at 700mb (taking average over 2 mins) (from wind band east of storm center), and using standard 90% reduction:
0.9 * (75 + 73 + 72 + 71) / 4 ~= 65 kt
P(CAT 2)? ~21% relying on interpolating between data from HMNI and using SHIPS...
Most of the guidance doesn't show RI to anywhere near that, however...
The high end of the statistical model guidance from 18Z (DRCL) shows 75kt at 06Z hours before landfall, and 18Z hours after landfall (no 12Z point); interpolating, I estimate it's model landfall at 14Z giving it about 8 hours before landfall to strengthen from 75kt...
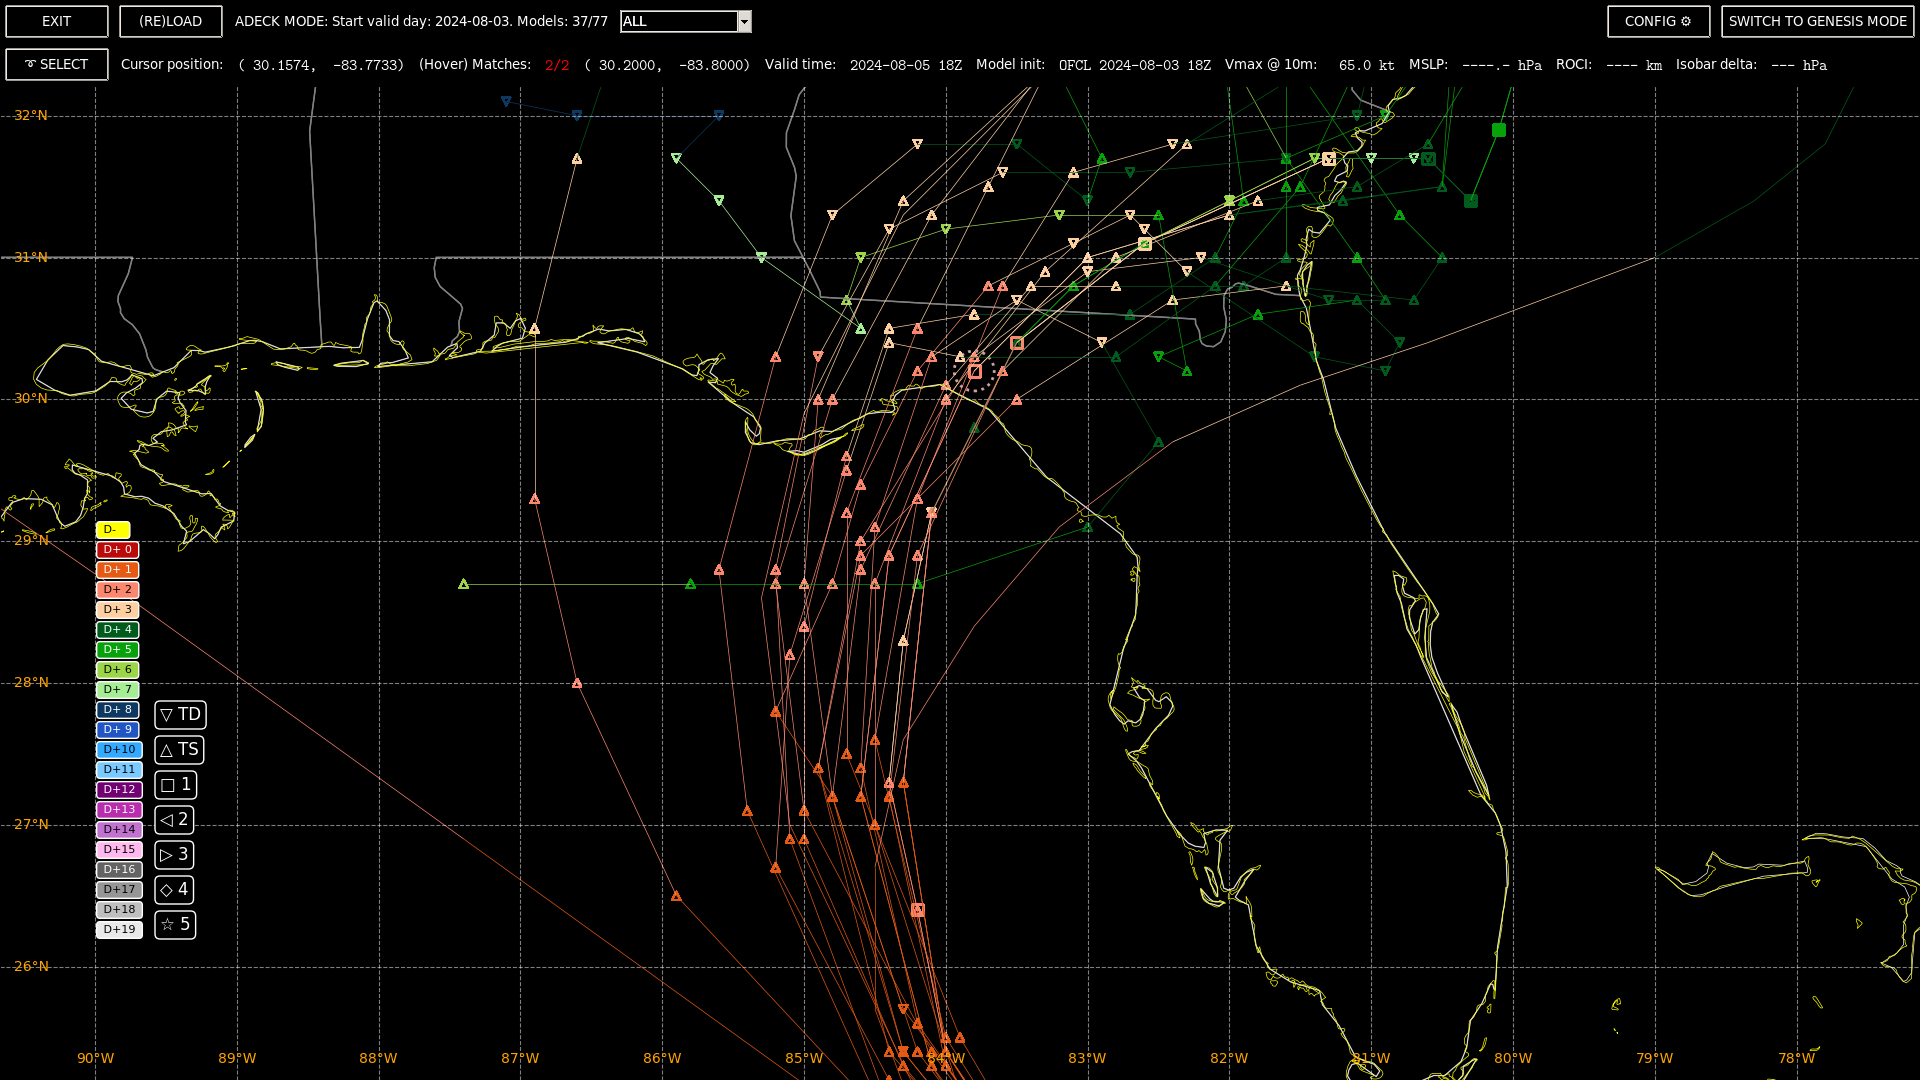
OFCL and early guidance from 18Z suggests landfall before 18Z tomorrow... but how much earlier is a question...
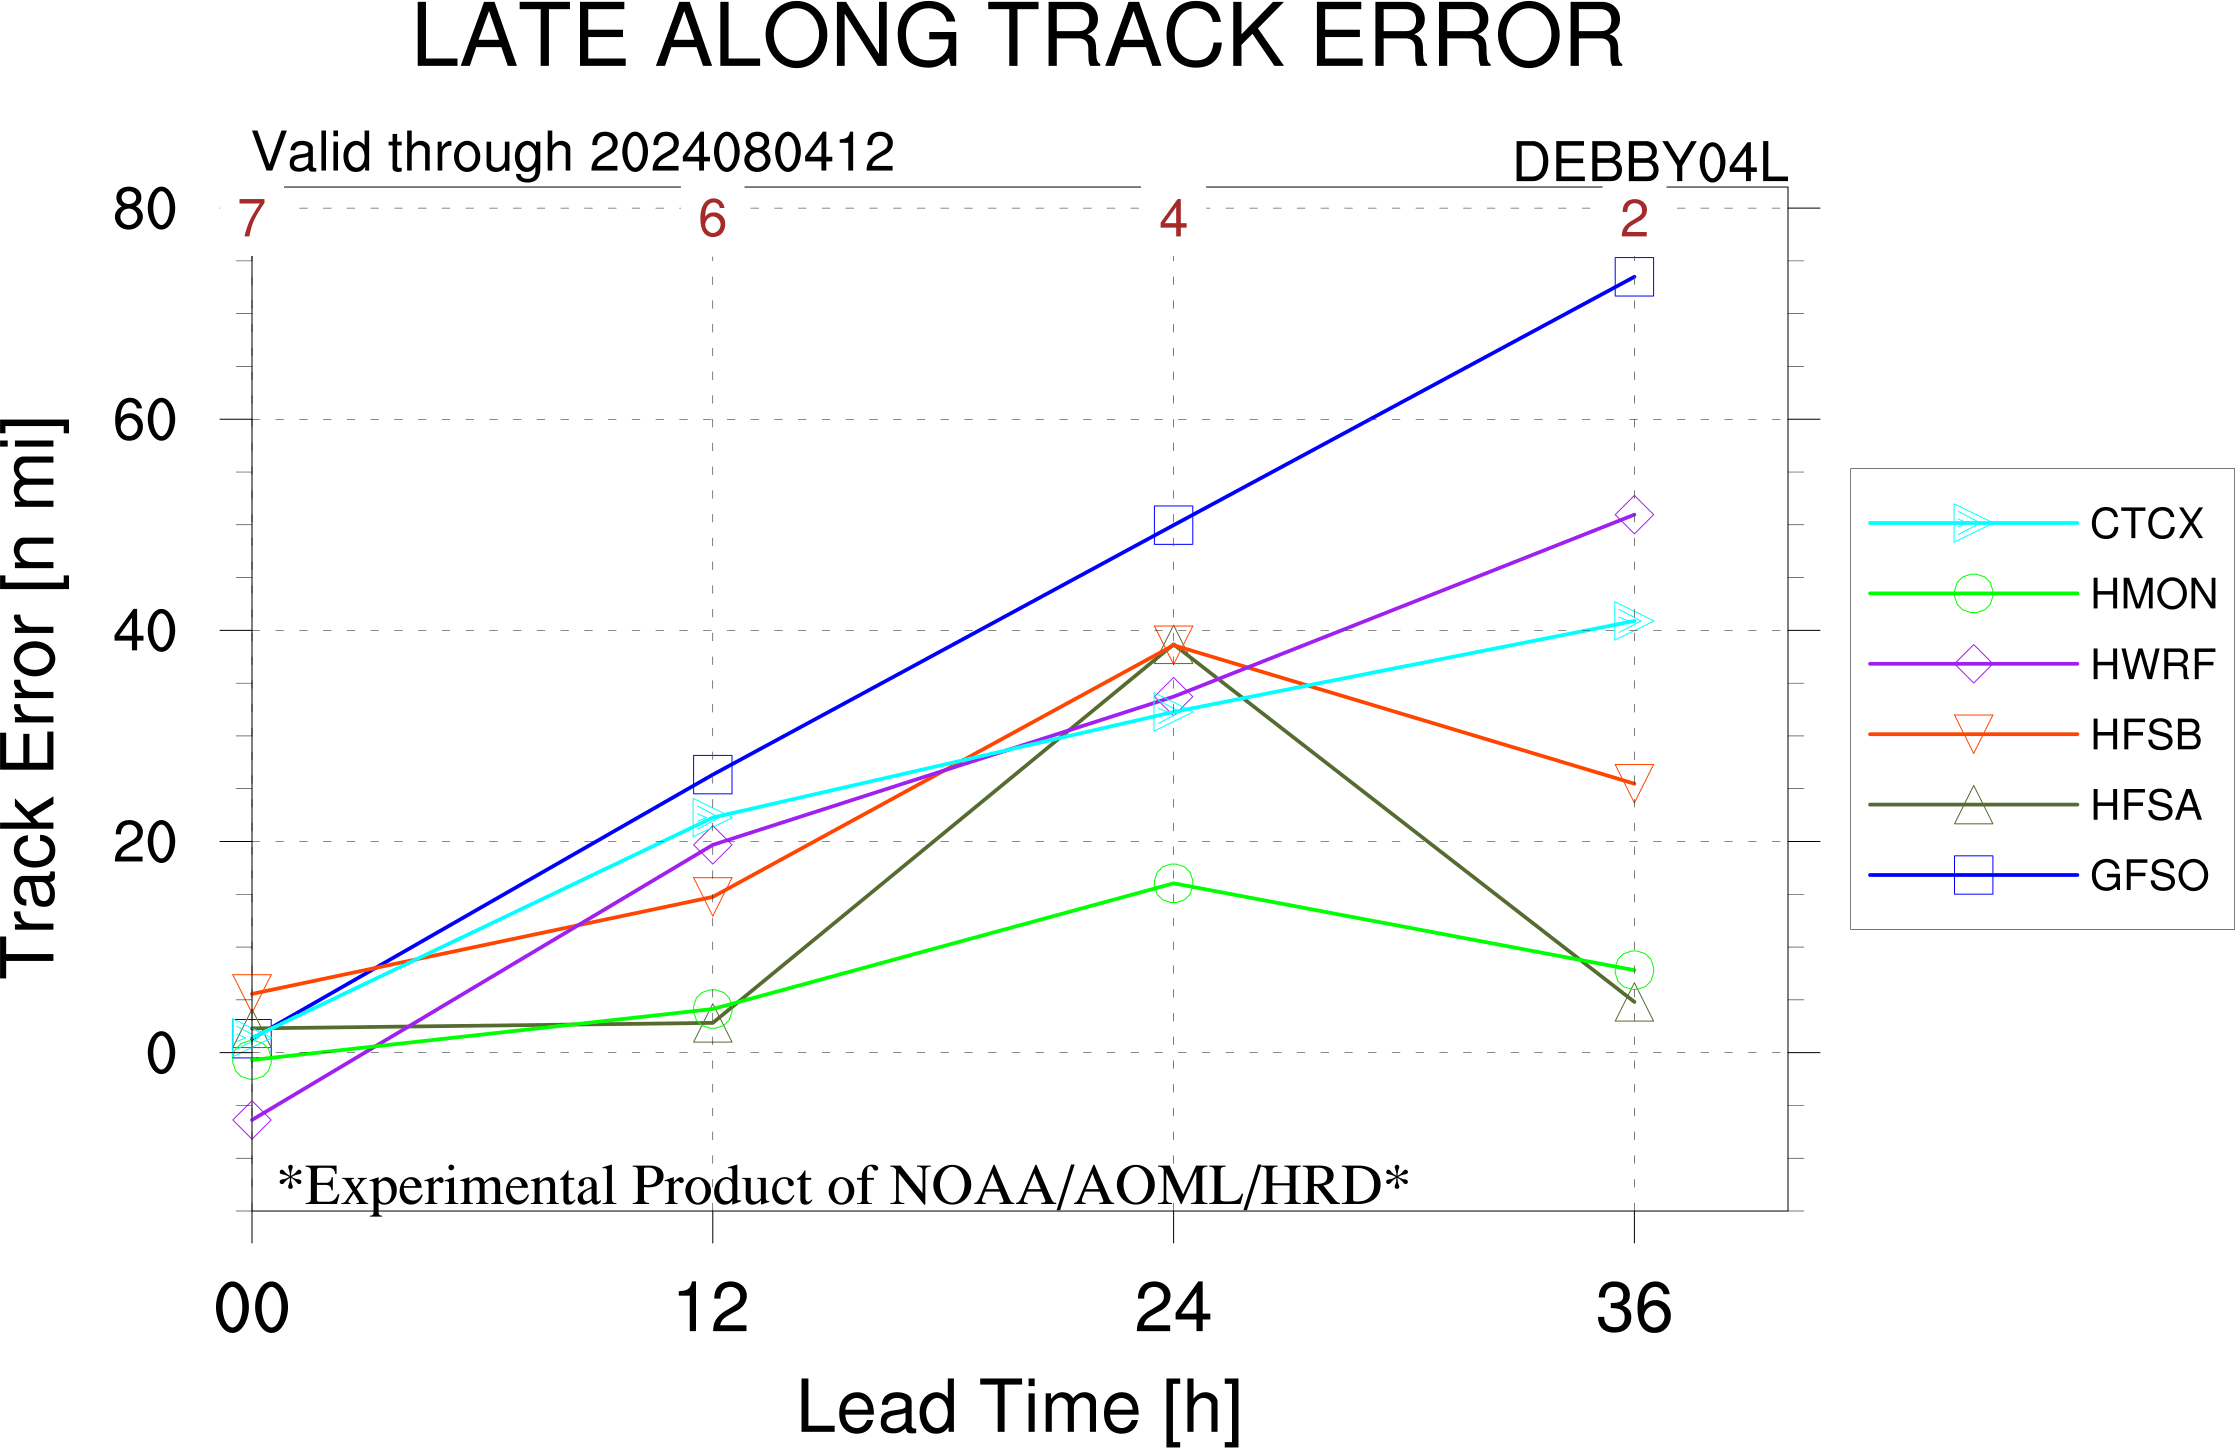
HMON looks to be the best for this question, considering it's Along Track error so far:
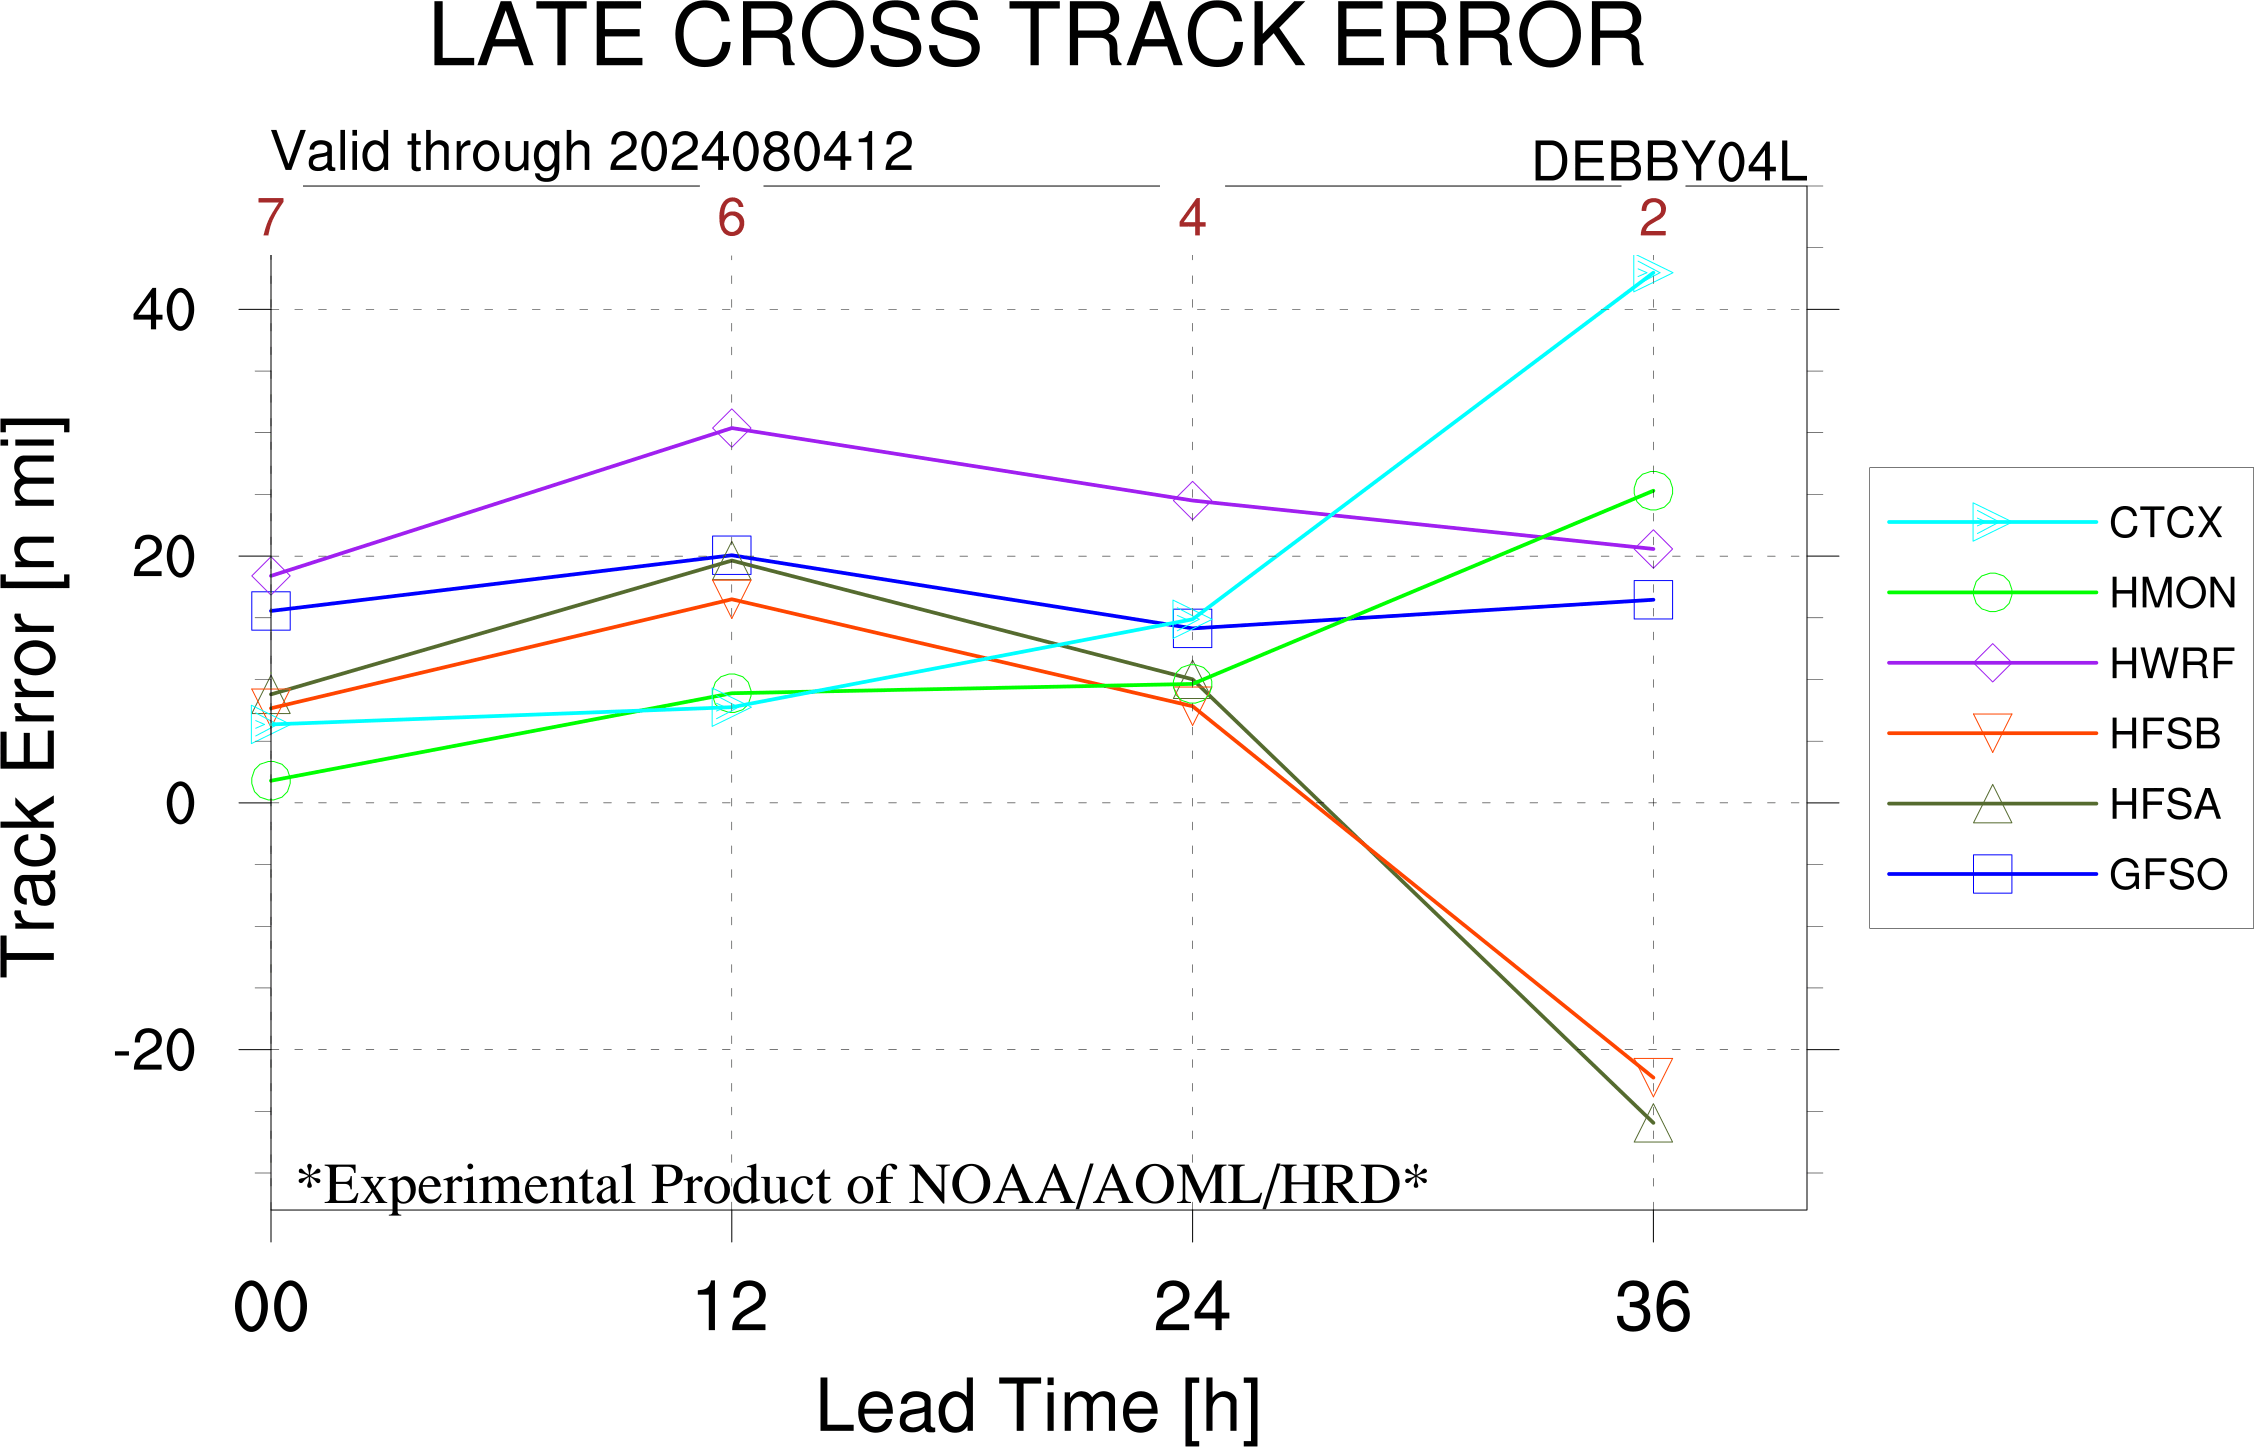
It's cross track error is also among the best 24 hours out also (which might affect where along the coast it hits, and as such the timing)
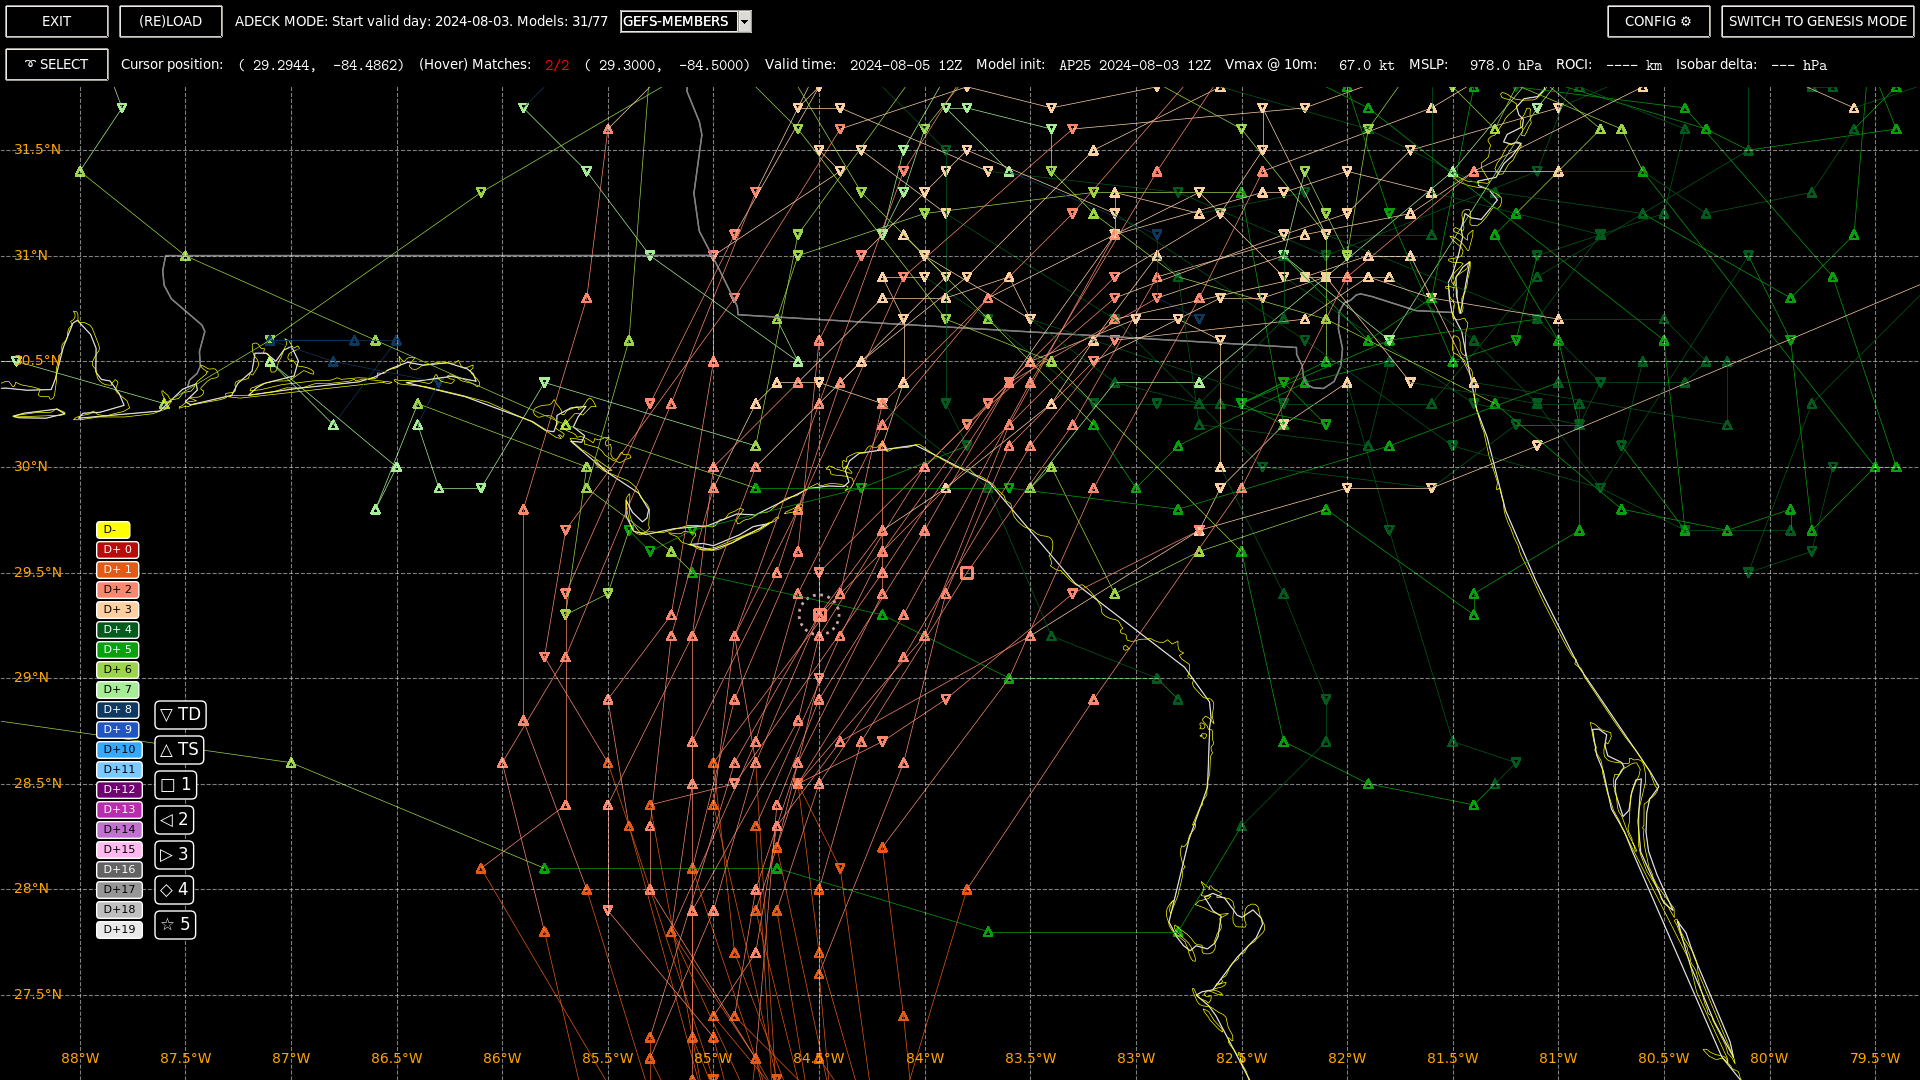
However, I only have the interpolated HMON (HMNI) to use as a reference for 18Z. Using HMNI, I get landfall also at about 14Z tomorrow ( 12 hours * (61.4 / 92.2 n.mi) ~= 8 hours after 06Z).
That gives it about 20 hours instead of the 24 used by SHIPS. What about Cat. 2 possibility? Most of the models (excluding the statistical ones which are at the high end (DRCL/SHIPS) are significantly lower, but there is also a problem of catching the peak intensity right before landfall...
Right now the OFCL guidance puts the current intensity at 55kt for 18Z today:
SHIPS 18Z:
SHIPS Prob RI for 20kt/ 12hr RI threshold= 7% is 1.5 times climatological mean ( 4.9%)
SHIPS Prob RI for 25kt/ 24hr RI threshold= 42% is 3.9 times climatological mean (10.9%)
SHIPS Prob RI for 30kt/ 24hr RI threshold= 27% is 4.0 times climatological mean ( 6.8%)
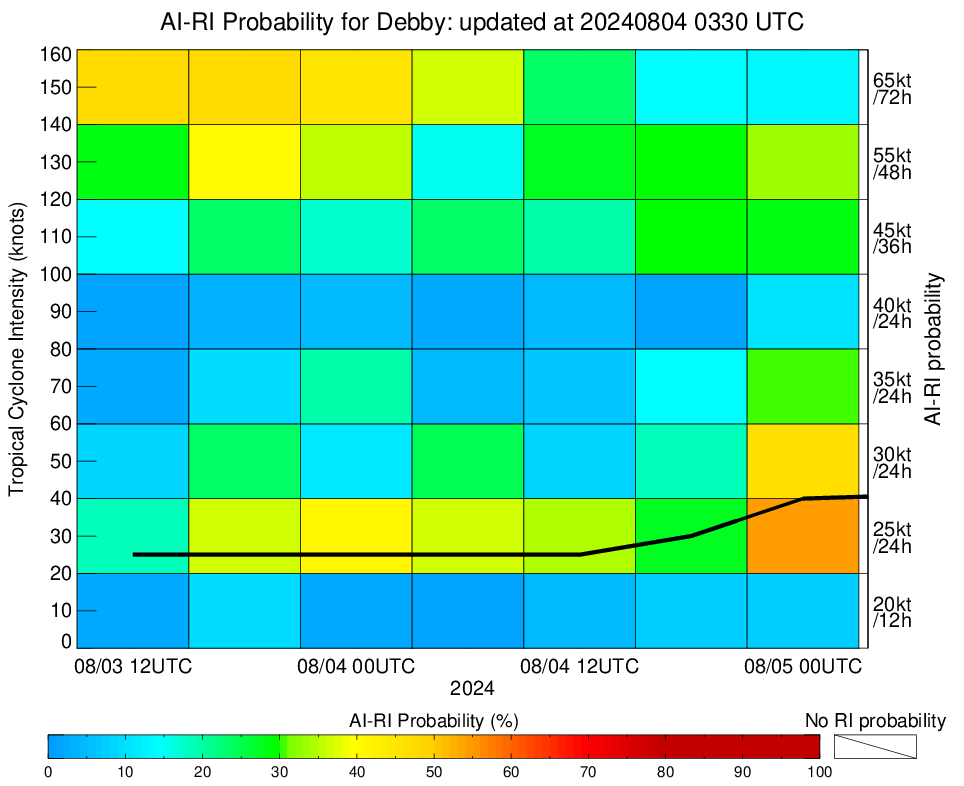
SHIPS Prob RI for 35kt/ 24hr RI threshold= 15% is 3.9 times climatological mean ( 3.9%)AI-RI probabilities for 18Z put RI 30/24 at 24%.
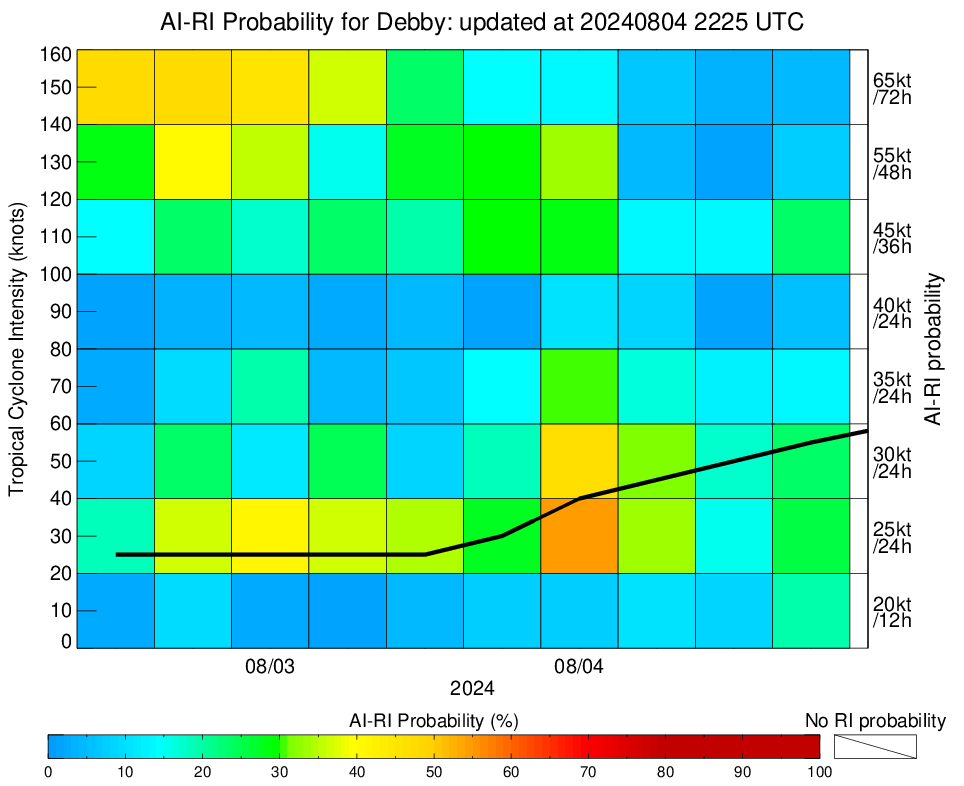
I take that to be then about a 25% of RI to cat 2 assuming we had a full 24 hours to RI.... Given we have 20 hours, I put that at ~ 21% (25% * (20/24)) for a cat 2.
Using the guess of the position from radar ().. (relative to HMNI's track)
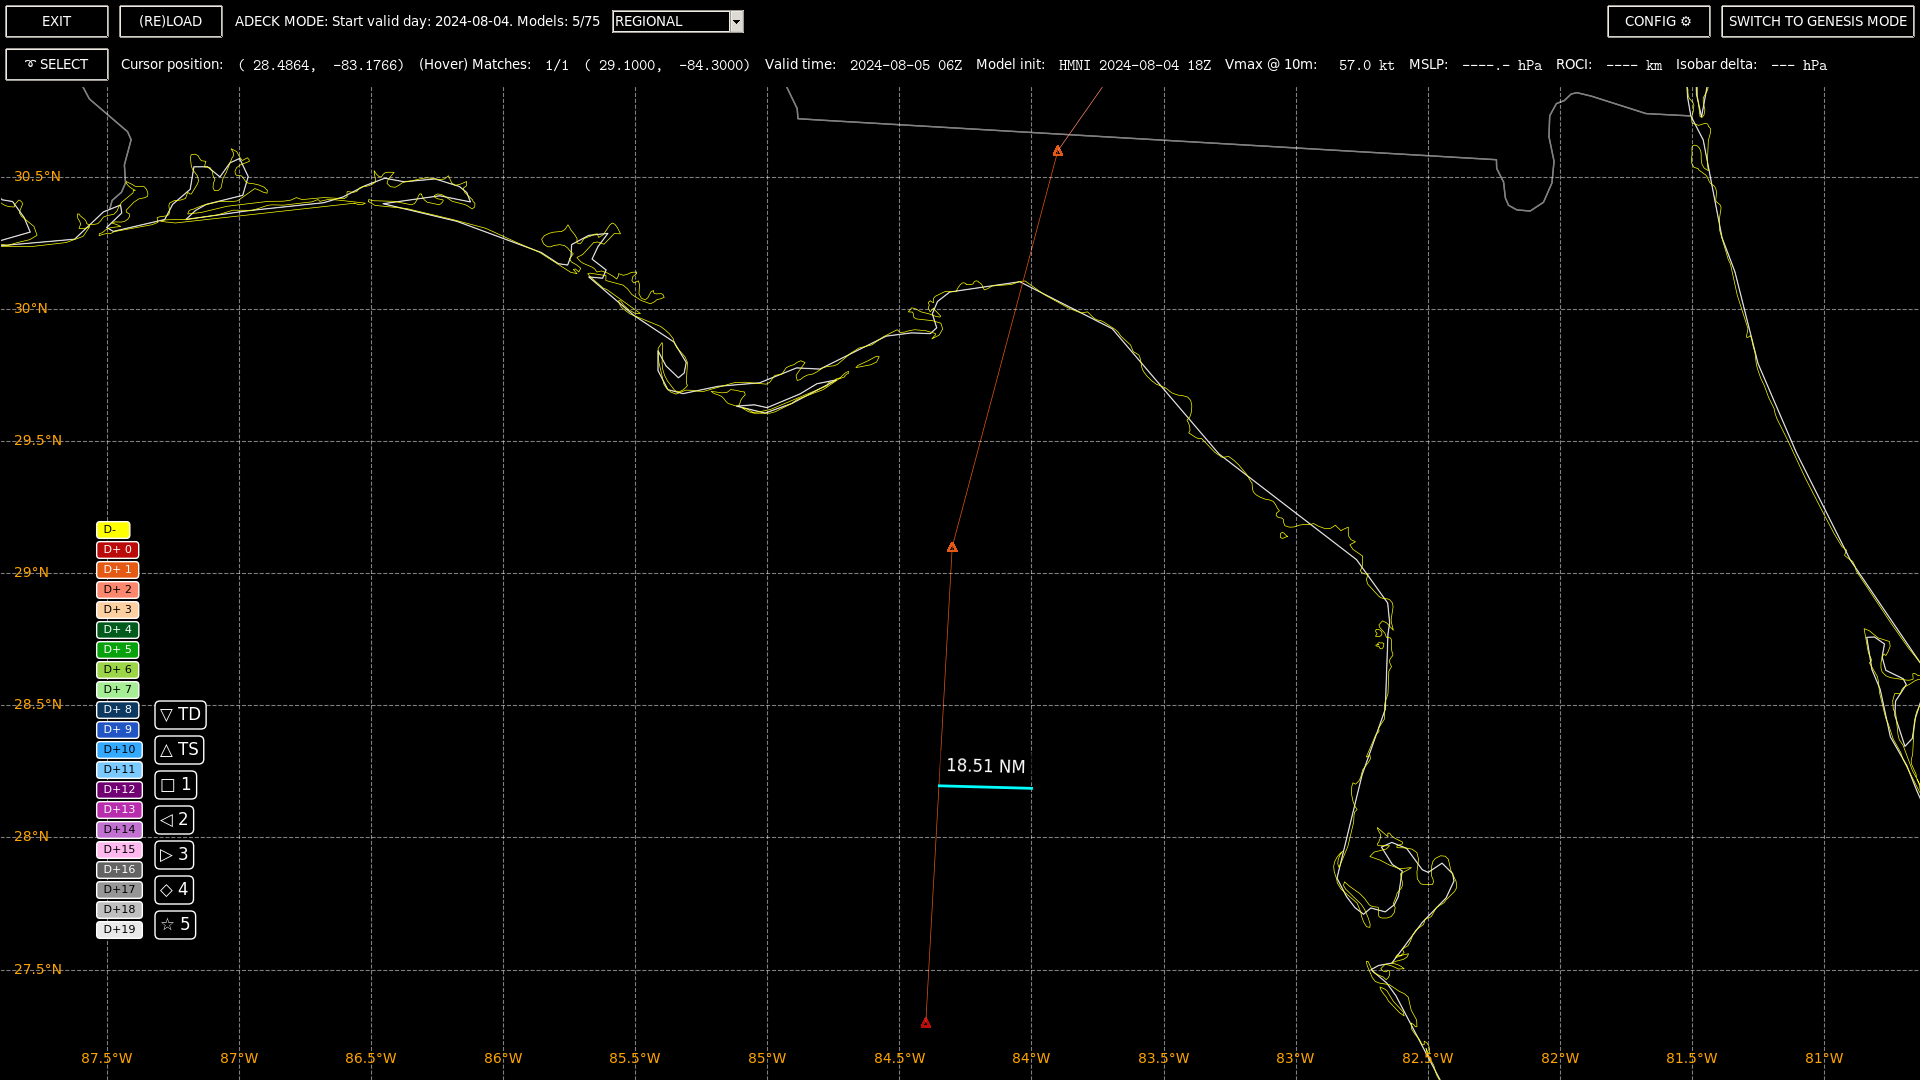
About 19 n. mi cross track error from HMNI/18Z at 23.5 Z
Along track
12 * 53.32 / (107.84) ~= about where it should be cross track along the model at 23.33 Z, it looks to be at ~ 23.77 Z (23:46 from radar)
This suggests an along track error presently of ((107.84) / 12) * (23.77 - 23.33) ~= 4 n.mi.
Checking HMNI's track, considering the cross-track error and the coast, this is small enough to match the along track error of when it will make landfall by about 4 n. mi, suggesting landfall before 14Z (~13.5 Z; 12 * ((61.4 -4) / 92.2) ).
Updating P(cat. 2) to ~ 20 % using previous analysis.
P(Cat. 2): Updating on SHIPS 00Z, and this time using latest OFCL track:
Latest OFCL puts landfall after 12Z (HMNI puts landfall at 12Z though), but its very close to the coast by then (9 n.mi) away (still around 13:30Z linearly extrapolating)
Now that it is at 65kt.... referencing the latest SHIPS from 00Z
SHIPS Prob RI for 20kt/ 12hr RI threshold= 16% is 3.3 times climatological mean ( 4.9%)This suggests a RI to cat.2 before landfall between 16% to 20% (last analysis), putting a middle percentage of 18% for RI to cat.2. This would require a 10 kt increase from OFCL in < 2 hours while it approaches the coast if OFCL track is correct for 12Z. For reference, (my calculation of) the chance of (OFCL advisory error) for it to reach cat. 2 is ~13% at 12Z if RI/12 does happen and it reaches 85kt at 12Z.