
The youth voter turnout rate is defined as the percentage of eligible voters aged 18-29 who cast ballots in the presidential election. The question will resolve to YES if the youth turnout rate is above 50% per CIRCLE at Tufts University based on the mid-point of the 2-week estimate (or whichever the latest), 2 weeks after the Election Day (November 5, 2024).
https://circle.tufts.edu/
 1,000
1,000🏅 Top traders
| # | Trader | Total profit |
|---|---|---|
| 1 | Ṁ768 | |
| 2 | Ṁ110 | |
| 3 | Ṁ63 | |
| 4 | Ṁ60 | |
| 5 | Ṁ47 |
People are also trading
Updated with data as of November 6, 5:00pm ET
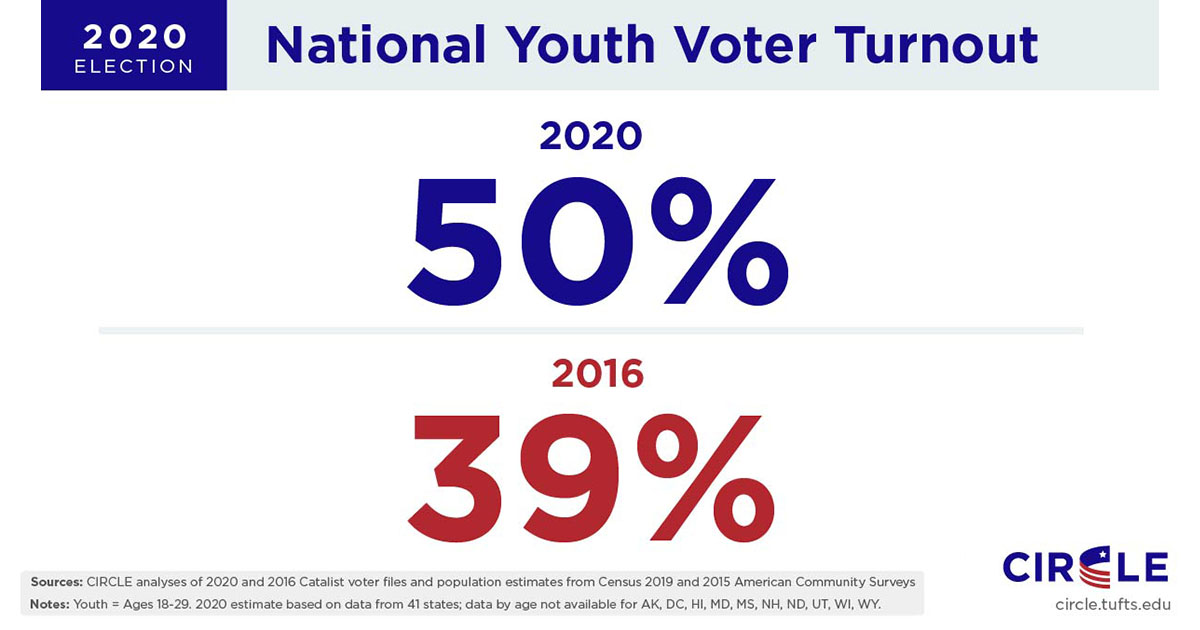
We estimate that 42% of young voters (+/- 1%), ages 18-29, cast ballots in the 2024 presidential election, a lower youth turnout than in 2020—when our early estimate put youth turnout above 50%—and approximately on par with the 2016 presidential election.
We also estimate that youth voter turnout in battleground states may have been much higher: 50% on aggregate in Arizona, Georgia, Michigan, Nevada, North Carolina, Pennsylvania, and Wisconsin.
Young voters cast 14% of all ballots in the 2024 election, according to the National Election Pool exit poll conducted by Edison Research. While this number may be adjusted in the coming days, and other data sources may show different numbers, this 2024 youth share of the vote was also lower than in 2020 (17%) and to 2016 (19%) based on the sane data source.
Will be resolved by November 19.
https://circle.tufts.edu/2024-election-youth-poll
Tufts' newest analysis:
57% Extremely Likely to Vote
57% of youth, ages 18-34, say they’re “extremely likely” to vote in 2024, and another 15% say they’re “fairly likely” to cast a ballot in the election.
https://www.npr.org/2023/09/22/1201183160/taylor-swift-instagram-voter-registration
Somewhat relevant news.

To traders: In case the turnout rate falls precisely on 50%, how do you think it should be resolved?
A. Resolve as YES (inclusive of 50%)
B. Resolve as N/A (boundary case)
C. Resolve as NO (technically not 'above 50%')
D. Resolve to Prob%
(reserved)
@SarkanyVar What about resolve to Prob%, to the percentage of the estimated range from CIRCLE above 50%?
@adele That is a good suggestion too. I suppose I can do that too in the boundary case.
I would still lean towards resolving to YES or NO otherwise because participation by at least half of the demographics is an important barometer, and so I would want the resolving of the market to reflect so.
If other traders agree with resolving to Prob% in case of 50%, please feel free to like @adele's comment.
@SarkanyVar I'd honestly be so surprised at the boundary case happening I'd want it to be N/A out of respect. It gives "flipped a coin and landed on its edge" energy.
@AndrewQuinn Curiously, that's exactly where the latest report for the 2020 election, released almost half a year after the election, landed on.
https://circle.tufts.edu/latest-research/half-youth-voted-2020-11-point-increase-2016
Given rounding, it is not exactly implausible. Still, I plan to use the two-week estimate instead of the figure in a final report (if any) for resolving the market because the latter's release date seems to be less regular. Food for thought though!
@RahulShah You may see below for the historical estimates at that time point from CIRCLE at Tufts. https://circle.tufts.edu/latest-research/election-week-2020
So by the criterion set out above, the 2016 youth voter turnout estimate would be 43% (the mean of 42% and 44%) and the 2020 youth voter turnout estimate would be 53.5%.
Note that the estimates had sometimes seen adjustments months after the point, when CIRCLE published their formal reports later. But for the sake of timeliness, I would stick with the two-week estimates as a reasonably accurate indicator for turnout.
For data before 2016, perhaps you may refer to this graph below:
https://www.statista.com/statistics/984745/youth-voter-turnout-presidential-elections-us/
Note that it seems to be taking the CIRCLE data and using the upper estimates, at least for the 2016 and 2020 data. I think using the mid-points would lead to fairer estimates. But the graph in general can serve as a reference to historical trends.