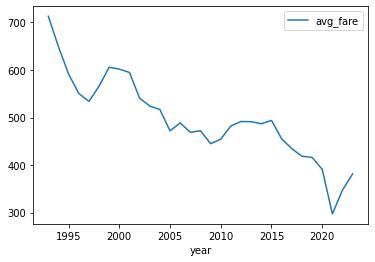
For every quarter, the Bureau of Transportation Statistics (BTS) publishes very detailed statistics on the cost of flights between a wide variety of US cities. They even inflation adjust historical prices to the current quarter!
At the very bottom of their table, they have a row "National Average".
Once the 2028 Q1 statistics are released, I will calculate the percentage increase in fare prices (((2023Q1AverageFare-2028Q1AverageFare)/2023Q1AverageFare)*100).
This market will resolve YES if the inflation adjusted national average fare in 2028Q1 (2023Q1AverageFare) is more than 33 percent higher than the inflation adjusted national average fare in 2023Q1 (2023Q1AverageFare) (e.g. if the result of the above calculation is 33 or higher). Else, it will resolve no.
If the BTS no longer releases the above statistics (or similar), this market will resolve N/A. If other edge cases come up, I will use my best judgment to resolve. Please feel free to bring them up prior to betting!
People are also trading
One of the things to note about this dataset is that the BTS doesn't seem to be doing a simple average. Rather, they are doing a weighted average by passenger count. (Specifically, they are weighting it by 2022 passengers, regardless of year.) An airport like LAX has about twice as much influence as an airport like JFK.
I downloaded the data for Q1 of each year going back to 1993, and joined it all into one file. Column explanation:
year, code: this is the year and airport code that the data was collected. If code == "National Average" then this is the average for all airports.
avg_fare: This is the average fare at that airport.
avg_fare_no_inflation_adjustment: this is the fare at that airport WITHOUT INFLATION ADJUSTMENT. The market resolves in INFLATION ADJUSTED TERMS.
passenger_count_2022_10_percent_sample: this is 10% of the passenger count in 2022. This is used in BTS's weighting.
Using this data, you could probably do a more sophisticated analysis, or analyze each airport separately. I have not done this, besides noting "line go down."
Raw data here: https://pastebin.com/h54cJ5Pn
@RobertCousineau I thought that was the more likely interpretation, but I wanted to check. One way you could make this more clear is to define the term 2023Q1AverageFare and the term 2028Q1AverageFare.
@RobertCousineau Btw, this was the podcast episode that motivated the market idea:
Money Talks from The Economist: Money Talks: Will green flying take off? on Apple Podcasts
They predicted that attempts to reduce emissions will make flying more expensive, so I was wondering if we'll see that.
@Charlie Interesting - that is certainly some counterintuitive economics to me (barring regulation that says only green flying is legal).

