
This is a market in a series on markets for possible quantified self experiments I might run.
Context here, in short: I will put up >10 of these markets, run the "best" one (my own judgment, but probably just the one with the highest expected Cohen's d), and a random one (resolving them to the outcome), and will resolve all the others as N/A. In all experiments, I will be using the statistical method detailed here, code for it here.
This trial will not be blinded. As such, even though I try to not form an opinion on its outcome, all kinds of subconscious biases might creep in. Sorry for this confounder while forecasting.
50 samples, 25 intervention (eating only between 18:00 and midnight), 25 non-intervention (normal diet), chosen randomly via echo -e "fast\ndon't fast" | shuf | tail -1. Expected duration of the trial: ~2 months.
In general, I measure happiness by randomly experience sampling using MoodPatterns (more info here).
Past happiness data can be found here.
 1,000
1,000People are also trading
@CelebratedWhale Sure! Sorry for not being more detailed beforehand.
In statistics, if you have an experimental group (in this case the days with intermittent fasting) and a control group (days without intermittent fasting) you get two sets of measurements. Cohen's d measures how different these two sets of measurements are from each other, in terms of the difference of their means, measured by their variance. This image (from this article) attempts to illustrate the concept:
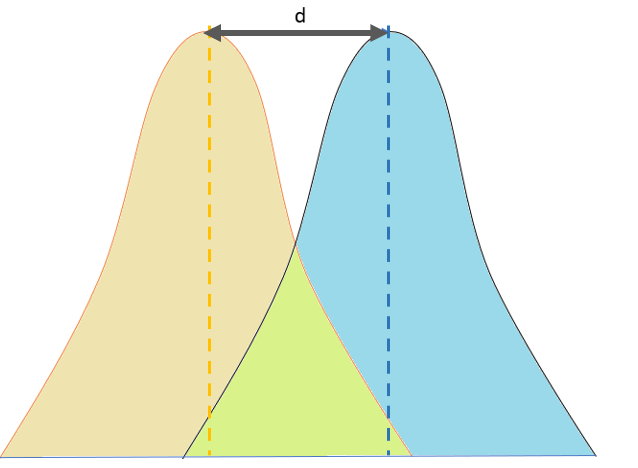
Wikipedia states that effect sizes up to 0.2 are small, up to 0.5 are medium, up to 0.8 are large, and so on.
Hope this helps!