Rough criteria:
W%
If tied, favors team with closer games and wins earlier in the series. Not exactly pt differential but similar
Update 2025-05-05 (PST) (AI summary of creator comment): Based on creator comments, tie-breakers (when W% is equal) will consider the leverage of games won:
Wins in high-leverage situations (e.g., early in the series to take a lead) are valued more.
Wins in low-leverage situations (e.g., a blowout win when already down 3-0) are considered less meaningful.
Example given: A team going up 2-0 then losing 4 straight might be considered to have performed better in the tie-breaker than a team that won games 4 and 5 after being down significantly early in the series.
Update 2025-05-05 (PST) (AI summary of creator comment): The creator has provided specific numerical values for leverage to quantify the tie-breaker when W% is equal. These values are based on the game number and the series score at the time (assuming each game is initially 50/50):
Game 1: 0.3125
Game 2: 0.3125
Game 3: 0.375 (if series is 1-1), 0.25 (if series is 2-0 or 0-2)
Game 4: 0.375 (if series is 2-1 or 1-2), 0.125 (if series is 3-0 or 0-3)
Game 5: 0.5 (if series is 2-2), 0.25 (otherwise, i.e., 3-1 or 1-3)
Game 6: 0.5
Game 7: 1.0
The creator also noted that point differential is intentionally avoided partly because it can be misleading due to garbage time.
Update 2025-05-11 (PST) (AI summary of creator comment): Further clarification on tie-breakers when W% is equal:
The assessment of which team had 'closer games' will focus on how close the closest individual games of their respective series were.
This approach is analogous to considering a 'tipping point margin' or 'median point differential' of games, rather than an overall average point differential (mean point differential).
The point differentials of individual games will be directly relevant in this comparison to determine which team's series featured closer contests.
Additionally, qualitative aspects, such as the context of a win (e.g., a road win, or a win in a perceived must-win situation that might offer nuance beyond the pre-defined leverage scores), may be considered in the overall evaluation of which team performed better in the tie-breaker.
Update 2025-05-11 (PST) (AI summary of creator comment): Further details on evaluating the 'closer games' aspect of the tie-breaker (when W% is equal):
When assessing which series featured 'closer games', the point differentials in very large blowout wins are considered negligible. For example, the difference between a 22-point win and a 43-point win is not significant for this criterion if both games were decided early and non-competitive.
The focus is on the point differential in games that were genuinely close contests.
The determination of a game's 'closeness' will include qualitative judgment of its competitiveness, not solely the final point differential.
For example, a 9-point overtime (OT) win might be considered to represent a 'closer' or more significant contest than a 3-point win achieved in a game that was not competitive throughout (i.e., 'never close' despite the small final margin).
Update 2025-05-11 (PST) (AI summary of creator comment): When W% is tied, the creator has provided further details on tie-breaking considerations:
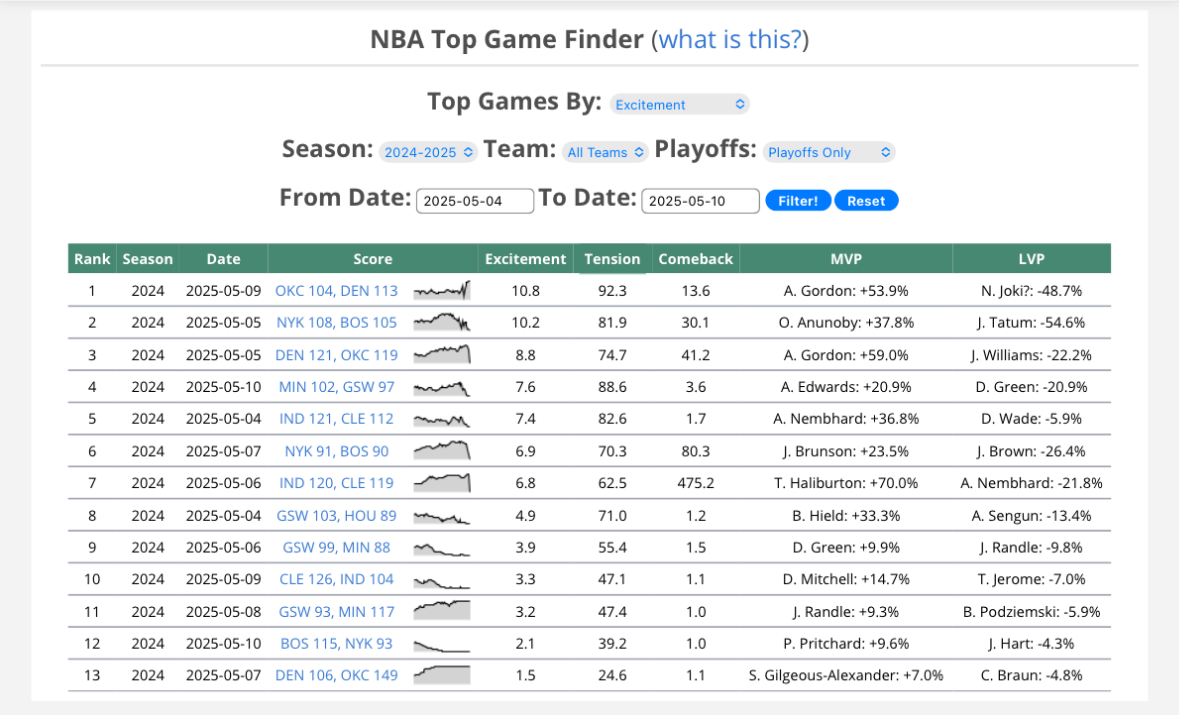
The creator may use the Excitement metric from
stats.inpredictable.com(which sums swings in win probability) as one source to measure how close a game was, particularly when ignoring garbage time.Average excitement from the games in each series may be considered as one of the factors.
The creator provided an illustrative example of a hypothetical multi-factor comparison that would be undertaken if W% were tied. This example included weighing:
Average point differential
Average excitement
Median point differential (and median point differential in regulation)
Order of wins (which relates to leverage and wins earlier in the series)
The creator noted that it can be hard to exactly specify all criteria beforehand. If, after considering these multiple factors, the assessment between the two teams remains too close to call, the market might resolve to 50/50.
 1,000
1,000🏅 Top traders
| # | Trader | Total profit |
|---|---|---|
| 1 | Ṁ69 | |
| 2 | Ṁ18 | |
| 3 | Ṁ16 | |
| 4 | Ṁ10 | |
| 5 | Ṁ8 |
People are also trading
@bens to weigh high leverage games higher.
A game 4 blowout win down 3-0 is relatively meaningless.
If the Knicks go up 2-0 then lose 4 straight, that's a closer series than if the Nuggets won games 4 and 5.
@ChinmayTheMathGuy also pt differential can be misleading due to garbage time.
To understand leverage if we assume every game is 50/50, the average game has leverage of 0.3125 but a game 7 has a leverage of 1.
Game 1: 0.3125
Game 2: 0.3125
Game 3: 0.25 if 2-0 or 0-2, 0.375 if 1-1
Game 4: 0.125 if 3-0 or 0-3, 0.375 if 2-1 or 1-2
Game 5: 0.5 if 2-2, 0.25 otherwise
Game 6: 0.5
Game 7: 1
@bens if the 2nd criteria was point differential,
It could contradict the primary criteria of W% (agrees with your "a game is a game" statement)
Now both series are 2-1. pt differential (-18 vs -32) would make this resolve to NYK,
but it's not that clear in my opinion since BOS's blowout game 3 win was arguably just as good (if not better since it was on the road and a must win to avoid down 0-3 vs now ~73% favs to win series) than OKCs 43 pt win in game 2 and games 1 and 2 were closer in the Knicks Celtics series than games 1 and 3 in DEN/NYK.
Anyways to summarize, we agree that W% is the most important criteria, the reason I didn't want pt diff as the 2nd criteria is because not all pts are equal.
As an analogy if we're comparing this to the US election (e.g. was 2016 or 2020 closer), Electoral College is the primary criteria but pt differential is more analagous to popular vote whereas this market is more similar to tipping point margin (median pt differential rather than mean pt differential) since we care about how close the closest games were.
e.g. if I created a market on if Trump would win the 2024 election by a larger margin than Biden did in 2020,
I'd care more about the margin of the 7 swing states (93 EVs but higher leverage) rather than NY, CA, FL, TX (150+ EVS but lower leverage)
Similarly, I care more about the pt differential in close games that could swing the series result.
The difference between a 43 pt win and 22 pt win (both over at half time) is neglible compared to the difference between
a 3 pt win that was never close and a 9 pt OT win.
for reference, one source I use to measure how close a game was (ignoring garbage time) is the Excitement metric which sums the swings in win probability.
It's hard to exactly specify the criteria beforehand, so if I had this resolve this market through 3 games it'd probably resolve to 50/50
since
W% = tie (both 66.7)
avg. pt diff = NYK (-6 vs -10.7)
avg. excitement = DEN/OKC higher (7.0 vs 6.4) => closer series => NYK
median pt diff: DEN (2 vs 1), essentially tied
median pt diff (regulation): tied (0)
order of wins (more relevant if it was best of 3): NYK since they reached 2 wins after 2 games vs 3 games for DEN
Still 2-4 games to go, and this is only relevant if both series end with the same score.
Hope that clarifies how this market resolves.