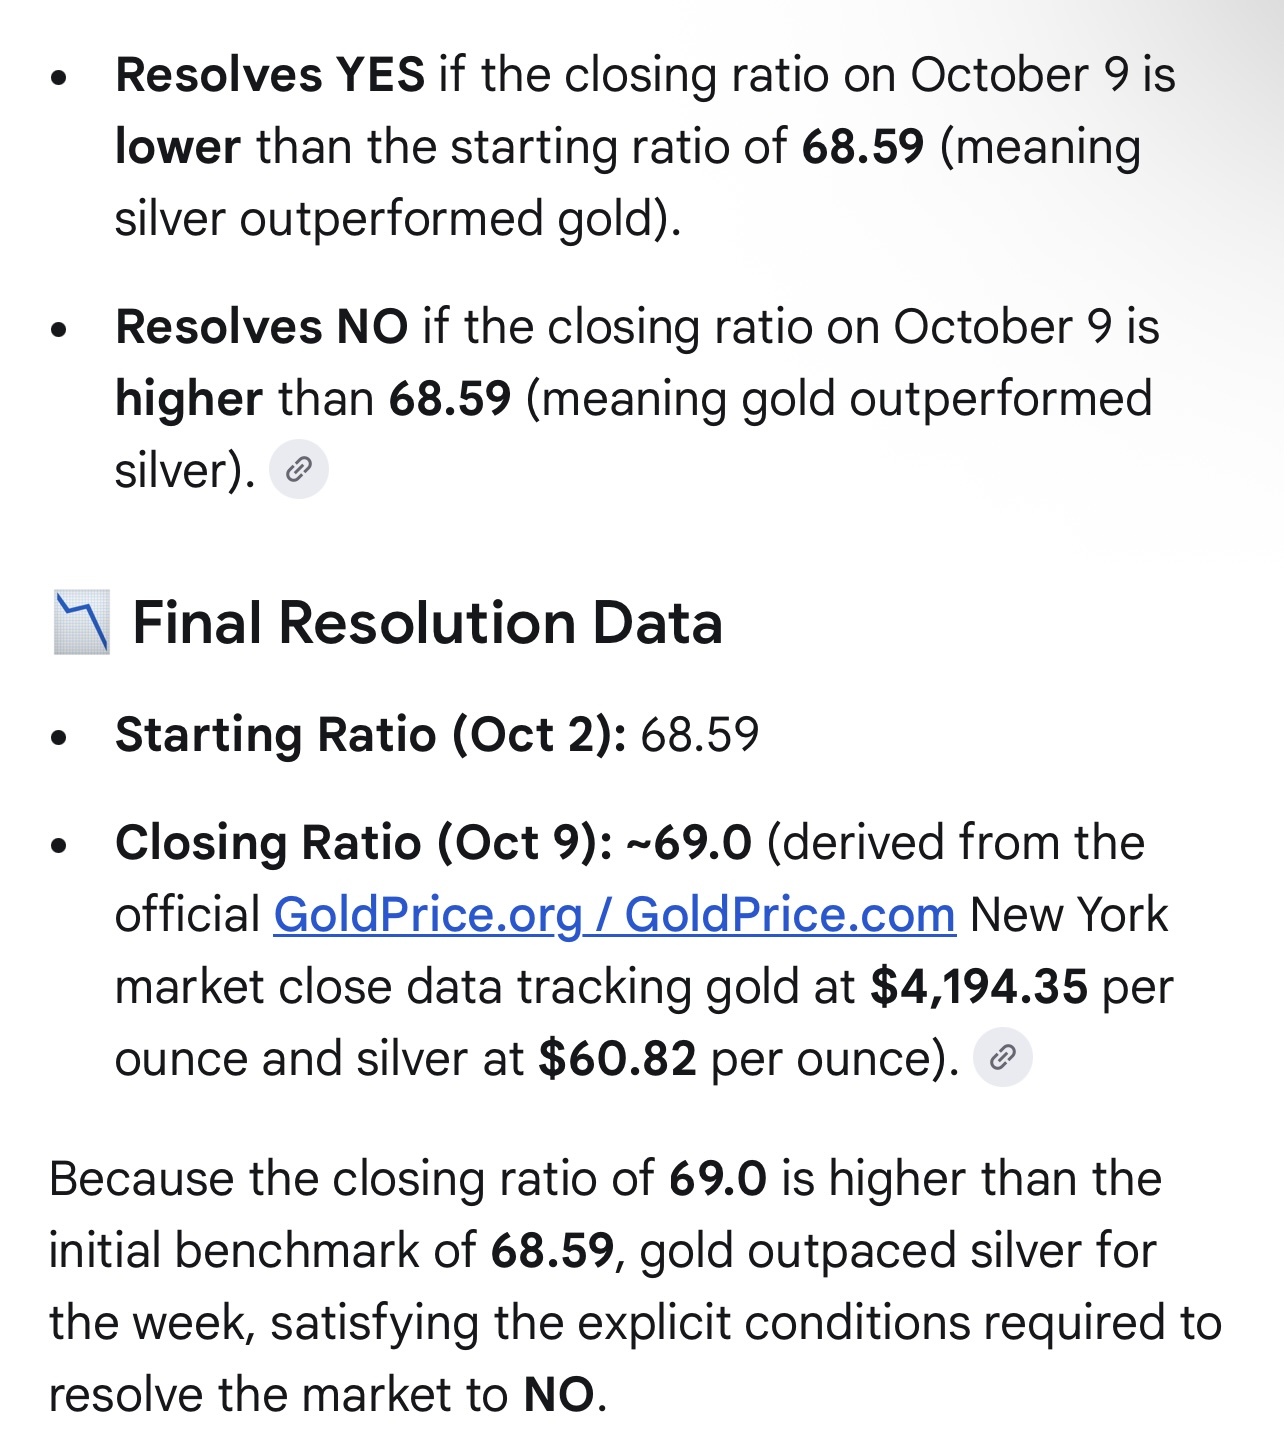
This market compares the gold-to-silver price ratio at the weekly close on Friday, October 2, 2026, with the weekly close on Friday, October 9, 2026.
Starting gold-to-silver ratio: approximately 68.59.
Resolves YES if the ratio shown by GoldPrice.org after the September 18 New York market close is lower than the September 11 closing ratio. A lower ratio means silver increased more—or declined less—than gold.
Resolves NO if the ratio is higher, meaning gold outperformed silver.
If the two ratios are identical when rounded to two decimal places, the market resolves 50%.
GoldPrice.org’s historical closing data will control if another source displays a different price.
Resolution criteria
This market compares the gold-to-silver price ratio at the weekly close on Friday, October 2, 2026, with the weekly close on Friday, October 9, 2026.
Resolves YES if the gold-to-silver ratio shown by GoldPrice.org after the Friday, October 9, 2026 New York market close is lower than the Friday, October 2, 2026 closing ratio. (A lower ratio means silver outperformed gold, either by increasing more or declining less.)
Resolves NO if the October 9, 2026 closing ratio is higher than the October 2, 2026 closing ratio. (A higher ratio means gold outperformed silver.)
Resolves 50% if the two ratios are identical when rounded to two decimal places.
The closing gold-to-silver ratios will be determined using historical data hosted on GoldPrice.org, which will control if other sources display conflicting prices. For reference, the closing ratio on Friday, October 2, 2026, was approximately 68.39.
Background
The gold-to-silver ratio is calculated by dividing the spot price of an ounce of gold by the spot price of an ounce of silver, representing how many ounces of silver are required to purchase a single ounce of gold. Historically, a declining ratio indicates that silver is outperforming gold.
In early October 2026, gold has been consolidating around $4,140 per ounce, with silver trading near $60 per ounce, yielding a ratio of approximately 68.4. This sits slightly above the historical median of ~61.6 since 1968. Macroeconomic variables shaping precious metal performance during the week of October 5, 2026, include the release of U.S. Federal Reserve minutes and shifting Treasury yields.
This description was generated by AI. Review and verify everything here yourself. You can edit, replace, or delete any part of this description, including the resolution criteria. You do not need to trust the AI output.
 1,000
1,000🏅 Top traders
| # | Trader | Total profit |
|---|---|---|
| 1 | Ṁ19 | |
| 2 | Ṁ11 | |
| 3 | Ṁ0 |