
Multiple sources report that the global mean water (sea) level has risen in the last century by 200 mm (and it seems that it is accelerating, e.g. rising much faster when compared to the centuries before) ... Regardless of its context and plausible causes, in the last decade this finding has been confirmed by multiple measurement methodologies, including satellite augmented and/or other observations ...
Source for resolution > https://climate.nasa.gov/vital-signs/sea-level/?intent=121
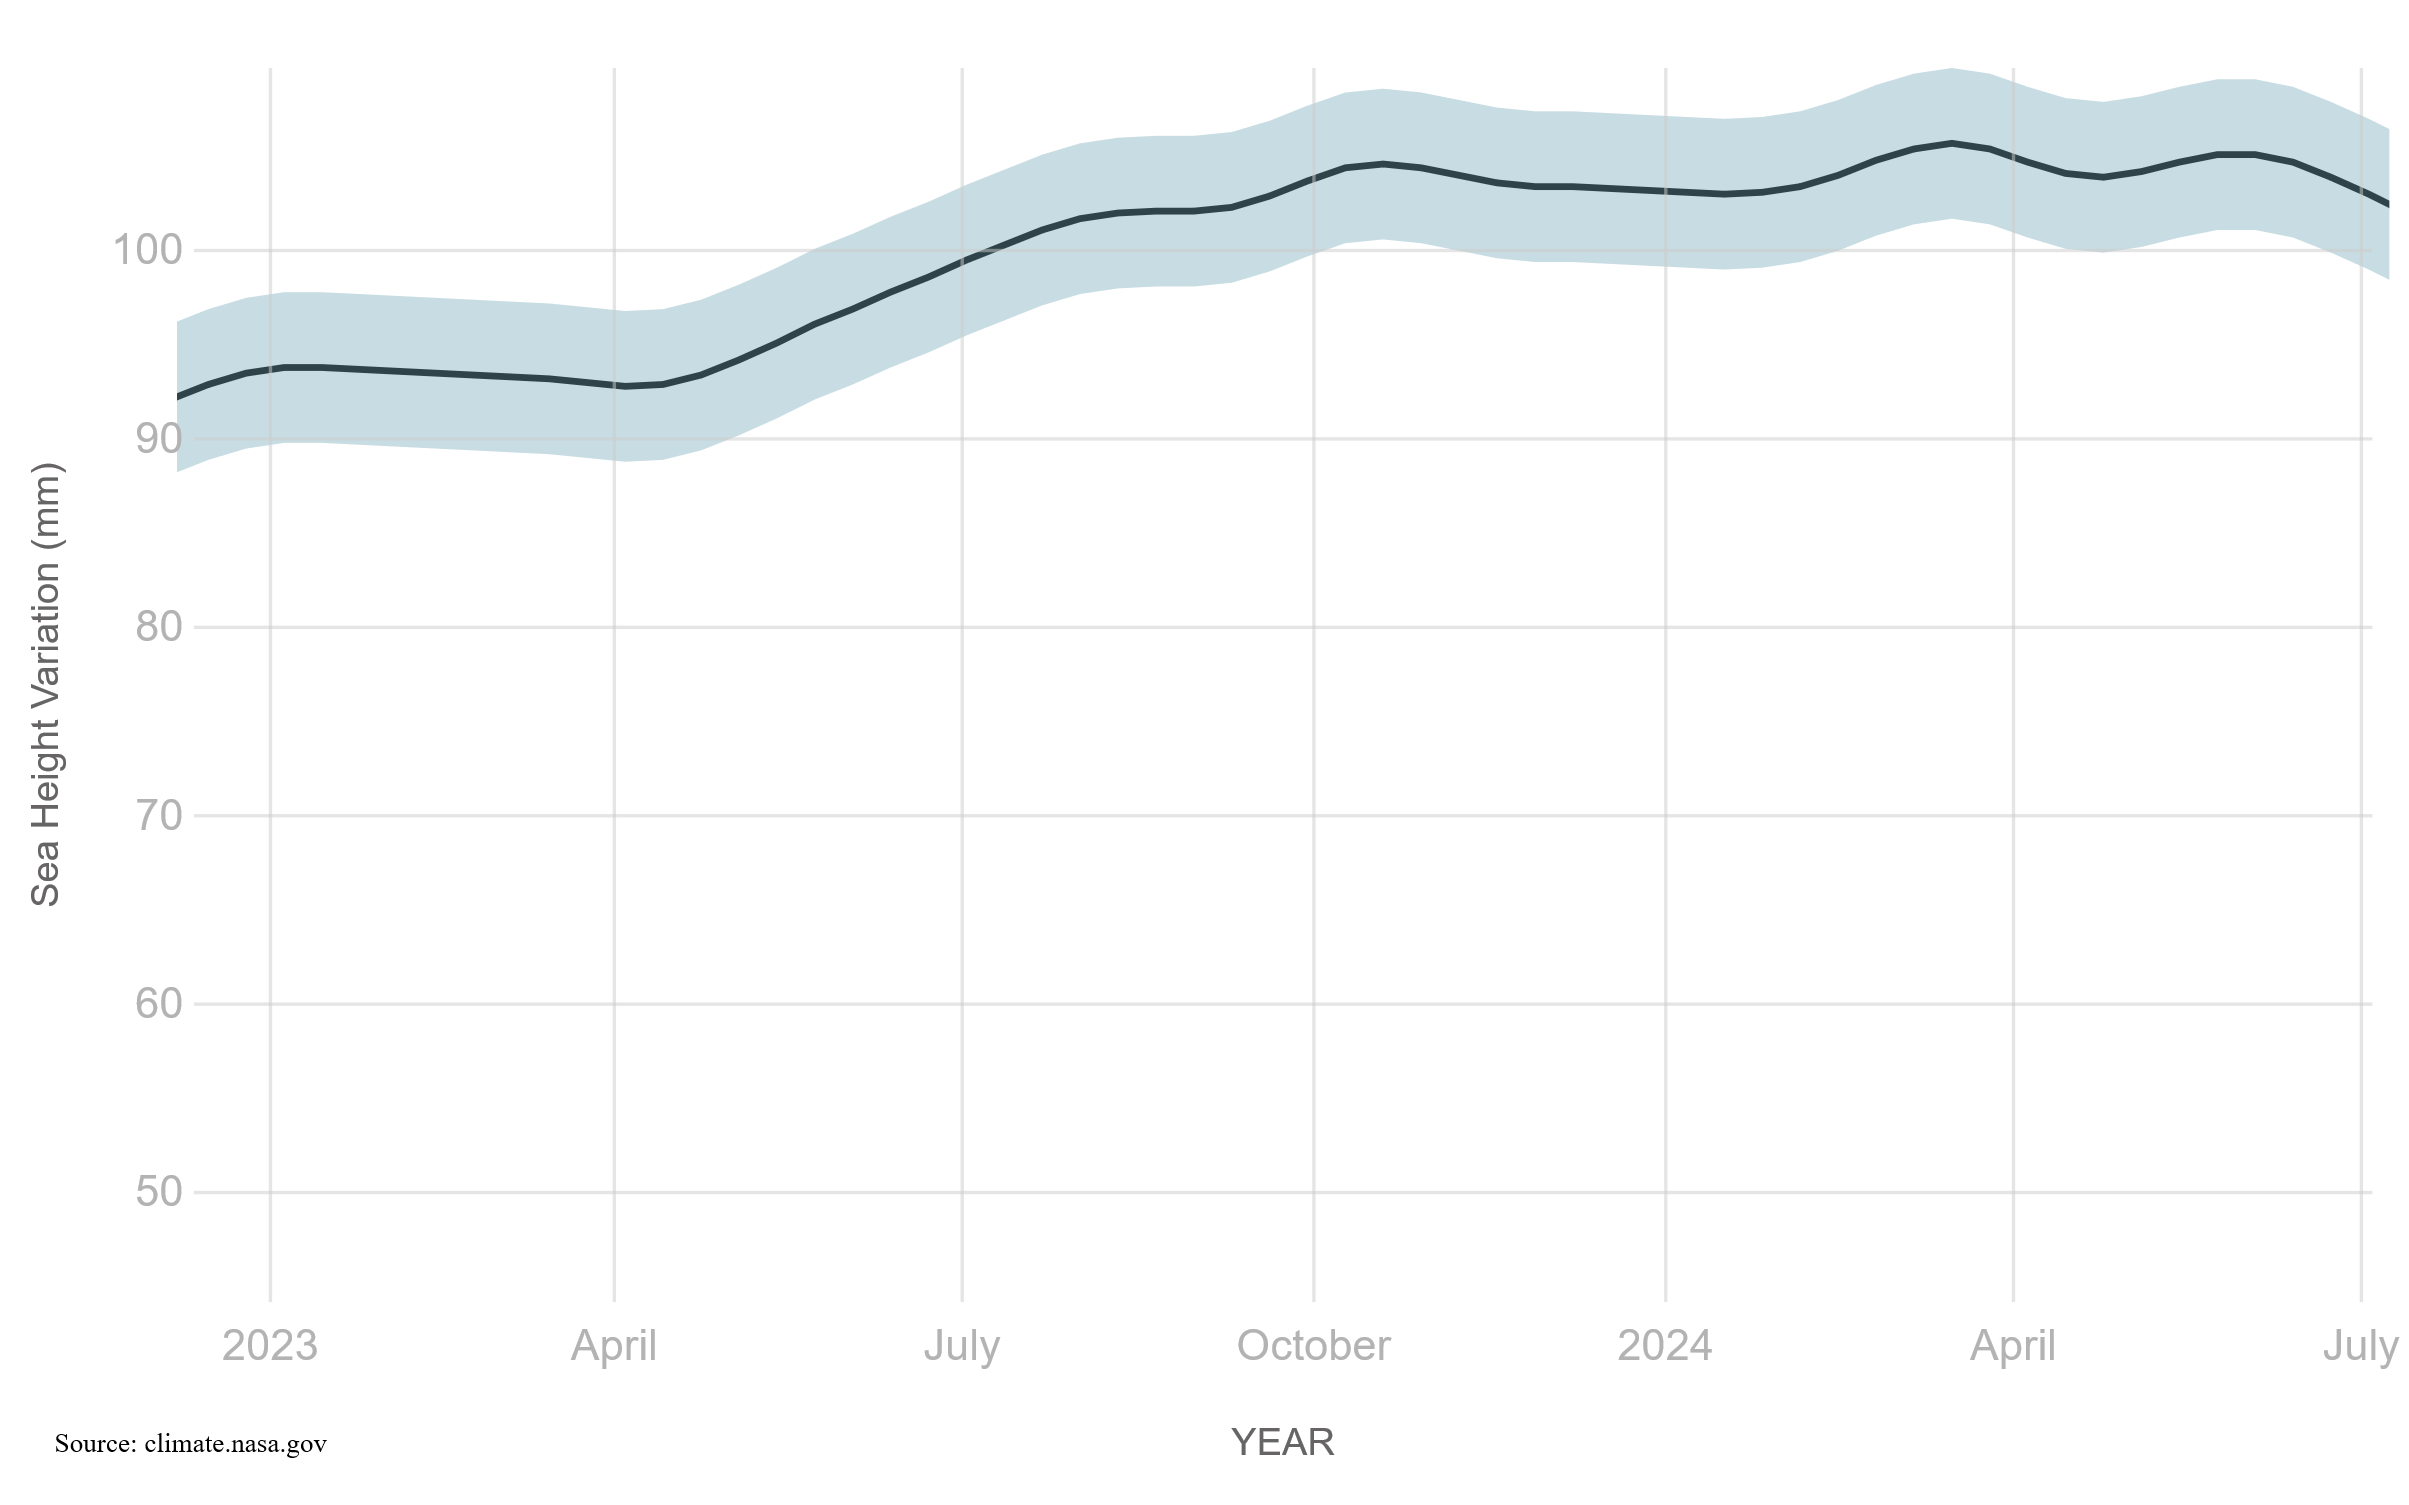
They provide estimates periodically, and at the time of the creation, last update (at time of creating this q) is from 16-JAN-2024 ( + 103.8 mm, meaning rise when compared to 25-JAN-1993)
There are two types of asks,
1) is if the global sea level estimate for one month has risen when compared to the same month one year earlier (for resolution directly compare the first measurement for that particular month and -1 year)
AND (if there are substantial predictions before resolution)
2) will it change by more than 4 mm (regardless of the direction of change and the sign, if the change has value of 4.0 mm or >, it is resolved to YES)
Since there may be multiple estimates for one month, we take into account only the first from that particular month (for example, for April 2023 is 04-Apr-2023, 92.7 mm )
 1,000
1,000🏅 Top traders
| # | Trader | Total profit |
|---|---|---|
| 1 | Ṁ1,881 | |
| 2 | Ṁ39 | |
| 3 | Ṁ36 | |
| 4 | Ṁ0 |
People are also trading
2 Aug 2024 100.5 is down 1.5mm from a year ago Aug 2023 102.0
So I believe both Aug 2024 markets can resolve as no. @3d
@3d
July 2023 99.4
July 2024 102.9
This is an increase of 3.5mm so the over 4mm difference should have resolved no but you resolved it yes.
Am I missing something or does this need to be re-resolved?
(If it needs to be re-resolved tag @mods )
@ChristopherRandles yes, this is mistake, it should have been resolved to "no" ... thank you for reporting, i am taging @mods so I hope that it could be re-resolved
Feb 2023 93.5
Feb 2024 103.3
Mar 2023 93.2
Mar 2024 105.4
April 2023 92.7
April 2024 104.6
May 2023 94.1
May 2024 104.1
June 2023 96.8
June 2024 104.7
So those are all rises of over 4mm (7.9-12.2)
@3d