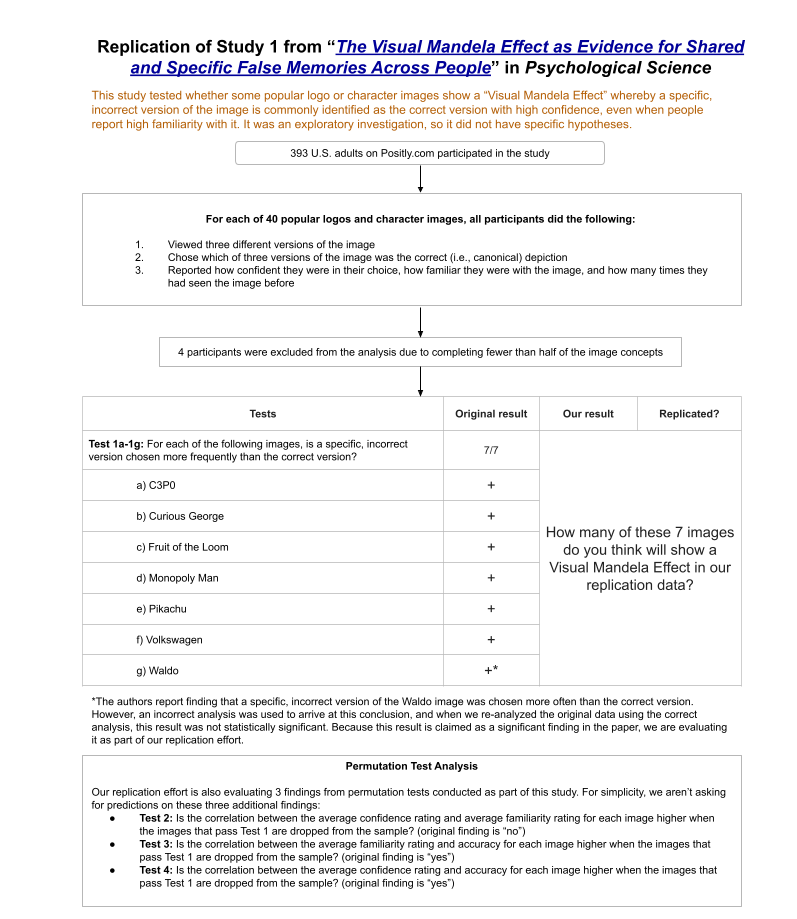
This question will resolve as the number from 0 to 7 of the images that showed a Visual Mandela Effect in the original study (described below) that show a Visual Mandela Effect in our replication data.
An image was determined to show a Visual Mandela Effect if more participants selected a specific one of the incorrect answers than selected the correct answer. (If both wrong answers were chosen with similar frequency that would not provide evidence of a Visual Mandela Effect, because it wouldn’t be evidence of a specific shared false memory for the image, it would only show that people didn’t know what the correct answer was.)
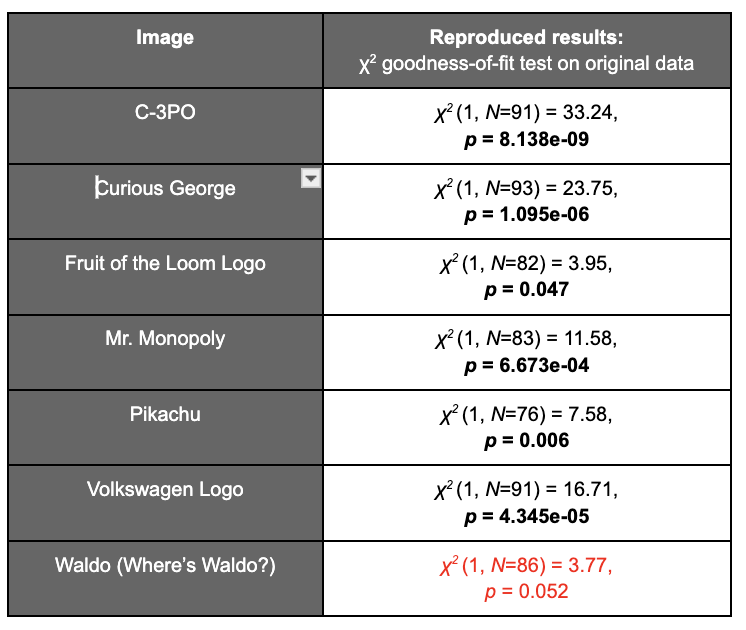
In a reproduction of the results on the original data, a chi-squared test of goodness-of-fit was used to determine if the distribution of answers between the correct and specific incorrect answer were statistically significantly different from an even split between those two responses (which is what would be expected if participants chose randomly between the two). The results of these chi-squared tests on the original data are presented below.
An image will be counted as showing a Visual Mandela Effect in the replication study if one specific incorrect answer was chosen more frequently than the correct response, and the chi-squared test of goodness-of-fit described above is statistically significant.
About the Study
We ran a replication of study 1 from the 2022 Psychological Science paper, “The Visual Mandela Effect as Evidence for Shared and Specific False Memories Across People,” which tested whether a series of popular logos and characters (e.g., Apple logo, Bluetooth symbol, Mr. Monopoly) showed a “Visual Mandela Effect”—a phenomenon where people hold “specific and consistent visual false memories for certain images in popular culture.” For example, many people on the internet remember Mr. Monopoly as having a monocle when, in fact, the character has never had a monocle. The original study found that 7 of the 40 images it tested showed evidence of a Visual Mandela Effect: C-3PO, Fruit of the Loom logo, Curious George, Mr. Monopoly, Pikachu, Volkswagen logo, and Waldo (from Where’s Waldo).
Click here for a larger version of this diagram.
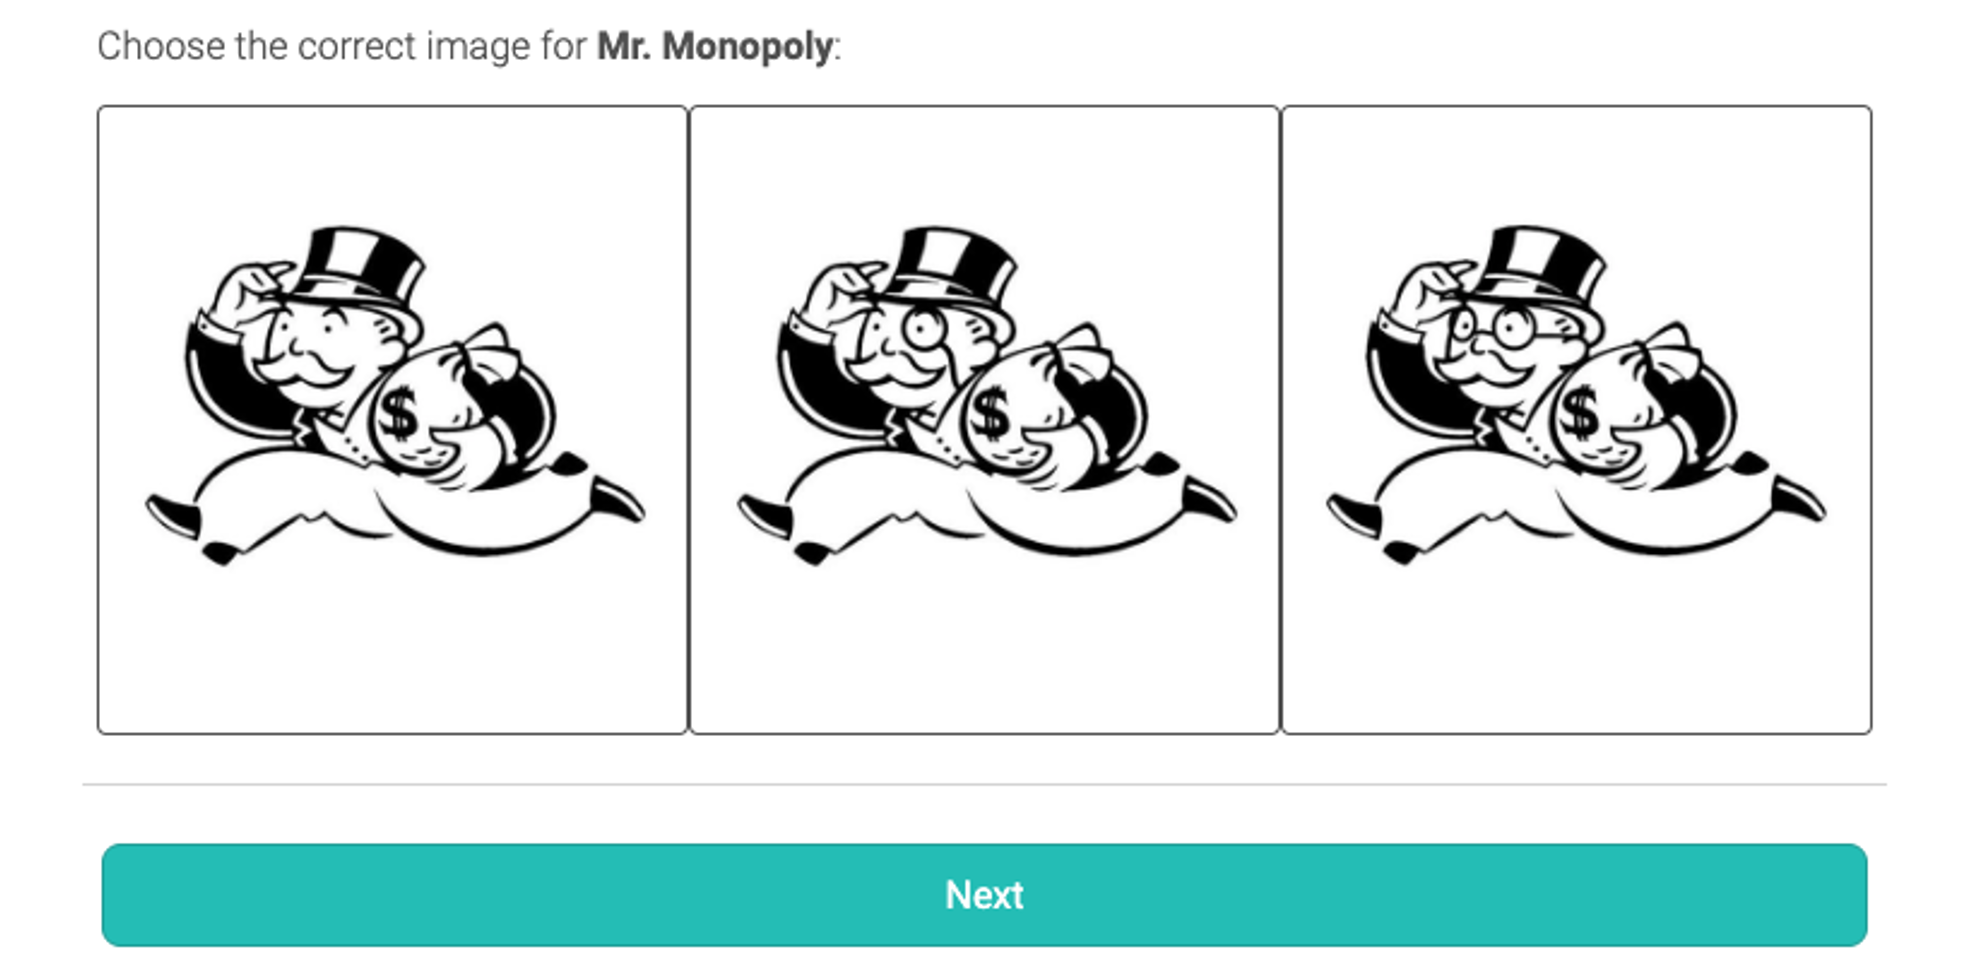
In both the original study (N = 100) and our replication study (N = 389), participants evaluated one popular logo or character image at a time. For each image, participants saw three different versions. One of these versions was the original, while the other two versions had subtle differences, such as a missing feature, an added feature, or a change in color. Participants were asked to select which of these three versions was the correct version. The order that the 40 image sets were presented in, and the order the three images in the set were presented in was randomized. Participants then rated how confident they felt in their choice, how familiar they were with the image, and how many times they had seen the image before.
This is an example of what participants saw when asked to select an image in the replication study:
Fine Print
The table below shows the reproduced chi-squared goodness-of-fit results for the 7 images on the original data. Due to an error in the data analysis presented in the paper, the Waldo image was counted as showing a statistically significant chi-squared result, when the result is non-significant (although borderline) in the corrected analysis (p = 0.052). Because this was claimed in the paper as a significant finding, we evaluated it as part of our replication effort.
About Transparent Replications
Transparent Replications by Clearer Thinking conducts replications and evaluates the transparency of randomly-selected, recently-published psychology papers in prestigious journals, with the overall aim of rewarding best practices and shifting incentives in social science toward more replicable research.
Context: How often have social science studies tended to replicate in the past?
In one historical project that attempted to replicate 100 experimental and correlation studies from 2008 in three important psychology journals, analysis indicated that they successfully replicated 40%, failed to replicate 30%, and the remaining 30% were inconclusive. (To put it another way, of the replications that were not inconclusive, 57% were successful replications.)
In another project, researchers attempted to replicate all experimental social science science papers (that met basic inclusion criteria) published in Nature or Science (the two most prestigious general science journals) between 2010 and 2015. They found a statistically significant effect in the same direction as the original study for 62% (i.e., 13 out of 21) studies, and the effect sizes of the replications were, on average, about 50% of the original effect sizes. Replicability varied between 57% and 67% depending on the replicability indicator used.
The replication described here was run as part of the Transparent Replications project, which has not run enough replications yet for us to give any base replication rates. Having said that, if you’re interested in reading more about the project, you can read more here. And here is where you can find write-ups for the previous replications we’ve completed.
 1,000
1,000🏅 Top traders
| # | Trader | Total profit |
|---|---|---|
| 1 | Ṁ11 | |
| 2 | Ṁ1 |