Will resolve based on NOAA global monthly report. Usually gets released in the middle of the following month. A tie will resolve “no”.
🏅 Top traders
| # | Trader | Total profit |
|---|---|---|
| 1 | Ṁ758 | |
| 2 | Ṁ617 | |
| 3 | Ṁ450 | |
| 4 | Ṁ419 | |
| 5 | Ṁ245 |
People are also trading
Edit: ignore below comments ( not deleting for reference)
@PaperBoy Not that I'm disputing the resolution, but I'm a bit confused by the report. Maybe someone can point out what's going on.
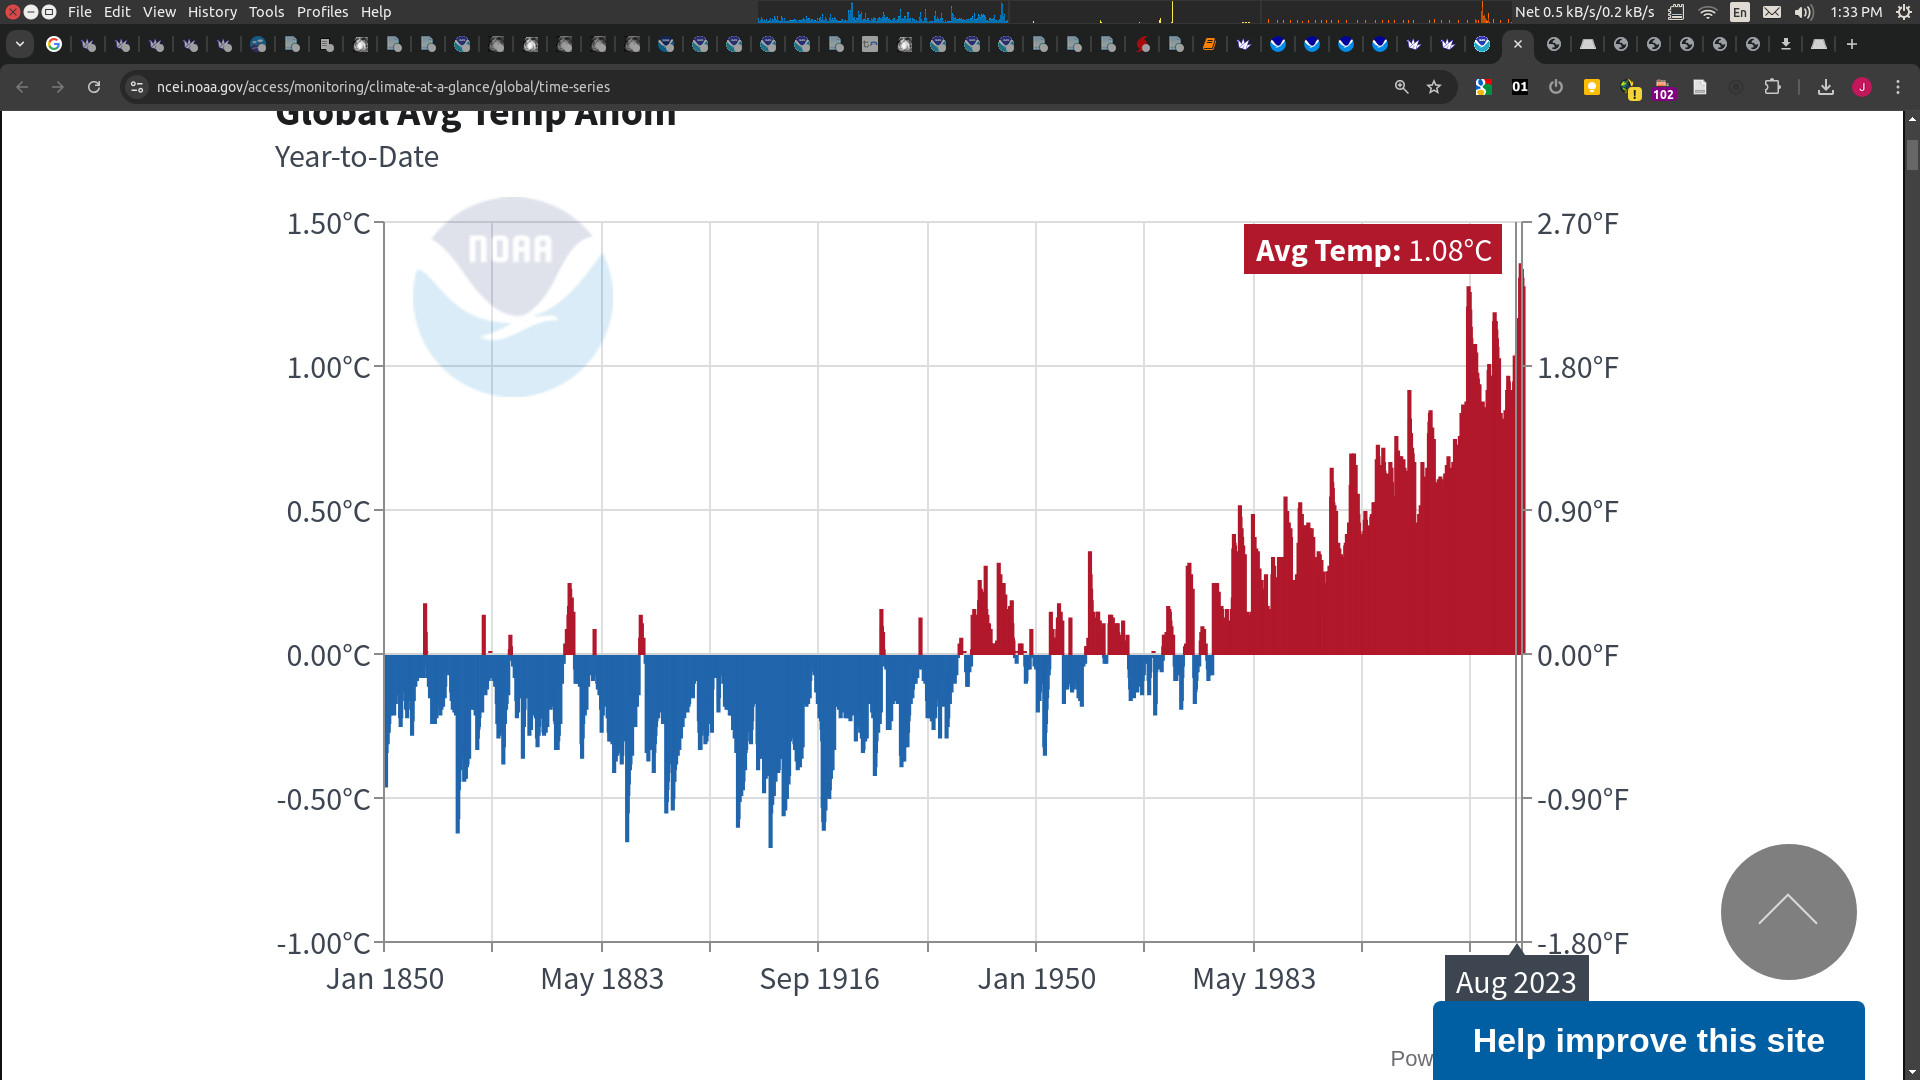
I've been referencing their LOTI index (as that is what is mentioned as their source for the numbers):
(from
https://www.ncei.noaa.gov/access/monitoring/climate-at-a-glance/global/time-series ).
"The most current reconstruction analysis is always considered the most representative and precise of the climate system, and it is publicly available through Climate at a Glance."
It has a completely different number for August 2023 ... (1.08 C)

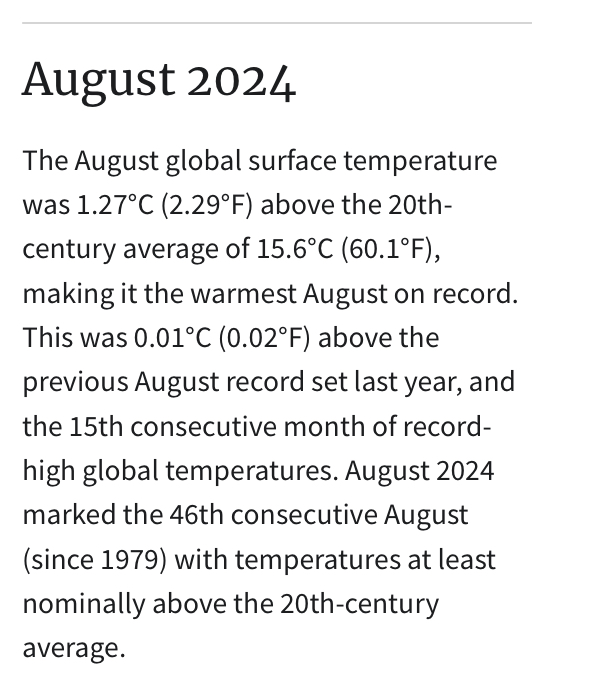
Their global report has 1.27C For August 2023 though...
Is the dataset different (and they don't use that one)?? Or has August 2023 been increased from 1.08 to 1.27C in the new reanalysis? (and the json is stale -- not updated yet)
@parhizj I'm confused when I go to that link I see Aug 2024 +1.27 and Aug 2023 +1.26C
Where do you get that 1.08C?
Ahh I think you are looking at year to date rather than Aug only?
January-August 20241.28°C175
January-August 20231.08°C173
@parhizj go to https://www.ncei.noaa.gov/access/monitoring/climate-at-a-glance/global/time-series/globe/tavg/land_ocean/ytd/8/1850-2024?trend=true&trend_base=10&begtrendyear=1850&endtrendyear=2024
select 1 month and then select year to date and data agrees I think
January-August 20241.28°C175
January-August 20231.08°C173
January-August 20220.92°C169
January-August 20210.83°C166
January-August 20201.05°C172
August 20241.27°C175
August 20231.26°C174
August 20220.92°C171
August 20210.88°C169
August 20200.90°C170
@ChristopherRandles Yeah but I'm now confused between the differrences between these two datasets...
Edit: nevermind it seems I completely misunderstood YTD if I infact understand it properly what is going on now... the YTD is a smoothed dataset? I was referencing the wrong dataset (damn!).
@ChristopherRandles Thought YTD meant all the anomalies to the present day... not that they were smoothing out the anomalies within each anomaly year
Sadly no one has corrected me all this time when I incorrectly referenced 1.08C as the threshold for last year...
@ChristopherRandles Yeah I did not understand YTD has a completely different meaning in this context.

By a hair, this question resolves YES
https://www.ncei.noaa.gov/access/monitoring/monthly-report/global/202408
@Judd Hmm good point. I never made that clear. To me when you tie a record you still become the “record holder” (to be referenced when referring to the record). In that sense I would resolve yes in case of a tie
@PaperBoy "Hottest" (in the market title) is singular though in my book... I have no mana in this market by the way, so no conflict of interest.
It doesn't change the probabilities too much either way at this late stage though..
Tie:

No-tie:

Wow, I didn't think "tie" was even worth talking about much, but... https://climate.copernicus.eu/surface-air-temperature-august-2024
(Not the data source this market is based on, tends come in a little lower than NOAA apparently, so I'm quite likely to lose my mana for this month.)
@equinoxhq That's like a 131 anomaly for ERA5. A tie means almost no chance that it fails to break record, because the differential that existed last year between ERA5 and GISS/NOAA (131 vs. 119 in GISS e.g.) is gone. We expect the anomaly to be fairly close this time around. And of course, now we have more data that affirms that.
Respect to the people hedging by selling some some NO at the 11th hour...
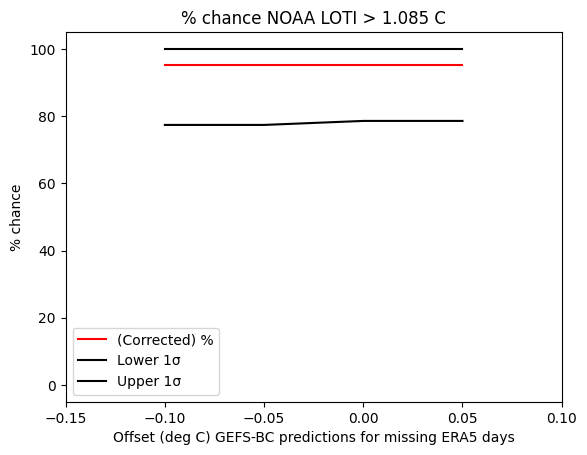
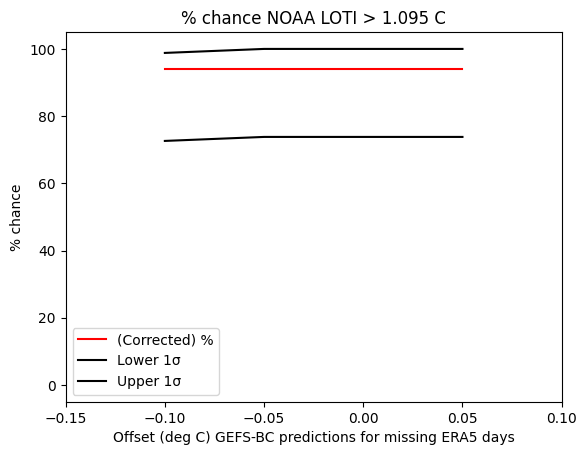
Polymarket is up to (an excessive?) 94%. I don't have a tight model for August sadly but it seems a bit high... (2 sigma is super wide for me but 85-90% seems reasonable). Edit: I should say I also get 94% for a middle value but pragmatically with the uncertainty it seems like its not worth betting it up so high....


@parhizj If you want ill place a limit order ~4% below poly at basically any time and you can get access to some of the poly liquidity
@Bayesian Thanks! Below is GISTEMP and NOAA below from June to September for 2016, 2023, 2024 if I didn't paste wrongly.
What is a bit unusual is the trend differences for the anomalies between gistemp and NOAA for these record breaking years... for instance if you look at the trend for NOAA for 2023 those months its a significant increase from 1.03 to 1.11 but for gistemp, their analysis skyrockets for September 2023 from 1.08 to 1.48 in 4 months... Something different happens between the groups for 2016 where NOAA anomaly gradually drops across these months (-0.07C ) and gistemp peaks in August, an anomaly 0.2 C higher than July. Their methodologies are different (especially in terms of infilling missing data points) with the uncertainty for gistemp supposed to be about 0.05C for recent decades. I haven't seen a quantification for NOAA's uncertainty but either it is larger than gistemp or these are explained away by being a couple of those 5% cases or by apples/oranges methodological differences ...
80 84 102 90
108 119 119 148
125 121 **** ****
"201606":"1.14","201607":"1.10","201608":"1.09","201609":"1.07""202306":"1.03","202307":"1.05","202308":"1.07","202309":"1.11""202406":"1.29","202407":"1.28"@Bayesian In second hindsight... if I'm not misunderstanding something and they revised August 2023 upwards, this is a very unpredictable factor in these markets that I don't directly account for...
