
How will i assess?
Assessed using Primary credit from the H.4.1 by summing all weekly totals from the period ending 15/3/2023 through to the period ending 5/7/2023 (inclusive).
This may seem onerous but an xml of all weeks can be downloaded from the Fed here and I'll simply sum the weekly totals and post the math to close.
Mar 23, 8:52am: How much will the Bank Term Funding Program have loaned out by June 30th 2023 (in billions USD)? → How much primary credit will the Fed have added by June 30th 2023 (in billions USD)?
 1,000
1,000People are also trading
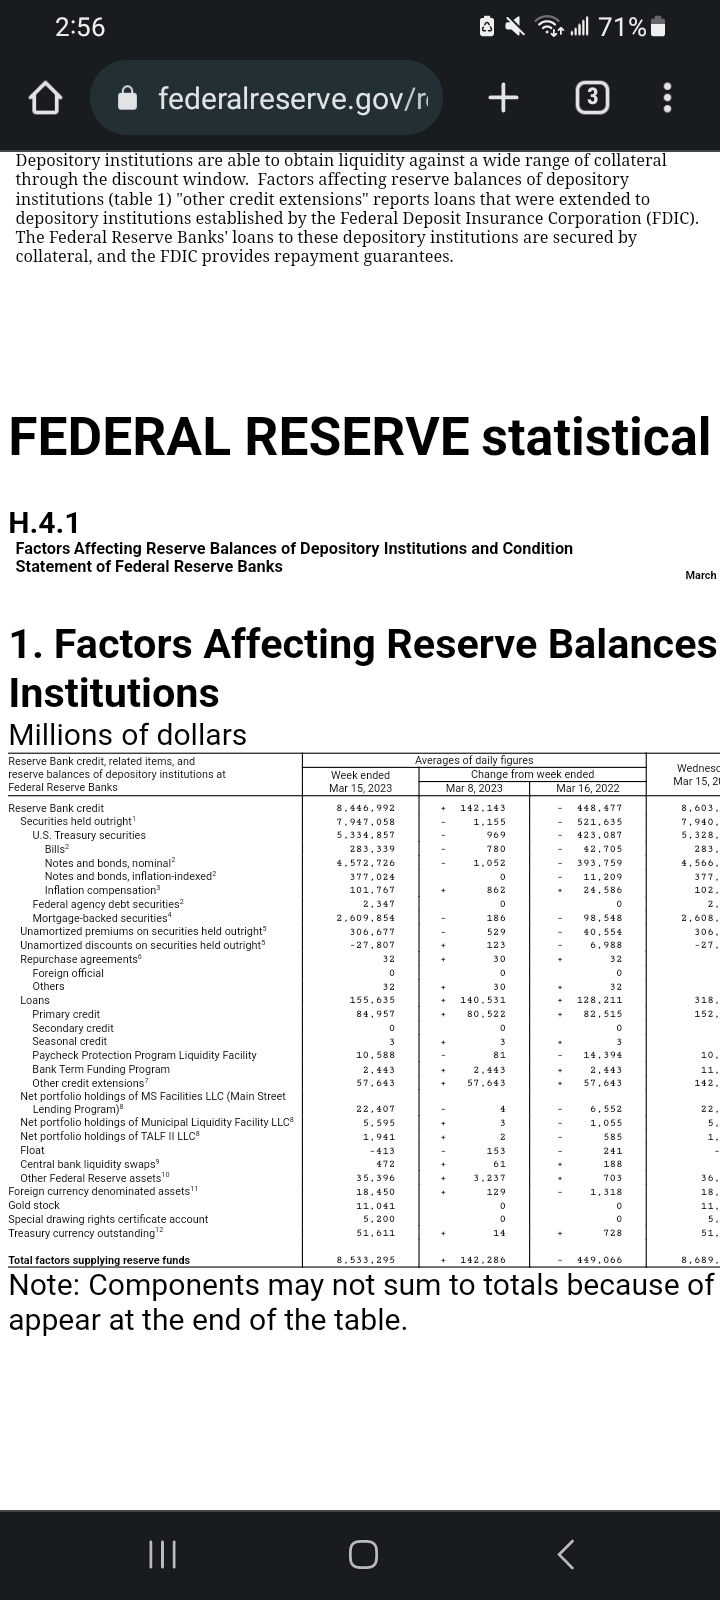
Just to show how schizophrenic the description is-
There are two numbers here that vary by a factor of 20. The primary lending and the program. Journalists are retards and used the wrong number.
I'm fine with using either number. What I'm saying is the question needs to be edited to only refer to one number, not both.
The primary credit is the larger number and reflects all bailouts, the term program is a small part of that.
I have low confidence anyone will understand this post.
@JamesBills that's still the wrong number. The media used thr wrong nunber. But I'm fine with it
@JamesBills eventually you will realize journalists are complete retards and used the wrong number by a factor of 20. You will realize this eventually and then blame me.
@MarkIngraham the only other resolution would be analysis of bank balance sheets, like chase increasing cash by 500B.
When TARP ended it took almost a decade for information to be available.
@MarkIngraham I've seen charts of the discount window borrowing, Ideally we'd use that to resolve wouldn't we?
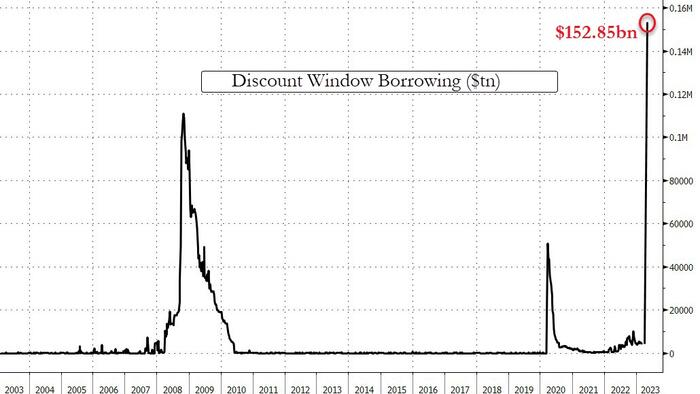
@JamesBills your graph is the primary credit entry in table 1 https://www.federalreserve.gov/releases/h41/current/default.htm it can be used but it's cumbersome
@JamesBills the problem is the question is contradictory and has three meanings. One, the size of the available line of credit at any moment. Two, the total summed use of this credit over a period. Three, the net free money banks gain. I think 2 is what the question is asking but you have to do tedious math to arrive at it
@MarkIngraham the question is like asking "how much stock did a day trader buy this year." Its a huge number because constant zero sum transactions. Nobody records that number but it adds up to some huge amount.
Also the media is reporting the secondary credit number, which is what banks lend after the fed lends. The primary credit is twice as large and what the fed is actually doing. The answer varies by a factor of two based on definition but the actual fed activity is the bigger number.
@MarkIngraham also note the media reported rhe wrong number and there is row for "Bank term funding" of only 11b, the bigger number is assuming everything else is part of that.
@MarkIngraham so depending on what the asker decides the answer could be 100b or 2T because the media fucked up and can't read a table.
@MarkIngraham Thanks mate, the source you posted will be used to resolve this market (there is a way to bulk download the data).
@JamesBills the point is the media reported the wrong number and is off by a factor of 20
@JamesBills https://www.newyorkfed.org/markets/data-hub fed treasury Holdings roughly correlate with all types of market support
@MarkIngraham is the 150 per week a cap that's set somewhere? Or just first week performance?
@JamesBills SVB reduced the odds of other banks failing due to massive life support. The next failure will be systemic, there will be no individual bank failures.
@MarkIngraham ironically manifold itself will have a financial crisis when massive leveraged bets on AI fail, exactly like the real world. I predict a manifold financial crisis in 2024
@MarkIngraham interesting thesis, why aren't you betting higher up to two trillion dollars though?
@MarkIngraham hit the 'Higher' button, and increased your bet size - it will show you the impact you have on the market.