
Data is currently at
https://data.giss.nasa.gov/gistemp/tabledata_v4/GLB.Ts+dSST.csv
or
https://data.giss.nasa.gov/gistemp/tabledata_v4/GLB.Ts+dSST.txt
(or such updated location for this Gistemp v4 LOTI data)
January 2024 might show as 122 in hundredths of a degree C, this is +1.22C above the 1951-1980 base period. If it shows as 1.22 then it is in degrees i.e. 1.22C. Same logic/interpretation as this will be applied.
If the version or base period changes then I will consult with traders over what is best way for any such change to have least effect on betting positions or consider N/A if it is unclear what the sensible least effect resolution should be.
Numbers expected to be displayed to hundredth of a degree. The extra digit used here is to ensure understanding that +1.20C does not resolve an exceed 1.205C option as yes.
Resolves per first update seen by me or posted as long, as there is no reason to think data shown is in error. If there is reason to think there may be an error then resolution will be delayed at least 24 hours. Minor later update should not cause a need to re-resolve.
 1,000
1,000🏅 Top traders
| # | Trader | Total profit |
|---|---|---|
| 1 | Ṁ914 | |
| 2 | Ṁ572 | |
| 3 | Ṁ217 |
People are also trading
@SiebeNijland No idea what's driving it... data from last night (ghcnm.v4.0.1.20250104) had basically the same result... I didn't even bother posting it since there was so little change:
Dec: 122.36861355125757;
J-D: 128.04741373052914
and the data tonight hasn't come out yet... maybe in the next couple hours
@aenews who knows which data set they'll use.. likely? this or the next one if they do the run tomorrow or Tuesday... Leaving it to Wednesday might be a bit late if they have other products like the annual report to write for Friday delivery..
First data is out so far (ersstv5 and ghcnm.v4.0.1.20250102). I've disabled rounding in my output:
December: 122.40471513853517
J-D: 128.23000003229893
Based on past experience it will fluctuate quite a bit but not beyond a bin up or down (usually upwards) based on where it is... so don't want to update too hard but its close to the middle of the bin so I'm updating the bin upwards a bit more than @gopfan who was faster than me tonight ...
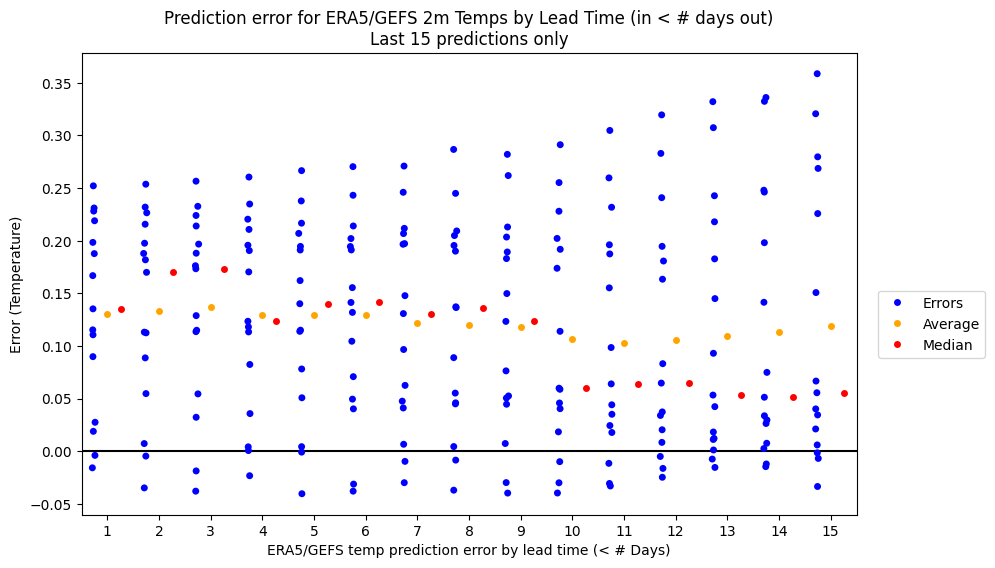
Was a tough call this month as the ERA5 temps for the last few days ending of the month were significantly higher than GEFS predicted (+0.2C to 0.3C, far beyond my meta prediction offsets early in the month)
So there is a 60% I will lose quite a bit of mana as it stands...
Additionally Polymarket for the question has swapped odds with this question for the favored bin ... It thinks 1.20-1.24 is more likely than 1.25-1.29...
Where as it stands I think 1.28-1.29 C is most likely temperature...
Based on a meta prediction of the remaning ERA5 data outstanding I think 1.29 C is most likely....
ERA5 temp is in for final day of 2024... Checked the schedule earlier for the annual gistemp release... Release date is Friday Dec 10 (8 days from now)
Polymarket has flipped with me on the most likely and has a much sharper distribution than I do for the probabilities.... (I know the bins aren't exactly the same but this still holds)

Edit:
Including point prediction for reference (1.29C):
GIS TEMP anomaly projection (December 2024) (corrected, assuming -0.094 error, (absolute_corrected_era5: 13.330)):
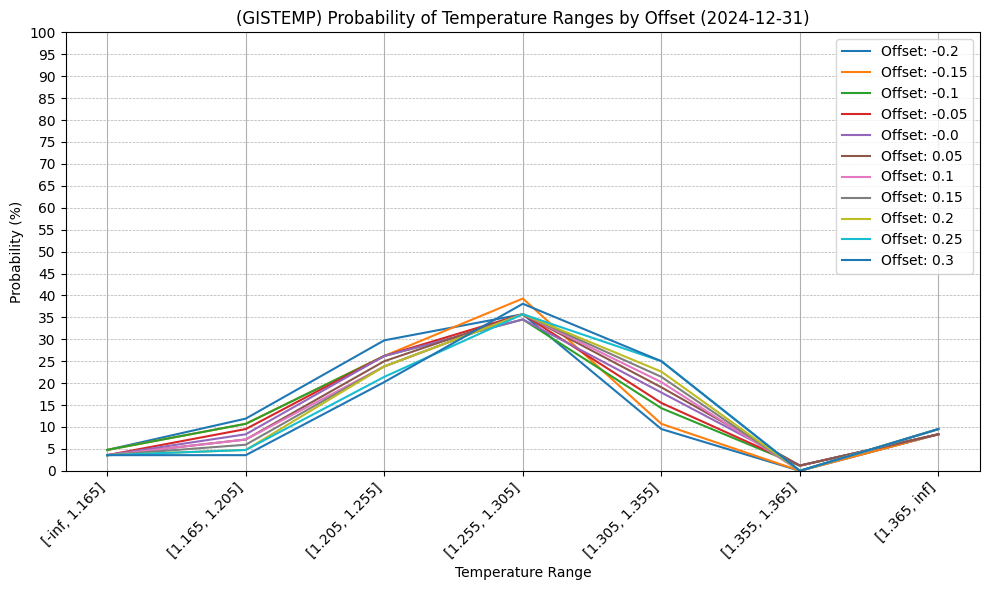
1.286 C +-0.097I realized after looking at the annual market ... for these probability ranges on questions like this, the point prediction can be quite misleading when looking at the distribution for a range of temperatures... (you might the distribution to be expected to fatter on the right given how high the point prediction is but the model shows it is fatter on the left).
GEFS looks like holding steady with maybe very slight warming until the 25th; edit and then a good deal more variability on the 30th and 31st... (raw absolute numbers below)

recent trends seem to favor ~+0.05 offset for remaing days (0 to 0.1 offset range most realistic)....
I am expecting the risk of that +0.1 offset will likely make 1.26+ more appetizing until the new year anyway and continue to flatten the distribution for me...
Raw (absolute, 06 hour spacing) GEFS numbers for last 4 runs:
-- Processing ./gefs.20241220_00
--   Processing 105 files...
Global 2m temp average (C) for 12-20-2024: 12.392 (day over day delta:  0.000)
Global 2m temp average (C) for 12-21-2024: 12.398 (day over day delta:  0.005)
Global 2m temp average (C) for 12-22-2024: 12.376 (day over day delta: -0.022)
Global 2m temp average (C) for 12-23-2024: 12.322 (day over day delta: -0.054)
Global 2m temp average (C) for 12-24-2024: 12.342 (day over day delta:  0.019)
Global 2m temp average (C) for 12-25-2024: 12.414 (day over day delta:  0.073)
Global 2m temp average (C) for 12-26-2024: 12.377 (day over day delta: -0.037)
Global 2m temp average (C) for 12-27-2024: 12.305 (day over day delta: -0.072)
Global 2m temp average (C) for 12-28-2024: 12.273 (day over day delta: -0.031)
Global 2m temp average (C) for 12-29-2024: 12.248 (day over day delta: -0.025)
Global 2m temp average (C) for 12-30-2024: 12.234 (day over day delta: -0.014)
Global 2m temp average (C) for 12-31-2024: 12.189 (day over day delta: -0.045)
Global 2m temp average (C) for 01-01-2025: 12.102 (day over day delta: -0.087)
Global 2m temp average (C) for 01-02-2025: 12.040 (day over day delta: -0.062)
Global 2m temp average (C) for 01-03-2025: 12.034 (day over day delta: -0.006)
Global 2m temp average (C) for 01-04-2025: 12.012 (day over day delta: -0.022)
-- Processing ./gefs.20241220_06
--   Processing 105 files...
Global 2m temp average (C) for 12-21-2024: 12.403 (day over day delta: -0.194)
Global 2m temp average (C) for 12-22-2024: 12.369 (day over day delta: -0.034)
Global 2m temp average (C) for 12-23-2024: 12.318 (day over day delta: -0.051)
Global 2m temp average (C) for 12-24-2024: 12.343 (day over day delta:  0.025)
Global 2m temp average (C) for 12-25-2024: 12.406 (day over day delta:  0.063)
Global 2m temp average (C) for 12-26-2024: 12.371 (day over day delta: -0.035)
Global 2m temp average (C) for 12-27-2024: 12.302 (day over day delta: -0.068)
Global 2m temp average (C) for 12-28-2024: 12.273 (day over day delta: -0.030)
Global 2m temp average (C) for 12-29-2024: 12.254 (day over day delta: -0.019)
Global 2m temp average (C) for 12-30-2024: 12.147 (day over day delta: -0.107)
Global 2m temp average (C) for 12-31-2024: 12.185 (day over day delta:  0.038)
Global 2m temp average (C) for 01-01-2025: 12.136 (day over day delta: -0.049)
Global 2m temp average (C) for 01-02-2025: 12.107 (day over day delta: -0.029)
Global 2m temp average (C) for 01-03-2025: 12.073 (day over day delta: -0.034)
Global 2m temp average (C) for 01-04-2025: 12.008 (day over day delta: -0.065)
-- Processing ./gefs.20241220_12
--   Processing 105 files...
Global 2m temp average (C) for 12-21-2024: 12.408 (day over day delta:  0.075)
Global 2m temp average (C) for 12-22-2024: 12.381 (day over day delta: -0.026)
Global 2m temp average (C) for 12-23-2024: 12.326 (day over day delta: -0.055)
Global 2m temp average (C) for 12-24-2024: 12.333 (day over day delta:  0.007)
Global 2m temp average (C) for 12-25-2024: 12.397 (day over day delta:  0.063)
Global 2m temp average (C) for 12-26-2024: 12.361 (day over day delta: -0.036)
Global 2m temp average (C) for 12-27-2024: 12.288 (day over day delta: -0.073)
Global 2m temp average (C) for 12-28-2024: 12.274 (day over day delta: -0.014)
Global 2m temp average (C) for 12-29-2024: 12.261 (day over day delta: -0.014)
Global 2m temp average (C) for 12-30-2024: 12.336 (day over day delta:  0.075)
Global 2m temp average (C) for 12-31-2024: 12.191 (day over day delta: -0.145)
Global 2m temp average (C) for 01-01-2025: 12.130 (day over day delta: -0.061)
Global 2m temp average (C) for 01-02-2025: 12.086 (day over day delta: -0.044)
Global 2m temp average (C) for 01-03-2025: 12.038 (day over day delta: -0.048)
Global 2m temp average (C) for 01-04-2025: 12.004 (day over day delta: -0.033)
-- Processing ./gefs.20241220_18
--   Processing 105 files...
Global 2m temp average (C) for 12-21-2024: 12.434 (day over day delta:  0.756)
Global 2m temp average (C) for 12-22-2024: 12.415 (day over day delta: -0.019)
Global 2m temp average (C) for 12-23-2024: 12.338 (day over day delta: -0.077)
Global 2m temp average (C) for 12-24-2024: 12.325 (day over day delta: -0.013)
Global 2m temp average (C) for 12-25-2024: 12.391 (day over day delta:  0.066)
Global 2m temp average (C) for 12-26-2024: 12.352 (day over day delta: -0.039)
Global 2m temp average (C) for 12-27-2024: 12.283 (day over day delta: -0.069)
Global 2m temp average (C) for 12-28-2024: 12.260 (day over day delta: -0.023)
Global 2m temp average (C) for 12-29-2024: 12.263 (day over day delta:  0.003)
Global 2m temp average (C) for 12-30-2024: 12.380 (day over day delta:  0.117)
Global 2m temp average (C) for 12-31-2024: 12.215 (day over day delta: -0.166)
Global 2m temp average (C) for 01-01-2025: 12.155 (day over day delta: -0.059)
Global 2m temp average (C) for 01-02-2025: 12.096 (day over day delta: -0.059)
Global 2m temp average (C) for 01-03-2025: 12.042 (day over day delta: -0.055)
Global 2m temp average (C) for 01-04-2025: 12.009 (day over day delta: -0.032)
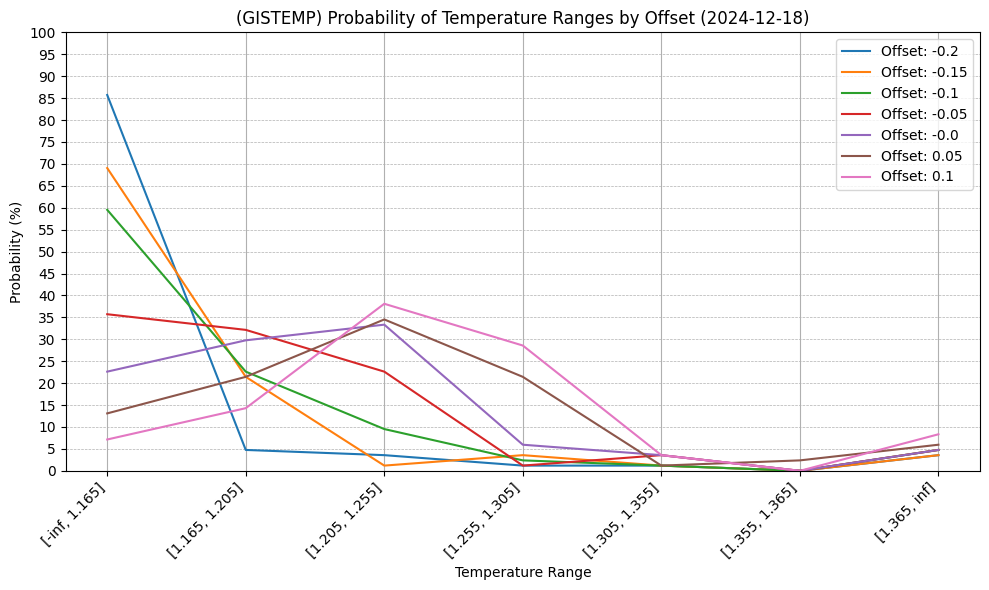
Some more uncertainty compared to last time I updated as ERA5 temps are coming in slightly warmer than predicted by GEFS for last few days, so I added some offsets to my chart for it (0.0C offset most likely, followed by 0.05 C offset by looking at recent trends)... Considering this I'm betting to more flatten/spread the distribution probabilities ...
for 0.0C offset:
GIS TEMP anomaly projection (December 2024) (corrected, assuming -0.087 error, (absolute_corrected_era5: 13.255)):
  1.211 C +-0.097
for 0.05C offset (i.e., raising remainings GEFS forecast temps by such an amount to count for recent relatively cool temps against ERA5):
GIS TEMP anomaly projection (December 2024) (corrected, assuming -0.089 error, (absolute_corrected_era5: 13.277)):
  1.233 C +-0.097
I still think a lower temp is undervalued -- polymarket currently has cumulatively 87% at >1.25 C...
My model still has a completely different distribution with most of the fatness of the tail to the lower end than rather the right, although offsets > 0.1C are probably unrealistic given recent trends.... (-0.05 to 0.05C being the most realistic in my opinion)
https://polymarket.com/event/december-2024-temperature-increase-c?tid=1734214146975
has median and mode in the 1.25 to 1.29 range.
Whats up JRP?
@ChristopherRandles Some chance I might have a problem with my code as I had fix it for the end of the year, but the numbers don't seem problematic...
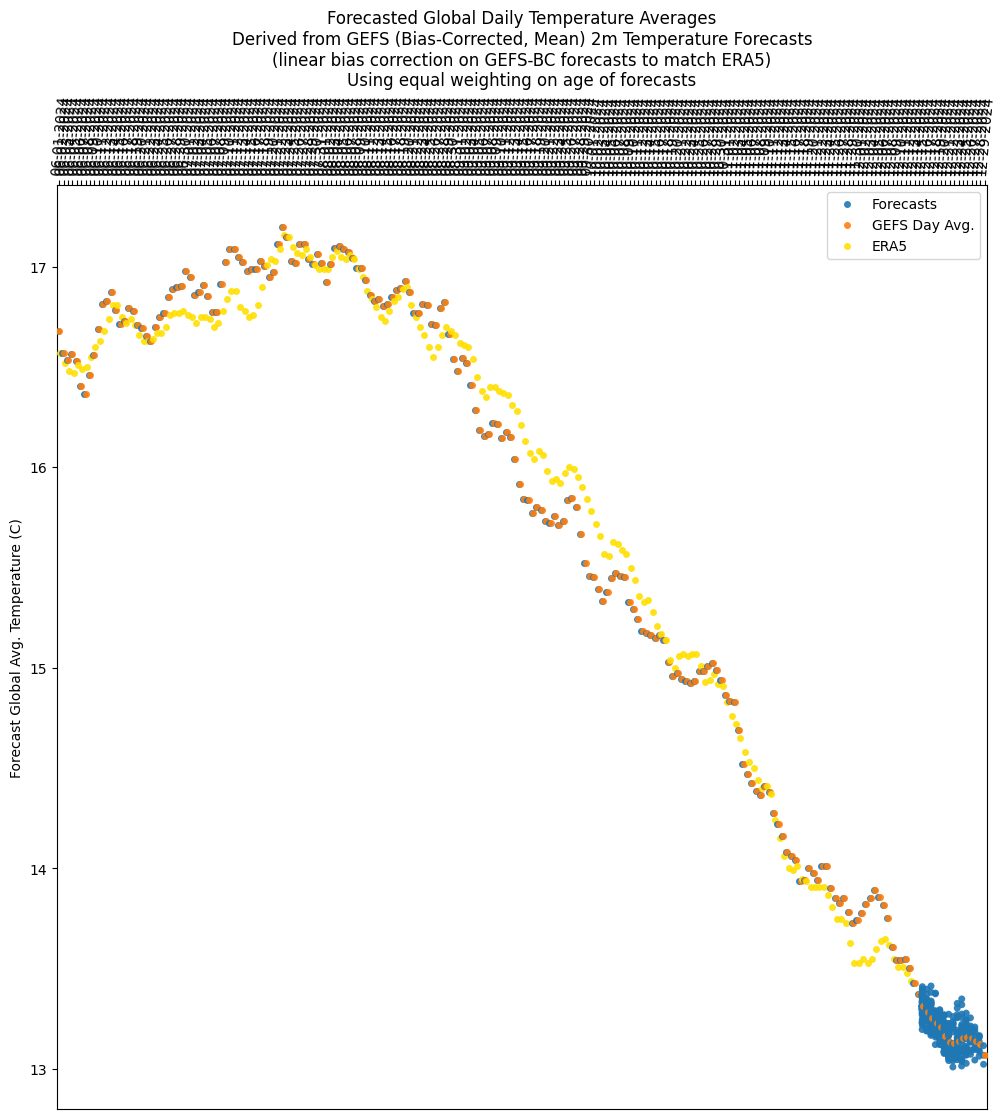
Here is the forecast temps I have for ERA5 (adjusted from GEFS) for December:
[13.55, 13.53, 13.55, 13.6, 13.64, 13.65, 13.62, 13.55, 13.51, 13.51, 13.48, 13.44, 13.430757705957095, 13.373059592623814, 13.313321297735449, 13.282410913125263, 13.253724678207824, 13.231343624254196, 13.2074316710671, 13.163967704105062, 13.134913587125213, 13.127953159425445, 13.141402768851922, 13.153049624332912, 13.159709925496253, 13.157221630740674, 13.137775229457954, 13.124707862031219, 13.069805457107867, 13.048573186559244, 13.041853696510113]
Might have been too bullish yesterday on the meta prediction of GEFS long range being too high for rest of the month; its not stabilized yet, but I don't think I'm too far off.
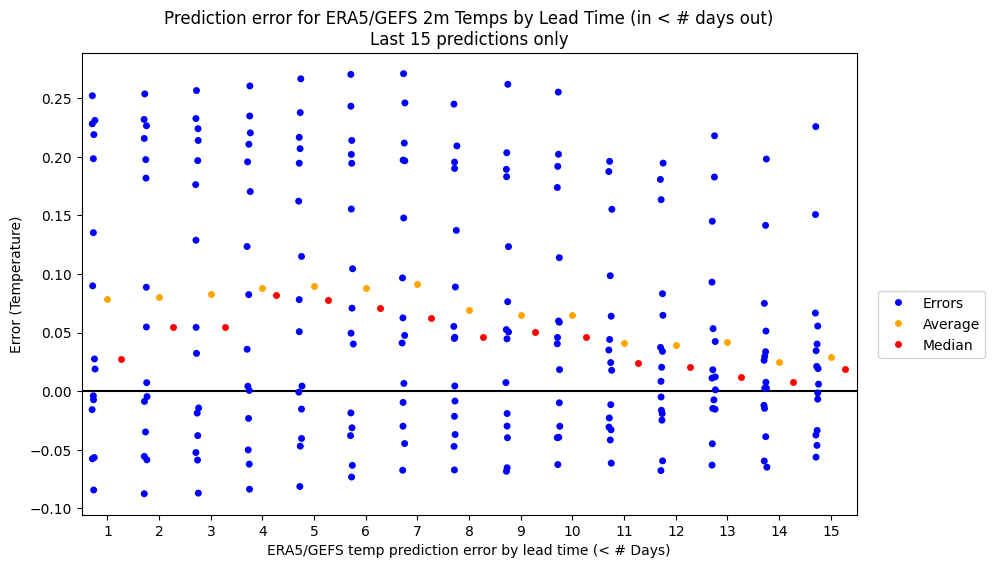
The GEFS to ERA5 error last month was on the high side (0.15 to 0.2) towards the end of the month and had been for the beginning of this month as well, but now it looks like its regressing back to the mean, so now I'm going to assume an error of 0.0 for the rest of the month...
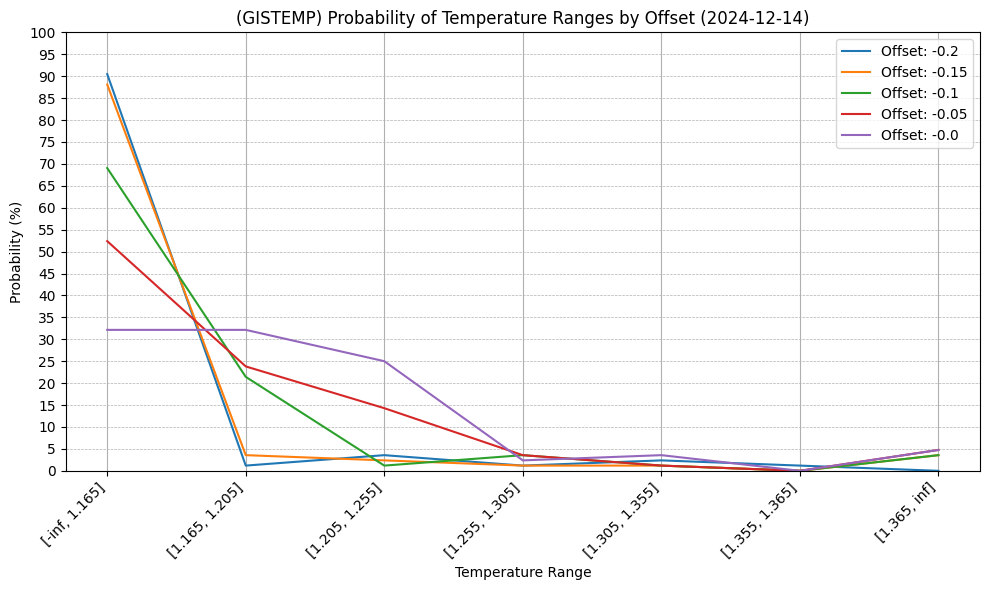
If the error for GEFS->ERA5 is roughly 0 for rest of the month (purple line) it still puts most of the probability below 1.255....
GIS TEMP anomaly projection (December 2024) (corrected, assuming -0.086 error, (absolute_corrected_era5: 13.243)):
  1.199 C +-0.097
This is a more modest (secondary) error adjustment from ERA5->GISTEMP (after the above) so I don't think 1.2 C should be too far off (we'll see how good GEFS is...).
In short, I think Polymarket is too high. But, as usual the bins are small relative to the confidence intervals....
I have done poorly when it comes to predicting and updating on which gistemp final temp (which run) they end up choosing, so this time I'm going to be more conservative when that time comes...
Note: I have one more bucket than this market because I also want to know whether it will break the record....
@parhizj if you think you are right then I think 1.3+ should be very unlikely at
https://manifold.markets/ChristopherRandles/global-average-temperature-2024-per
@ChristopherRandles Yeah I’m not sure exactly how that is calculated by gistemp… I realized you can’t make assumptions when it comes to climate code…