White Christmas is defined by new snowfall on December 25, or up to 24 hours before, of at least one inch / 2.54 cm.
When you add cities, please confirm they have a population of at least 40,000 people. If outside the US, please also post a link to where the snowfall for that city can be verified (otherwise auction will resolve as N/A).
Auction closes on December 23. I’ll try to resolve ASAP after the 25th 🛷
Resolved for US cities based on data from the National Weather Service, eg https://www.weather.gov/source/crh/snowmap.html?sid=mpx
Resolved for Quebec based on:
All other international cities will be resolved as N/A unless a source for 24 hour accumulation totals is proposed and accepted.
🏅 Top traders
| # | Trader | Total profit |
|---|---|---|
| 1 | Ṁ506 | |
| 2 | Ṁ425 | |
| 3 | Ṁ246 | |
| 4 | Ṁ230 | |
| 5 | Ṁ126 |
After considering this carefully, I agree that observational data from www.weather.gov (National Weather Service) is the fairest source for resolving these markets. It was painful, but I went though and found the closest / most reliable station for each of these markets.
Here are sources for select among the markets I've resolved so far:
Resolution, Market, Snowfall (in), Source
YES Council Bluffs, IA (Omaha) 1.4 https://www.weather.gov/wrh/climate?wfo=oax
NO. Greeley, CO - https://www.weather.gov/wrh/climate?wfo=bou
NO Moorhead, MN - https://www.weather.gov/wrh/climate?wfo=fgf
NO Fort Collins, CO - https://www.weather.gov/wrh/climate?wfo=bou
NO Loveland, CO - https://www.weather.gov/wrh/climate?wfo=bou
NO Sioux Falls, SD 0.9 https://www.weather.gov/wrh/climate?wfo=fsd
YES Sioux City, IA 1.5 https://www.weather.gov/wrh/climate?wfo=fsd
YES Lincoln, NE 2.8 https://www.weather.gov/wrh/climate?wfo=oax
YES Grand Island, NE 2.5 https://www.weather.gov/wrh/climate?wfo=gid
NO Thornton, CO (NORTHGLENN, CO) - https://www.weather.gov/wrh/climate?wfo=bou
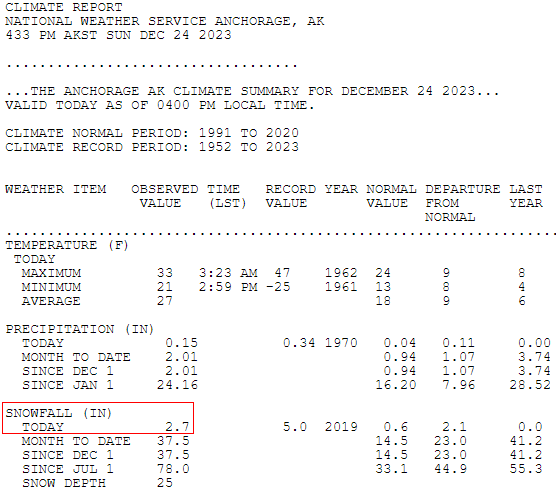
YES Anchorage, AK 3.0 https://www.weather.gov/arh/climate?wfo=afc
NO. Commerce City, CO (DENVER-CENTRAL PARK, CO) - https://www.weather.gov/wrh/climate?wfo=bou
NO Pueblo, CO - https://www.weather.gov/wrh/climate?wfo=pub
YES Boulder, CO 2.0 https://www.weather.gov/wrh/climate?wfo=bou
YES Littleton, CO 1.8 https://www.weather.gov/wrh/climate?wfo=bou
?? Castle Rock, CO M https://www.weather.gov/wrh/climate?wfo=bou
YES Lakewood, CO 1.0 https://www.weather.gov/wrh/climate?wfo=bou
?? Parker, CO (CoCoRaHS) M https://www.weather.gov/wrh/climate?wfo=bou
?? Aurora, CO M https://www.weather.gov/wrh/climate?wfo=bou
?? Westminster, CO M https://www.weather.gov/wrh/climate?wfo=bou
YES Highlands Ranch, CO 1.5 https://www.weather.gov/wrh/climate?wfo=bou
YES Arvada, CO (Wheat Ridge, CO) 1.1 https://www.weather.gov/wrh/climate?wfo=bou
NO Centennial, CO (Denver Centennial AP) - https://www.weather.gov/wrh/climate?wfo=bou
@BlueDragon I do not have relable data for Castle Rock, Parker, Aurora, and Westminster, as observational data was missing from the dataset. I will hold this open for the rest of the year in case anyone can point to NWS / observational data for any of those stations, otherwise I'll resolve to N/A.
@BlueDragon I took a last look at the remaining markets (all suburbs around Denver) and resolved based on the closest (geographically) observational record I could find. I resolved NA where there just wasn’t good data (this ended up being just two markets).
@BlueDragon I appreciate your effort. If I have time tomorrow, I will try to help you find data for (selfishly) atleast the bins I am in, which are mostly lower % ones.
@mint Aw thanks! I appreciate the help, and all the good thoughts and analysis folks are offering up. I’ll take it all in.
@BlueDragon It may have already been mentioned but the NOHRSC Total Snowfall (24 hrs) layer shows a lot of different official observations (not just gridded estimates) and has county lines, major roads, etc.
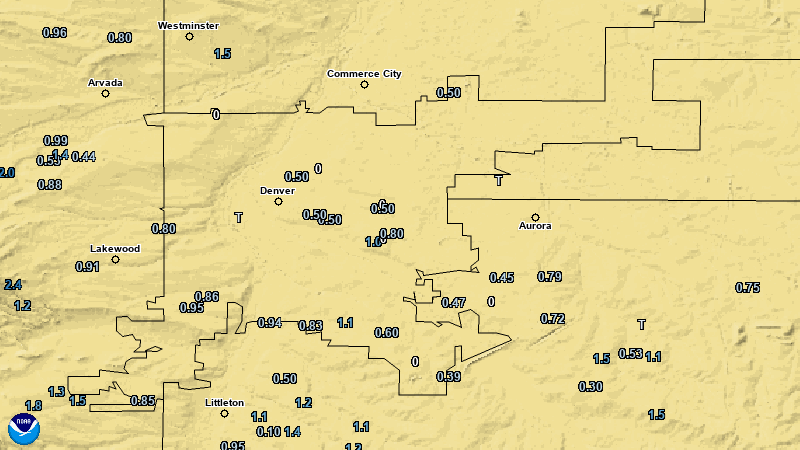
In my own opinion, the one thing that must be decided before resolving is which measurements to use. Since cities take up (often significant) land area, snowfall will always vary from station to station. Denver, CO is a good example: a lot of the suburbs got several inches of snow, and the west side of Denver appeared to get at least an inch. However, most of the city got only a trace or no snowfall, including the airport on the east side of the city. Sioux Falls, SD is another example.
@thepurplebull Valid point for clarification. Suburbs of Denver won’t count (unless they are listed out separately, several are). I’ll look at Juneau carefully and in general rule that if there is > 1 inch accumulation anywhere in city limits it counts.
@BlueDragon Ok, I've looked at this. According to the National Weather Service accumulation table for Juneau, accessed via https://www.weather.gov/wrh/Climate?wfo=ajk, so I'm going to resolve Juneau to NO. This just gets too messy if I go beyond this, I just have to go by the NWS "area" record.
The summit at Eaglecrest recorded 5.5" of snowfall in 24hrs and is within Juneau city limits. See https://www.weather.gov/aprfc/Snow_Depth
0 inches of snow reported in Mount Washington, NH, in the past 24 hours, with no snow expected in the next 24. https://mountwashington.org/weather/
@mint NH is in the middle of a big high-pressure area and not much moisture in the atmosphere. Nothing to see here
@kalassak Also seeing a lot of preliminary storm reports of 1-2 inches of snow in the Denver metro area
@kalassak My assumption is that the report will have to come from within Denver County due to the variation in the area. Denver Intl for example.
@thepurplebull I was just noting it at the time because NWS Boulder doesn't seem to report snowfall in the afternoon, and there are a bunch of suburbs in the market as well that do not have an explicit daily climate report. The midnight climate lists only trace snowfall for Denver, not sure where the observation is taken.
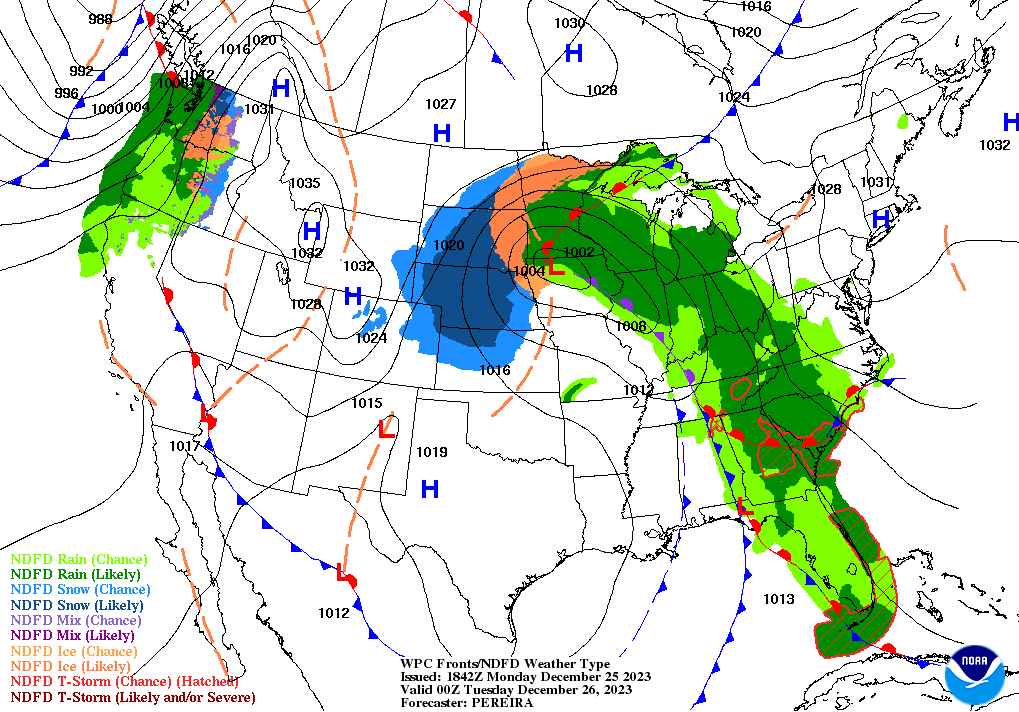
Edit: For CONUS only. Hopefully I haven't made any mistakes. Bet (not all the way up) on exceedance probabilities from latest WPC forecast (https://ftp.wpc.ncep.noaa.gov/pwpf/conus_2.5km/2.5kmpwpf_48hr/) for 48 hour period of 24th-25th.
These are the ones above 50% (there was one weird non-city that was listen in my cities database Security-Widefield, CO -- an unincorporated town, that I excluded):
Denver, Colorado: 1.0
Aurora, Colorado: 1.0
Lakewood, Colorado: 1.0
Arvada, Colorado: 1.0
Centennial, Colorado: 1.0
Highlands Ranch, Colorado: 1.0
Castle Rock, Colorado: 1.0
Parker, Colorado: 1.0
Littleton, Colorado: 1.0
Boulder, Colorado: 0.995
Westminster, Colorado: 0.995
Colorado Springs, Colorado: 0.99
Pueblo, Colorado: 0.98
Lafayette, Colorado: 0.98
Broomfield, Colorado: 0.965
Commerce City, Colorado: 0.9550000000000001
Thornton, Colorado: 0.91
Casper, Wyoming: 0.91
Security-Widefield, Colorado: 0.895
Lincoln, Nebraska: 0.88
Sioux City, Iowa: 0.86
Longmont, Colorado: 0.845
Grand Island, Nebraska: 0.845
Sioux Falls, South Dakota: 0.8300000000000001
Loveland, Colorado: 0.8150000000000001
Fort Collins, Colorado: 0.81
Omaha, Nebraska: 0.77
Moorhead, Minnesota: 0.755
Fargo, North Dakota: 0.75
Cheyenne, Wyoming: 0.75
Bellevue, Nebraska: 0.745
Greeley, Colorado: 0.74
Council Bluffs, Iowa: 0.71
Grand Forks, North Dakota: 0.66
Bismarck, North Dakota: 0.56
Rapid City, South Dakota: 0.56
Manhattan, Kansas: 0.56
Salina, Kansas: 0.505@parhizj You’ll help me with verifying each one, even if it seems obvious from regional weather patterns, whether each of these suburbs and small municipalities get >= one inch of snow on the 24th and 25th?
@BlueDragon I should be able to use the gridded data (these are gridded estimates not strict observations) from https://www.nohrsc.noaa.gov/snowfall/ once it becomes available… but the times will be approximate like my prediction since they go off UTC time.
Here are the accumulated Snowfall (in inches) for the 48 hours on 12-26 00Z (48 hours leading up to this date) for (nearest lat/lon) CONUS cities with > 40,000 people, based on the gridded data (projected grib) from the link I mentioned above.
Keep in mind: (1) this is the nearest lat/lon for the city on the projected gridded data and doesn't cover the city boundaries/all possible observations for the city (it is the nearest point estimate for the city center), and (2) it covers accumulated snowfall for Dec 24-25 in UTC time (so it possibly includes a few hours extra snowfall possible from late Dec 23 local time and few hours missing from late Dec 25 local time).
I only checked a few for sanity here on the interactive map:
Here is the result:
Castle Rock, Colorado              :  6.556
Lincoln, Nebraska                  :  6.396
Parker, Colorado                   :  5.658
Sioux City, Iowa                   :  5.648
Grand Island, Nebraska             :  5.519
Highlands Ranch, Colorado          :  4.802
Omaha, Nebraska                    :  4.270
Council Bluffs, Iowa               :  4.128
Fargo, North Dakota                :  3.857
Centennial, Colorado               :  3.439
Bellevue, Nebraska                 :  3.436
Sioux Falls, South Dakota          :  3.233
Littleton, Colorado                :  3.075
Moorhead, Minnesota                :  3.030
Lakewood, Colorado                 :  2.837
Arvada, Colorado                   :  1.816
Boulder, Colorado                  :  1.751
Casper, Wyoming                    :  1.540
Manhattan, Kansas                  :  1.504
Westminster, Colorado              :  1.376
Salina, Kansas                     :  1.319
Grand Forks, North Dakota          :  1.084
Cheyenne, Wyoming                  :  0.978
Broomfield, Colorado               :  0.974
Santa Fe, New Mexico               :  0.634
Aurora, Colorado                   :  0.573
Wichita, Kansas                    :  0.489
Pueblo, Colorado                   :  0.451
Thornton, Colorado                 :  0.441
Lafayette, Colorado                :  0.405
Topeka, Kansas                     :  0.390
Minot, North Dakota                :  0.387
Security-Widefield, Colorado       :  0.365
Hutchinson, Kansas                 :  0.339
Glens Falls, New York              :  0.329
Colorado Springs, Colorado         :  0.224
Saratoga Springs, New York         :  0.215
Utica, New York                    :  0.160
Bremerton, Washington              :  0.066
Greeley, Colorado                  :  0.047
Schenectady, New York              :  0.043
Bismarck, North Dakota             :  0.039
Billings, Montana                  :  0.036
Denver, Colorado                   :  0.033
Longmont, Colorado                 :  0.028
Yakima, Washington                 :  0.018
Wenatchee, Washington              :  0.017
Commerce City, Colorado            :  0.012
Spanish Fork, Utah                 :  0.009
Sparks, Nevada                     :  0.003
Edit: I've only included cities that had some positive snowfall.
@parhizj These numbers do not match up very well with the climate reports from NWS, where available. currently compiling a list of them and will report back later

Data compiled from NWS climate stations, where trained meteorological observers are measuring snow on the ground
My concern with the usage of the gridded data to potentially resolve these markets is that there are several inches (!) difference from the official climate measurements. Notably, the observed values are much lower than the gridded values. I'm surprised it's that far off, and I don't think it would be related to using 0z-0z data, but perhaps 06z as midnight would produce better results? That would match up with Central Standard Time at least and be only one hour off for Mountain, which is where much of the snow fell.
@kalassak with observations you will always see variation even with the span of a couple of blocks

I don’t know what’s better or worse to be honest considering I don’t know all the details of how the sausage is made.
@parhizj After looking at it some more, some of the low snow totals may be due to winds and a more exposed observing site (such as at airports). However, looking at storm reports from Fargo I don't see anything suggesting more than an inch of snow. So perhaps the gridded values are reliable but not near areas with complex precipitation type (like freezing rain, which Fargo has seen over half an inch to an inch of)
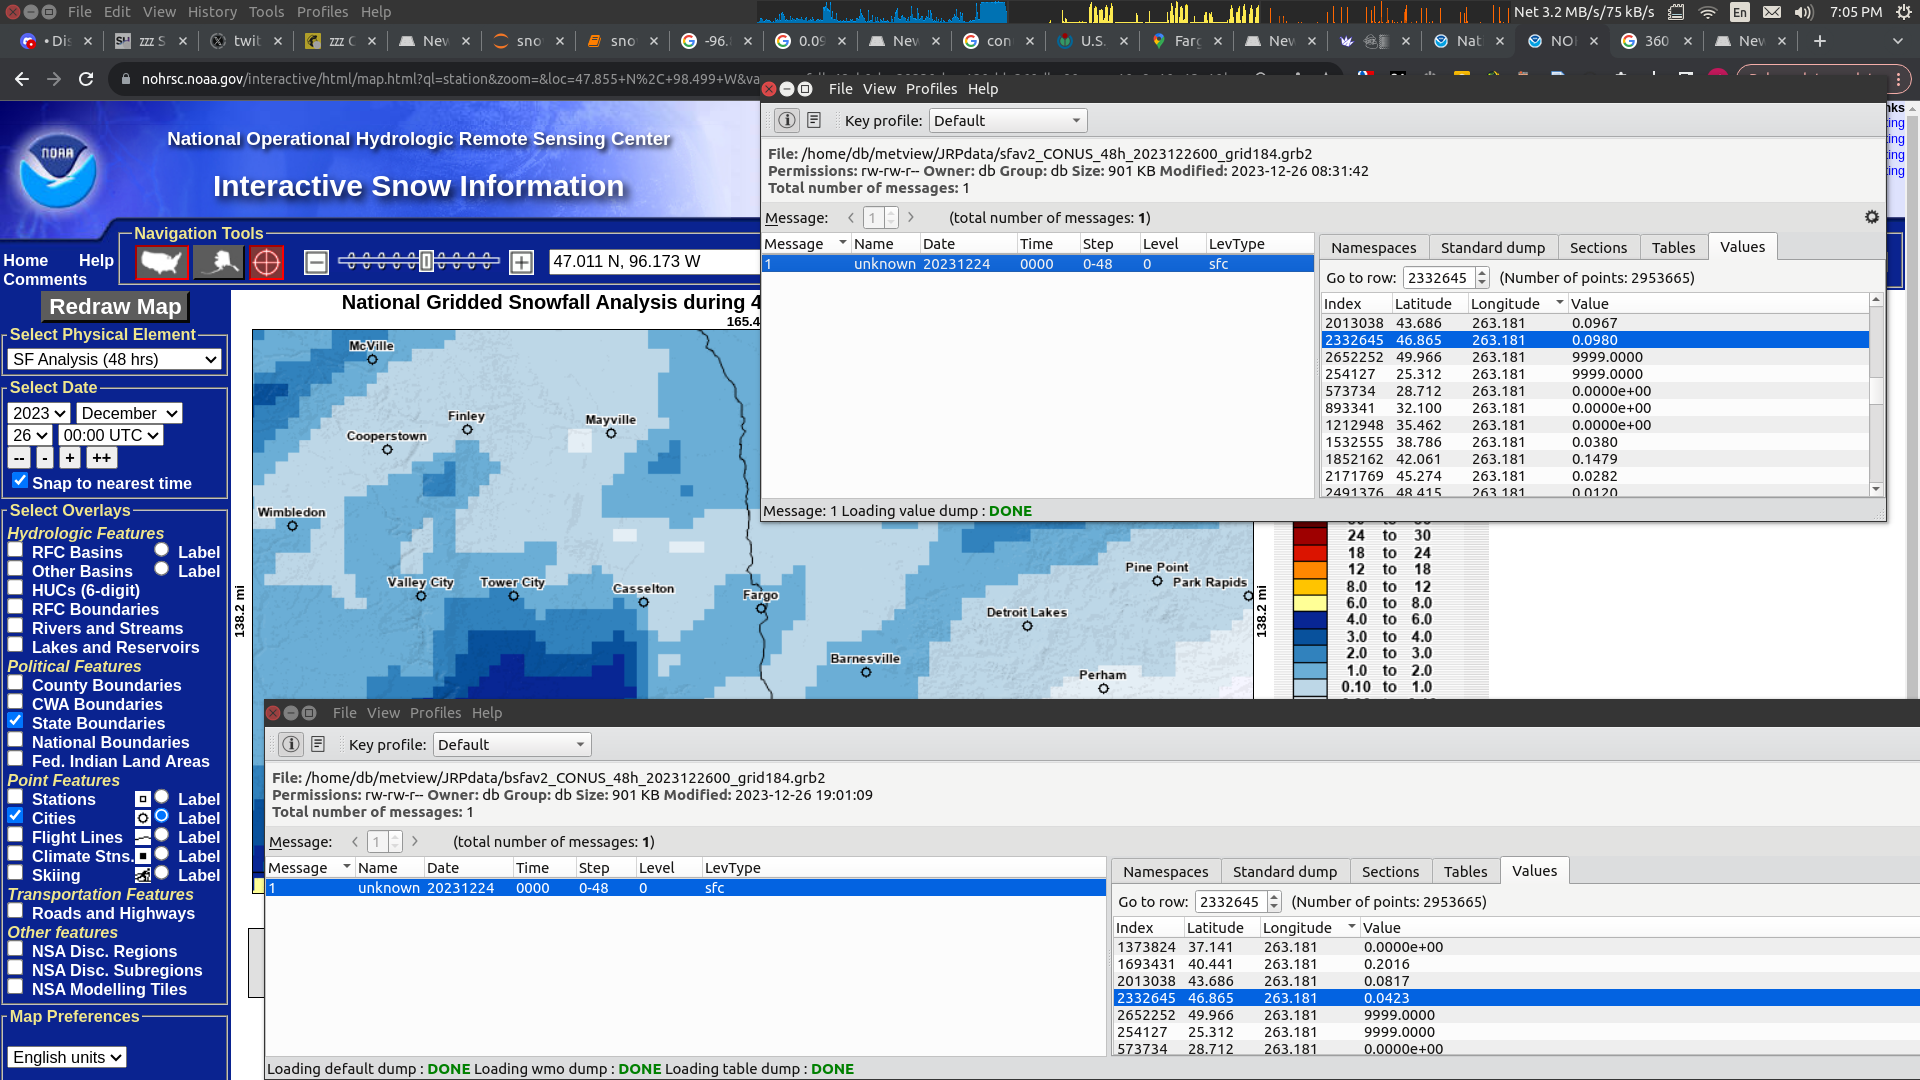
@kalassak Fargo does show a difference from the grib for the gridded data as compared to the same graphical version. I re-downloaded the "same" grib file and noticed it now contains different numbers! They must have had some corrections or adjustments made: (the top was the one I downloaded this morning, and the bottom is the one I downloaded just now) (measurements in the grib display are in meters).
Given your suggestions I'll download the 6 hour accumulation files for the period for Dec 24 06Z-Dec 26 06Z and add them up. This will take some time to code and run. I'll check back later when I'm done.
I redid the analysis for 6 hours increments (the following grib files) but it is still different than the graphical interface (I think it runs off different/stale gridded data, but this is only speculation). I checked the grib files to verify Fargo snowfall was correct (most of the snow (2+ inches) falling in the 6 hours ending on Dec. 25 00Z):
'sfav2_CONUS_6h_2023122406_grid184.grb2',
'sfav2_CONUS_6h_2023122412_grid184.grb2',
'sfav2_CONUS_6h_2023122418_grid184.grb2',
'sfav2_CONUS_6h_2023122500_grid184.grb2',
'sfav2_CONUS_6h_2023122506_grid184.grb2',
'sfav2_CONUS_6h_2023122512_grid184.grb2',
'sfav2_CONUS_6h_2023122518_grid184.grb2',
'sfav2_CONUS_6h_2023122600_grid184.grb2',
'sfav2_CONUS_6h_2023122606_grid184.grb2'
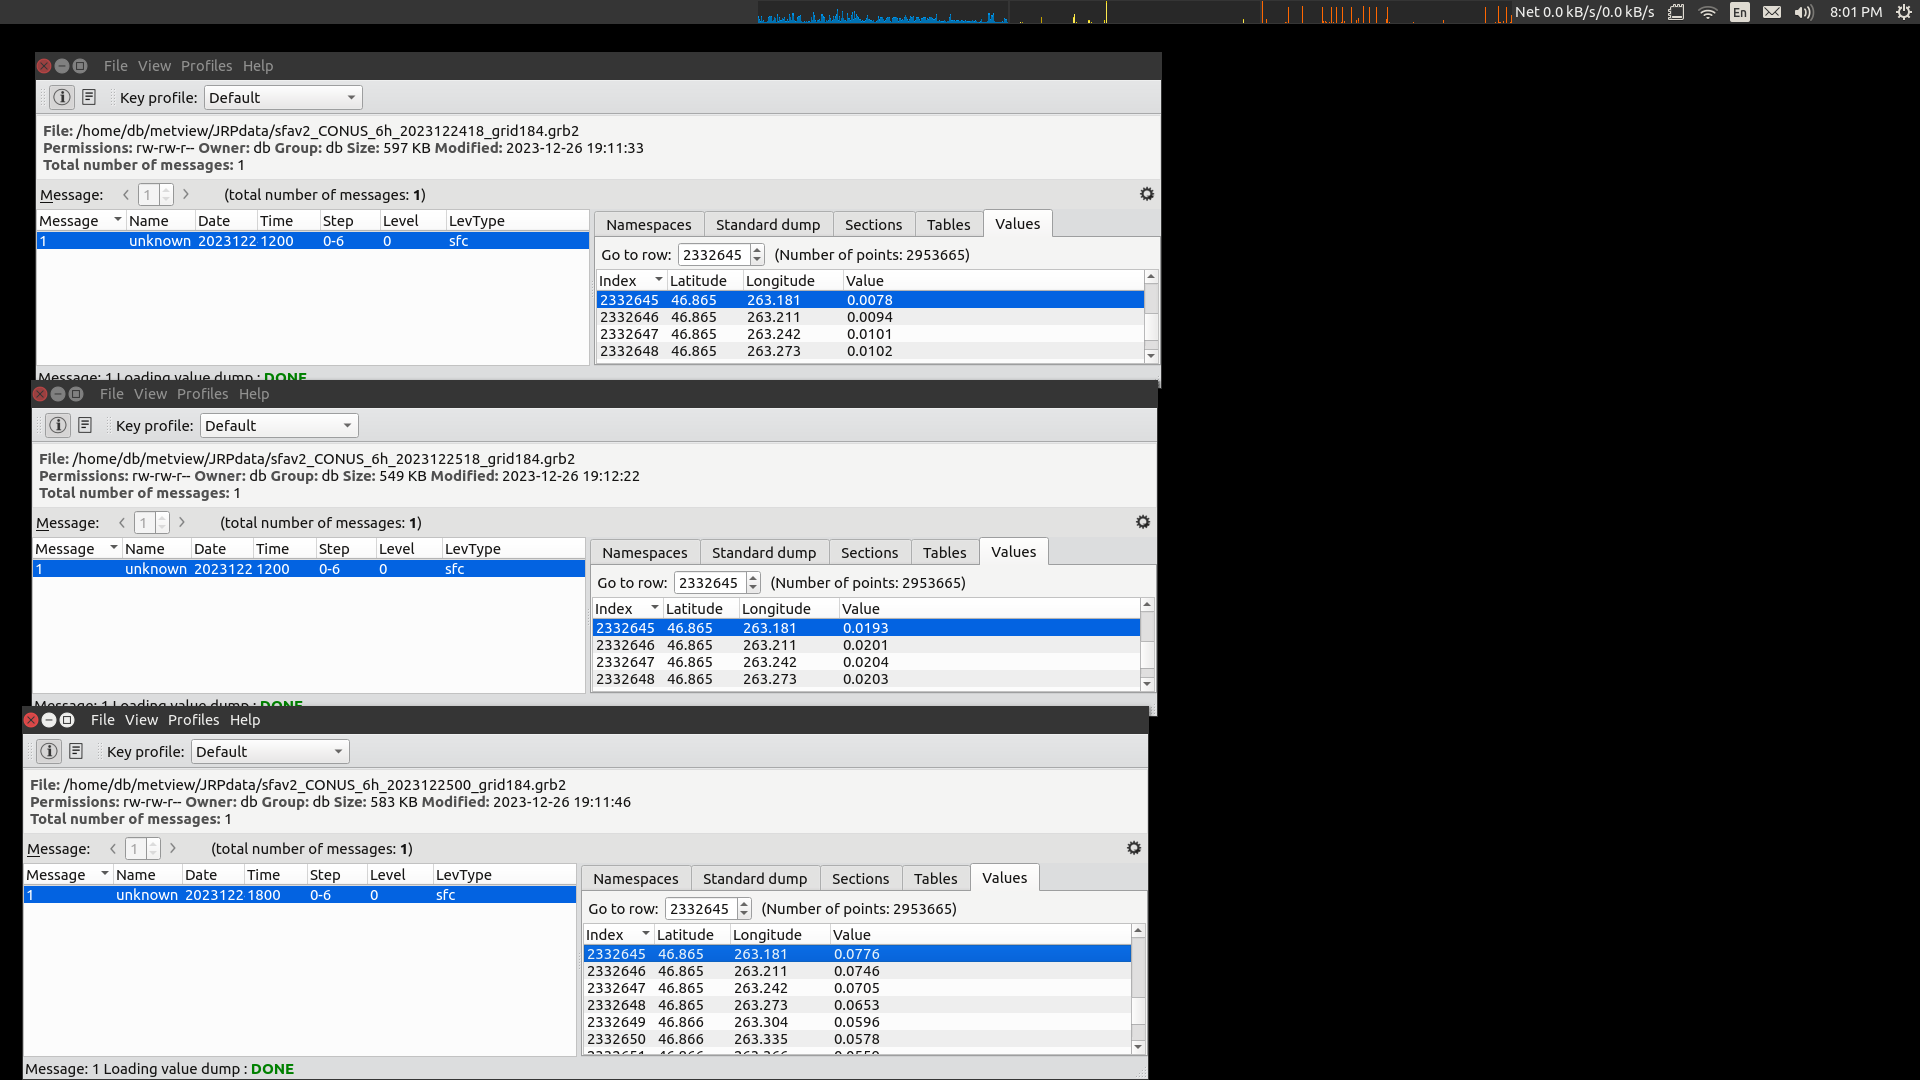
Which matches the image on the page:
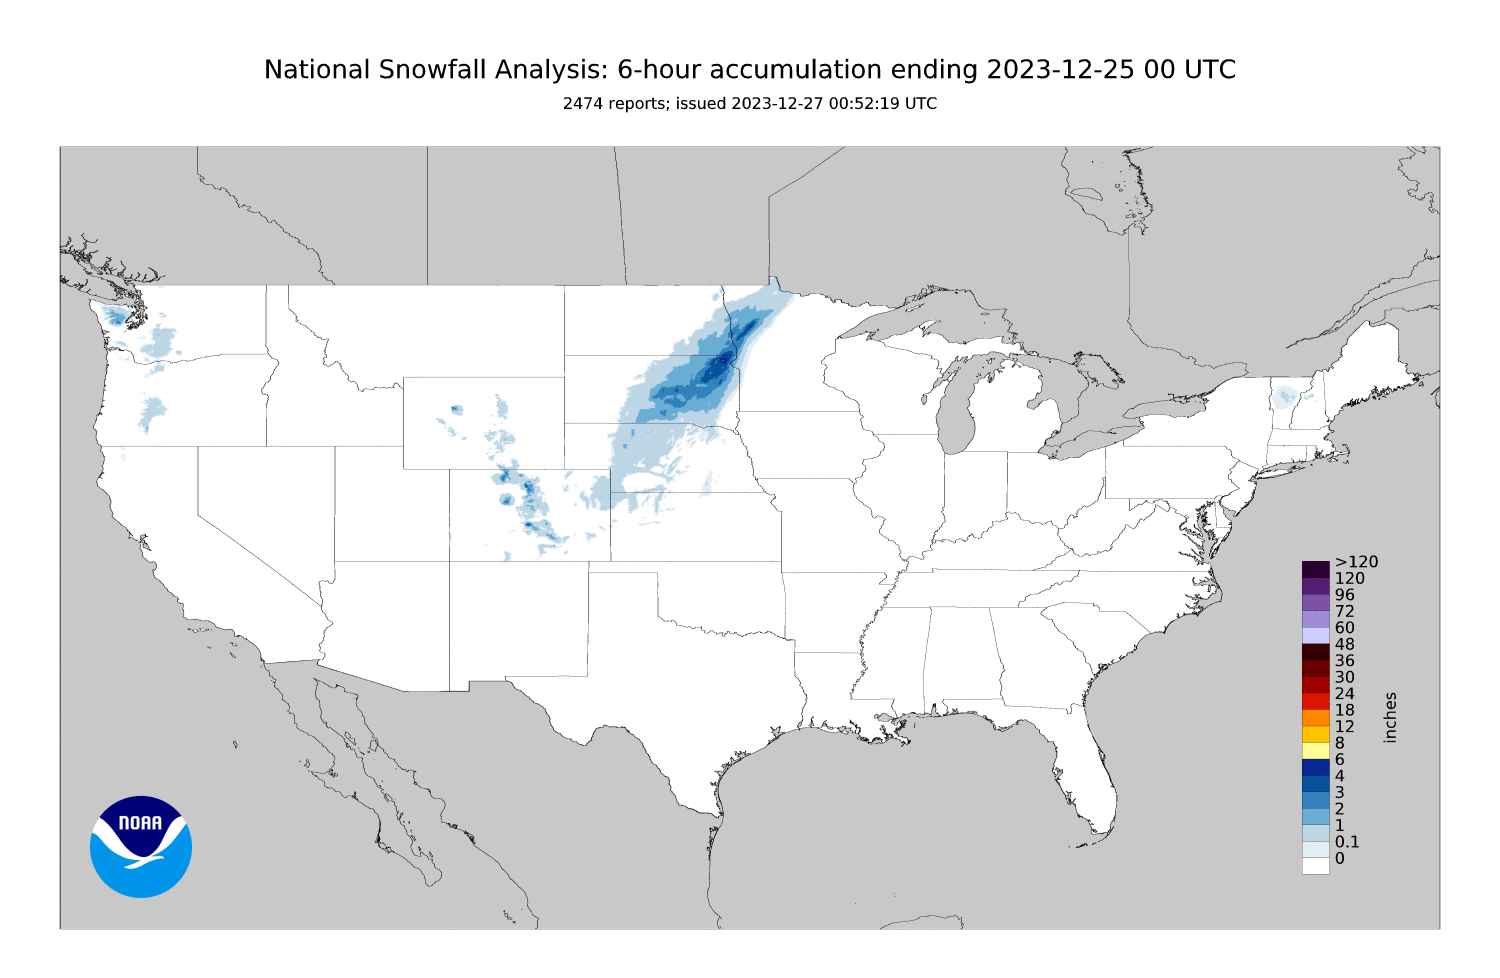
So this further check shows my program checking the gridded data doesn't seem to have any errors.
Looking at the graphic for https://www.nohrsc.noaa.gov/snowfall/ I noticed that they do continue to update the analysis based on new reports (It appears to be for a further 48 hours past the analysis time... so if anyone wants to wait another 48 hours from now I'll re-download the analysis gribs and run it again.)
Anyway, here is the updated gridded data for the snowfall totals for Dec 24 06Z to Dec 26 06Z:
Edit2 (Updated with latest Dec 28 data):
Lincoln, Nebraska                  :  5.721
Grand Island, Nebraska             :  4.447
Fargo, North Dakota                :  4.119
Moorhead, Minnesota                :  3.979
Castle Rock, Colorado              :  3.961
Parker, Colorado                   :  3.496
Omaha, Nebraska                    :  3.154
Lakewood, Colorado                 :  3.056
Highlands Ranch, Colorado          :  2.925
Sioux City, Iowa                   :  2.748
Littleton, Colorado                :  2.647
Centennial, Colorado               :  2.643
Salina, Kansas                     :  2.330
Boulder, Colorado                  :  2.117
Arvada, Colorado                   :  2.079
Council Bluffs, Iowa               :  1.942
Manhattan, Kansas                  :  1.926
Lafayette, Colorado                :  1.428
Westminster, Colorado              :  1.413
Aurora, Colorado                   :  1.351
Casper, Wyoming                    :  1.316
Sioux Falls, South Dakota          :  1.297
Broomfield, Colorado               :  1.274
Santa Fe, New Mexico               :  0.988
Grand Forks, North Dakota          :  0.794
Bellevue, Nebraska                 :  0.715
Hutchinson, Kansas                 :  0.704
Wenatchee, Washington              :  0.683
Cheyenne, Wyoming                  :  0.675
Minot, North Dakota                :  0.427
Glens Falls, New York              :  0.422
Denver, Colorado                   :  0.422
Thornton, Colorado                 :  0.367
Topeka, Kansas                     :  0.252
Utica, New York                    :  0.227
Commerce City, Colorado            :  0.215
Saratoga Springs, New York         :  0.161
Rapid City, South Dakota           :  0.154
Billings, Montana                  :  0.120
Pueblo, Colorado                   :  0.109
Colorado Springs, Colorado         :  0.105
Security-Widefield, Colorado       :  0.101
Loveland, Colorado                 :  0.078
Longmont, Colorado                 :  0.065
Olathe, Kansas                     :  0.060
Logan, Utah                        :  0.057
Sandy, Utah                        :  0.050
Millcreek, Utah                    :  0.049
Schenectady, New York              :  0.046
Yakima, Washington                 :  0.046
Draper, Utah                       :  0.039
Bismarck, North Dakota             :  0.038
Greeley, Colorado                  :  0.035
Murray, Utah                       :  0.034
Lehi, Utah                         :  0.029
Eagle Mountain, Utah               :  0.023
Orem, Utah                         :  0.021
Taylorsville, Utah                 :  0.020
Fort Collins, Colorado             :  0.019
Herriman, Utah                     :  0.017
Salt Lake City, Utah               :  0.016
Provo, Utah                        :  0.016
Riverton, Utah                     :  0.016
South Jordan, Utah                 :  0.015
Syracuse, New York                 :  0.014
Bountiful, Utah                    :  0.014
West Jordan, Utah                  :  0.014
Lenexa, Kansas                     :  0.013
West Valley City, Utah             :  0.013
Spanish Fork, Utah                 :  0.013
Concord, New Hampshire             :  0.006
Fitchburg, Massachusetts           :  0.006
Bremerton, Washington              :  0.006
Kansas City, Kansas                :  0.004
Grand Junction, Colorado           :  0.004