The winning range is the range that includes the number of votes that separate the two top vote-getters in the closest state by raw vote. This state need not be decisive in the election, it simply must have the closest popular vote margin between the top two candidates.
For the purposes of this market, the District of Columbia counts as a state.
This market will close when all states have certified their popular vote results.
🏅 Top traders
| # | Name | Total profit |
|---|---|---|
| 1 | Ṁ1,411 | |
| 2 | Ṁ1,131 | |
| 3 | Ṁ937 | |
| 4 | Ṁ733 | |
| 5 | Ṁ658 |
@traders NH is the closest state by raw vote total with a margin of 22,965 votes. Accordingly, this market resolves to the 20001-30001 bracket. Please reply to this comment if you have any questions or would like to dispute the resolution.
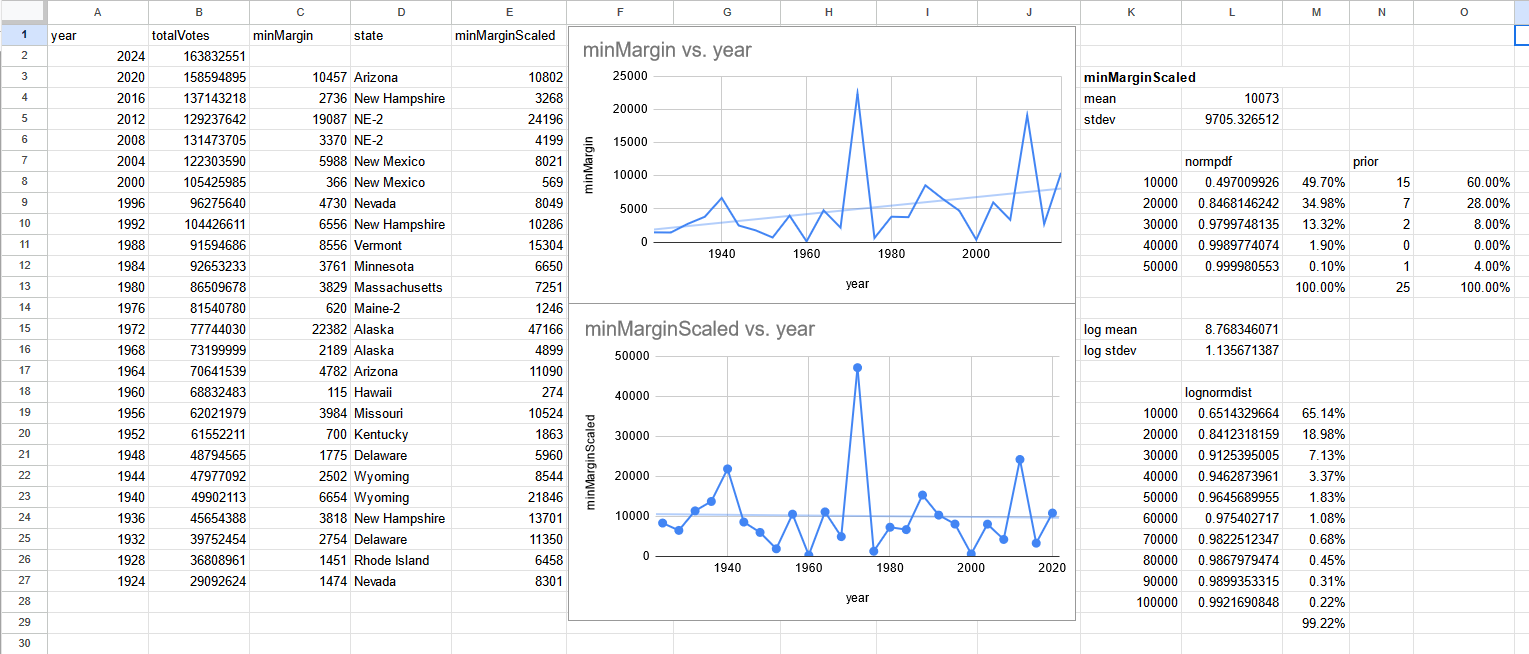
Modelling based on prior 25 elections (arbitrary stopping point bc cbf getting all data):
https://docs.google.com/spreadsheets/d/1CZ7dHE3UD5Q9oi-pJcm8BF0YJsR0_uh2DObKfDL9mAU/edit?usp=sharing

Scaling based on total votes removes correlation by year. Seems like a log normal distribution. Based on prior alone 0-10000 is still undervalued.
Biggest outlier is 1972, Nixon's 49 state landslide, which is probably <0.1% chance of happening in 2024.
@cthor I think NE-2 and ME-2 don't count as states for the purposes of this market, but would need @AaronSimansky to confirm.
@AaronSimansky Are ME and NE not counted at all? Or are the votes in e.g. NE 1-3 added together to get a total state count?
@SentientTree This does put 2012 at 39643 in New Hampshire, which kind of throws my whole model out of wack, since normalizing by total votes doesn't remove the correlation by year now. 😭
@SentientTree @cthor The statewide vote is considered. Both ME and NE appoint individual electors based on the winner of the popular vote within each Congressional district and then 2 "at-large" electors based on the winner of the overall state-wide popular vote. Accordingly, the overall state-wide popular vote used to appoint the 2 "at-large" electors is considered.
If we assume a (roughly) normal distribution of vote differentials in swing states, any state within 1 standard deviation of a tie has 1 vote as the modal margin of victory (since Bell curve is concave down between -1 and +1 sigma). All 7 swing states fit that criterion.
Then we're taking the min of all those distributions which only increases the likelihood of a small margin of victory.
@SentientTree perhaps correlation? I know for 1 state it's essentially a folded normal (reminded me of https://www.metaculus.com/questions/5426/senate-control-after-2020-decided-by-x-votes/ )
i.e. P(Kamala or Trump win all 7 swing states while VA, NH, FL, TX not within 1%) could be ~20% in which case this is the minimum of 7 states that are mean ~4%, std dev 2%.
I'm just speculating for sake of contrarianism, you're probably right but the faulty assumption you might have is assuming independence between states.
@ChinmayTheMathGuy I was just arguing that the 1-10000 bar should be the highest, which the market has corrected for. That doesn't rely on independence between states because each state is folded normal as you said, and folded normal is monotonically decreasing when std dev > mean.
I think Nevada in particular is important to note here since it has a smaller voting population of about 1.4m and is distributed folded normal with mean ~0%, std dev ~2.5%. So for just Nevada the 1-10000 bar is already 8% higher than the 10001-20000 bar. Taking the min across all states can only increase the difference between those bars, regardless of what the correlations between states are.
